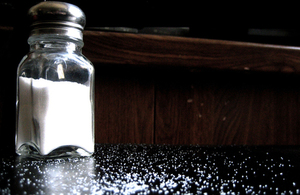
New PHE data on salt consumption levels
The National Diet and Nutrition Survey (NDNS) shows that on average adults are eating 8 grams of salt per day.
Adults have cut their average salt consumption by 0.9 grams per day in the decade from 2005 to 2014 according to new data from Public Health England’s National Diet and Nutrition Survey.
Average salt consumption for adults in 2014 was 8.0 grams per day. This has decreased from 8.5 grams in 2011 and 8.8 grams in 2005/06. Overall salt intake has fallen by 11% since the 2005 to 2006 survey.
Public Health England commissioned an assessment of the salt content of 24-hour urine collections made from May to September 2014. A random sample of 689 adults aged 19 to 64 years, designed to be representative of adults in England, took part in the study.
This report continues the series of urinary sodium surveys across the general adult population in United Kingdom countries since 2005/06. The results are used by government to monitor progress towards the recommended maximum salt intake for adults of no more than 6 grams per person per day.
Too much salt in the diet can raise blood pressure which increases the risk of heart disease and stroke. A reduction in average salt intake from 8g to 6g per day is estimated to prevent over 8000 premature deaths each year and save the NHS over £570million annually.
Dr Alison Tedstone, chief nutritionist at PHE, said:
Our analysis makes clear that there is a steady downward trend in salt consumption. While people are having less salt than 10 years ago, we are still eating a third more than we should.
The majority of the salt we eat is in everyday foods so it’s important to check labels and choose lower salt options. Many manufacturers and retailers have significantly reduced the salt levels in everyday foods. However, more needs to be done, especially by restaurants, cafes and takeaways.
Around three quarters of the salt that we eat is found in the foods we buy. The PHE Change4Life healthy living campaign offers tips and advice on how to cut down on salt in the diet including checking labels on food. Where colour-coding is used, red means high. Try to eat high-salt foods only occasionally, or in small amounts, and aim to eat mainly foods that are green (low) or amber (medium).
Ends
Background information
Public Health England exists to protect and improve the nation’s health and wellbeing, and reduce health inequalities. It does this through world-class science, knowledge and intelligence, advocacy, partnerships and the delivery of specialist public health services. PHE is an operationally autonomous executive agency of the Department of Health. Twitter: @PHE_uk, Facebook: www.facebook.com/PublicHealthEngland.
The Scientific Advisory Committee on Nutrition (SACN) published its report on Salt and Health in 2003 which endorsed the earlier recommendation of its predecessor; the Committee on Medical Aspects of Food and Nutrition Policy (COMA), that population salt intake should be reduced to no more than 6 grams/day for adults. Following this publication, the government began a programme of reformulation work with the food industry aimed at reducing the salt content of processed food products. Voluntary salt reduction targets were first set in 2006 for a range of food categories that contribute the most to the population’s salt intakes.
These targets were revised in 2009 and 2011 to take account of industry achievements in salt reduction. In 2014 the Department of Health set new voluntary targets to be met by 2017, maintaining the focus on the food categories that contribute the most to the population’s salt intakes. Major retailers, manufacturers and eating out businesses are now working towards these targets.
Participants in the 2014 urinary sodium survey reported here were all aged 19 to 64 years, living in private households in England. They were recruited initially through a random digit telephone dialling method.
The 2014 urinary sodium survey was funded by Public Health England and carried out by NatCen Social Research and the Medical Research Council Human Nutrition Research (MRC HNR).
The sources of urinary sodium data, from 2005 and 2006 to 2014, used in the trend analysis were:
- England urinary sodium survey 2005 to 2006
- UK urinary sodium survey 2008 (England participants only)
- England urinary sodium survey 2011
- NDNS years 1 to 4, 2008 to 2012 (England participants only)
- England urinary sodium survey 2014
Results for the 2014 and previous urinary sodium surveys have been corrected to take account of changes over time in laboratory methods for analysing sodium. This means that the new values for the previous surveys are different from the original published values. The new corrected values are now comparable over time and these values have been used to calculate the trend in salt intake over time.
If you’re aged 40 to 74, you can expect to receive a letter from your GP or local council inviting you for a free NHS Health Check, which includes a check on your blood pressure.
UK Health Security Agency press office
10 South Colonnade
London
E14 5EA
Image courtesy pepperedjane, via flickr, under CC 2.0