Business population estimates for the UK and regions: 2019 statistical release (HTML)
Updated 14 January 2020

© Crown copyright 2020
This publication is licensed under the terms of the Open Government Licence v3.0 except where otherwise stated. To view this licence, visit nationalarchives.gov.uk/doc/open-government-licence/version/3 or write to the Information Policy Team, The National Archives, Kew, London TW9 4DU, or email: psi@nationalarchives.gov.uk.
Where we have identified any third party copyright information you will need to obtain permission from the copyright holders concerned.
This publication is available at https://www.gov.uk/government/statistics/business-population-estimates-2019/business-population-estimates-for-the-uk-and-regions-2019-statistical-release-html
Headline statistics
The number of private sector businesses in the UK at the start of 2019 was
5.9 million
5.82 million businesses were small (0 to 49 employees)
35,600 businesses were medium-sized (50 to 249 employees)
7,700 businesses were large (250 or more employees)
Compared with 2018, the private sector business population has increased by
3.5% (+200,000 businesses)
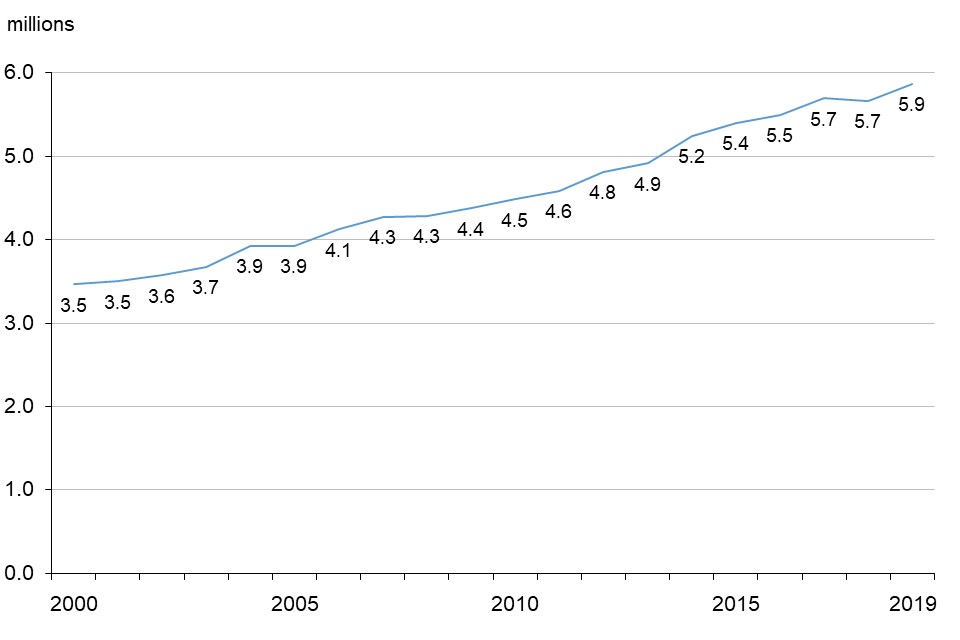
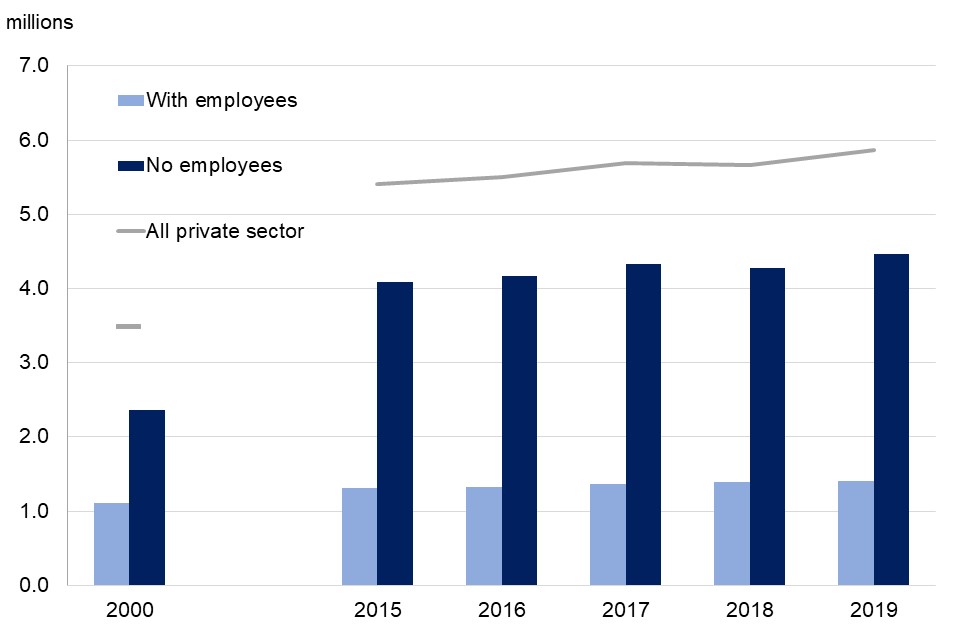
Figure 1: Number of private sector businesses in the UK, 2000 to 2019
Changes made to text to indicate availability of, provide description of, and link to data tools
Download this chart’s data (CSV, 1KB)
What you need to know about these statistics
This publication provides the only official estimate of the total number of private sector businesses in the United Kingdom (UK) at the start of each year. These estimates, produced by the Department for Business, Energy and Industrial Strategy (BEIS), cover a wider range of businesses than Office for National Statistics (ONS) outputs, which report on value-added tax (VAT) traders and pay as you earn (PAYE) employers. See related statistics section for links to ONS publications and Guide to business statistics explaining how each publication differs.
Composition of the 2019 business population
The UK private sector comprises largely of non-employing businesses and small employers, as shown in Table A. SMEs (small and medium-sized enterprises) account for 99.9% of the business population (5.9 million businesses). At the start of 2019:
- there were estimated to be 5.9 million UK private sector businesses
- 1.4 million of these had employees and 4.5 million had no employees
- therefore, 76% of businesses did not employ anyone aside from the owner(s)
- there were 5.82 million small businesses (with 0 to 49 employees), 99.3% of the total business population
- there were 35,600 medium-sized businesses (with 50 to 249 employees), 0.6% of the total business population
- a further 7,700 businesses were large businesses (with 250 or more employees), 0.1% of the total business population
Table A: Estimated number of businesses in the UK private sector and their associated employment and turnover, by size of business, start of 2019
| Business | Employment (thousands) | Turnover (millions) | |
|---|---|---|---|
| All businesses | 5,867,770 | 27,498 | 4,149,973 |
| SMEs (0-249 employees) | 5,860,085 | 16,630 | 2,168,005 |
| Small businesses (0-49 employees) | 5,824,500 | 13,157 | 1,528,684 |
| With no employees | 4,457,820 | 4,835 | 304,508 |
| All employers | 1,409,950 | 22,663 | 3,845,465 |
| of which: | |||
| 1-9 employees | 1,155,385 | 4,206 | 595,013 |
| 10-49 employees | 211,295 | 4,116 | 629,163 |
| 50-249 employees | 35,585 | 3,473 | 639,321 |
| 250 or more employees | 7,685 | 10,868 | 1,981,968 |
Notes for table A:
- turnover column: figures exclude Section K (financial and insurance activities) where turnover is not available on a comparable basis
- “with no employees” category comprises sole proprietorships and partnerships with only a self-employed owner-manager(s) and companies with one employee, assumed to be an employee director
Download this tables’s data (CSV, 1KB)
The 7,700 large businesses in the UK make a major contribution to employment and turnover. Nonetheless, SMEs account for three fifths of the employment and around half of turnover in the UK private sector. At the start of 2019:
- total employment in SMEs was 16.6 million (60% of the total), whilst turnover was estimated at £2.2 trillion (52%)
- employment in small businesses was 13.2 million (48%) and turnover £1.5 trillion (37%)
- employment in medium-sized businesses was 3.5 million (13%) and turnover £0.6 trillion (15%)
- employment in large businesses was 10.9 million (40%) and turnover £2.0 trillion (48%)
- further information on composition is shown in Table 1 in the detailed tables that accompany this publication, and in Figure 2
Figure 2: Contribution of different sized businesses to total population, employment and turnover, start of 2019
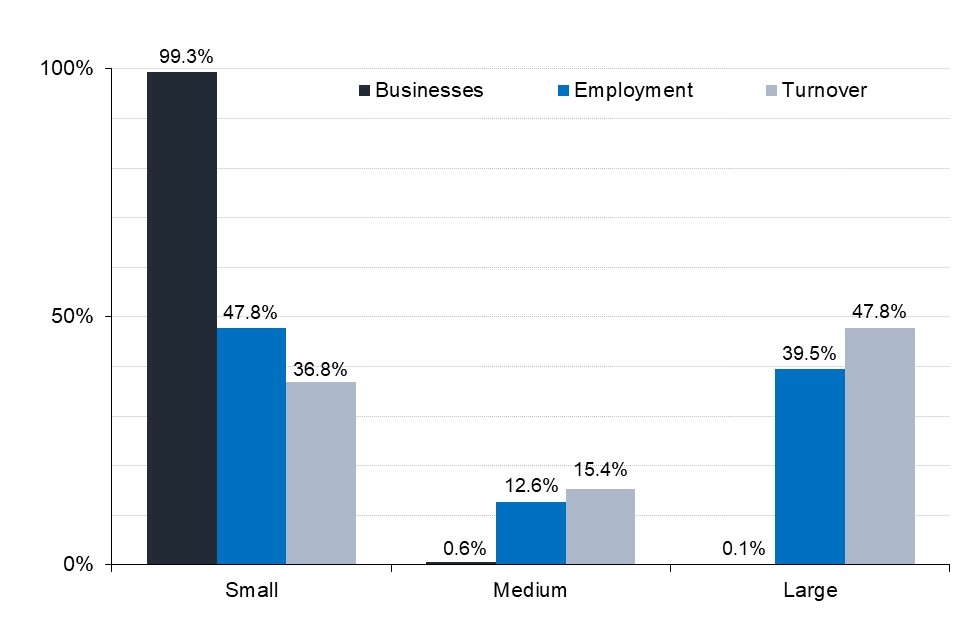
Note for figure 2: turnover figures exclude Standard Industrial Classification (SIC) 2007 Section K (financial and insurance activities) where turnover is not available on a comparable basis
Download this chart’s data (CSV, 1KB)
Legal form
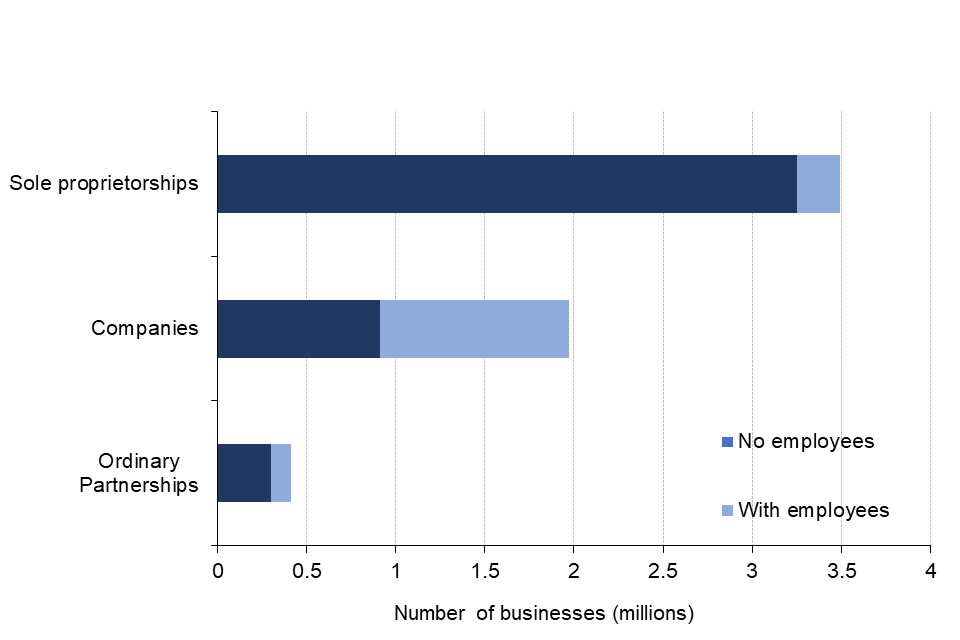
There are three main legal forms of businesses in the private sector; sole proprietorships, ordinary partnerships, and companies. Sole proprietorships are the most common legal form. At the start of 2019:
- the UK private sector business population comprised 3.5 million sole proprietorships (59% of the total), 2.0 million actively trading companies (34%) and 405,000 ordinary partnerships (7%)
- 1.1 million companies were employers, as were 239,000 sole proprietorships and 108,000 ordinary partnerships
- 3.3 million sole proprietorships, 910,000 companies and 296,000 ordinary partnerships did not employ anyone aside from the owner(s)
- further information on legal form is given in Figure 3 and Table C, and Table 3 of the detailed tables
Figure 3: Number of businesses in the UK private sector with and without employees, by legal status, start of 2019
Download this chart’s data (CSV, 1KB)
Registration for VAT and PAYE
Just over three quarters of UK private sector businesses are non-employers, and the majority of these are not registered for either VAT or PAYE. At the start of 2019:
- the Office for National Statistics recorded 2.6 million private sector businesses as registered for VAT or PAYE, 45% of the estimated total population
- 3.2 million businesses (55%) traded without being registered for VAT or PAYE and are classified here as ‘unregistered’
- 13% of sole proprietorships and 51% of ordinary partnerships were registered for VAT or PAYE
Trends in the business population
The total business population grew between 2018 and 2019 by 200,000 (3.5%). Since 2000 there has been an overall increase of just over two-thirds, as shown in Figure 1. Between 2000 and 2019:
- the business population increased by 2.4 million (+69%)
- the average rate of annual growth in the business population was +3%
- the highest rate of increase was +7% between 2003 and 2004, and between 2013 and 2014
- in contrast, there was a decrease in the business population (for the first time in the series) between 2017 and 2018 of 27,000 (-0.5%)
Between 2018 and 2019:
- there were 21,000 more (+1%) employing businesses and 180,000 more (+4%) non-employing businesses
- the net change in the business population is determined by the balance of new business start-ups (inflows) against those businesses that closed, merged or were taken over by another business (outflows)
- further information on trends is in Table B and C, Figures 4, 5 and 6, and Tables 25 to 28 of the detailed tables
Table B: Estimated number of businesses (in thousands) in the UK private sector by employment size-band, start of 2000, and 2015 to 2019
| 2000 | 2015 | 2016 | 2017 | 2018 | 2019 | |
|---|---|---|---|---|---|---|
| All private sector | 3,467 | 5,401 | 5,498 | 5,695 | 5,668 | 5,868 |
| All SME (0-249) | 3,460 | 5,394 | 5,491 | 5,687 | 5,660 | 5,860 |
| All small (0-49) | 3,433 | 5,362 | 5,457 | 5,653 | 5,625 | 5,825 |
| All employers (1+) | 1,111 | 1,312 | 1,325 | 1,367 | 1,389 | 1,410 |
| Non-employers | 2,356 | 4,089 | 4,173 | 4,328 | 4,278 | 4,458 |
| Micro (1-9) | 914 | 1,069 | 1,081 | 1,118 | 1,137 | 1,155 |
| Small (10-49) | 163 | 204 | 204 | 208 | 210 | 211 |
| Medium (50-249) | 27 | 33 | 33 | 34 | 35 | 36 |
| Large (250+) | 7 | 7 | 7 | 7 | 8 | 8 |
Download this table’s data (CSV, 1KB)
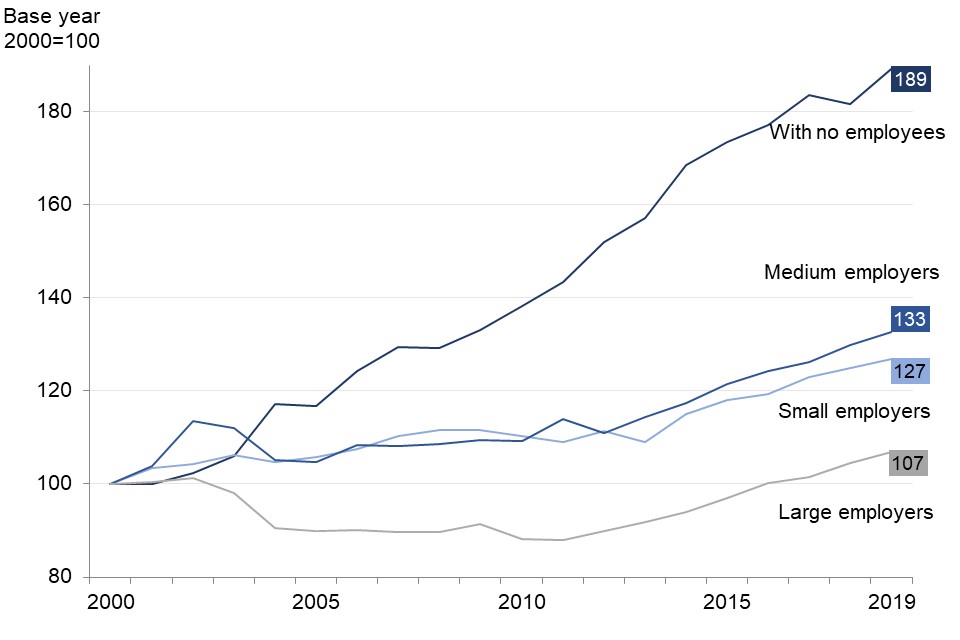
Growth in the UK private sector business population since 2000 has mainly been due to increasing numbers of non-employing businesses, as shown in Figures 4 and 5. Since 2000:
- the number of non-employing businesses has increased by 2.1 million (+89%)
- the number of employing businesses has increased by 299,000 (+27%)
- non-employing businesses accounted for 88% of total growth over the period
Figure 4: Growth in the number of UK private sector businesses by size band, 2000 to 2019 (index: base year = 2000)
Download this chart’s data (CSV, 1KB)
Figure 5: Non-employing and employing businesses in the UK private sector, 2000 and 2015 to 2019
Download this chart’s data (CSV, 1KB)
Overall the number of SMEs has increased by 2.4 million (+69%) since 2000, including 298,000 SME employers (+27%). Over this period:
- the number of small employing businesses grew by +27%
- the number of medium-sized employers grew by +33%
- the number of large businesses grew by +7%
In the last year, the number of companies increased by 62,000 (+3%) as did the number of sole proprietorships by 139,000 (+4%). Ordinary partnerships fell by 200 (less than 0.1%).
Looking at the period between 2010 and 2019:
- overall, the number of sole proprietorships grew by 733,000 (+27%) and the number of companies increased by 703,000 (+55%)
- in contrast, the number of ordinary partnerships fell by 51,000 (-11%)
Table C: Changes in the number of businesses, by legal status, between the start of 2018 and the start of 2019
| Sole proprietorships | Ordinary Partnerships | Companies | Total | |
|---|---|---|---|---|
| Unregistered businesses | 145,500 | 5,500 | N/A | 151,000 |
| Registered businesses | -6,600 | -5,600 | 61,600 | 49,300 |
| Of which | ||||
| with employees | -9,100 | -5,200 | 34,900 | 20,700 |
| without employees | 2,400 | -400 | 26,600 | 28,600 |
| All private sector | 138,900 | -200 | 61,600 | 200,300 |
Notes for table C:
-
numbers of businesses are rounded, in order to avoid disclosure. Consequently, totals may not exactly match the sum of their parts
-
unregistered business category comprise self-employed people working alone or in partnership
-
BPE methodology assumes all companies are registered, hence N/A value for unregistered companies
-
‘registered’ businesses are those businesses registered for VAT and/or PAYE
Download this table’s data (CSV, 1KB)
Figure 6: Percentage change in the number of VAT/PAYE registered and unregistered businesses by legal form, between the start of 2018 and the start of 2019
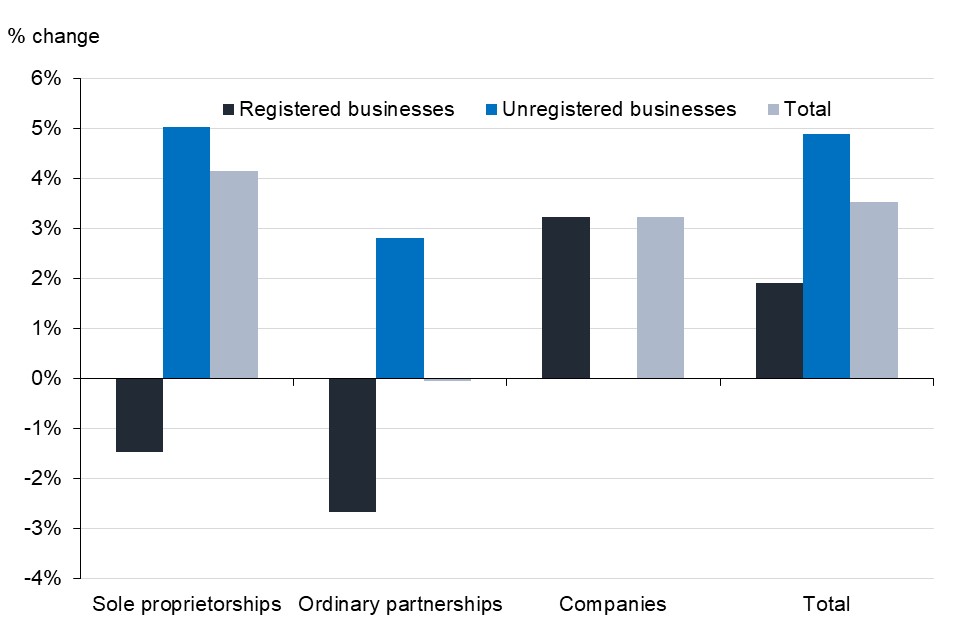
Notes for figure 6:
-
for Ordinary Partnerships, the total change was <-0.1%
-
the BPE methodology assumes all companies are registered: see paragraph 29 of the Methodology note
Download this chart’s data (CSV, 1KB)
In terms of employment trends:
- total employment across all private sector businesses increased from 27.0 million at the start of 2018 to 27.5 million at the start of 2019, a rise of 2%
- the SME share of total employment was 60% in 2019 and the proportion has remained the same since 2014
- total employment in SMEs increased from 16.3 million at the start of 2018 to 16.6 million at the start of 2019, a rise of 2%
- further information on employment trends is in Table 28 of the detailed tables
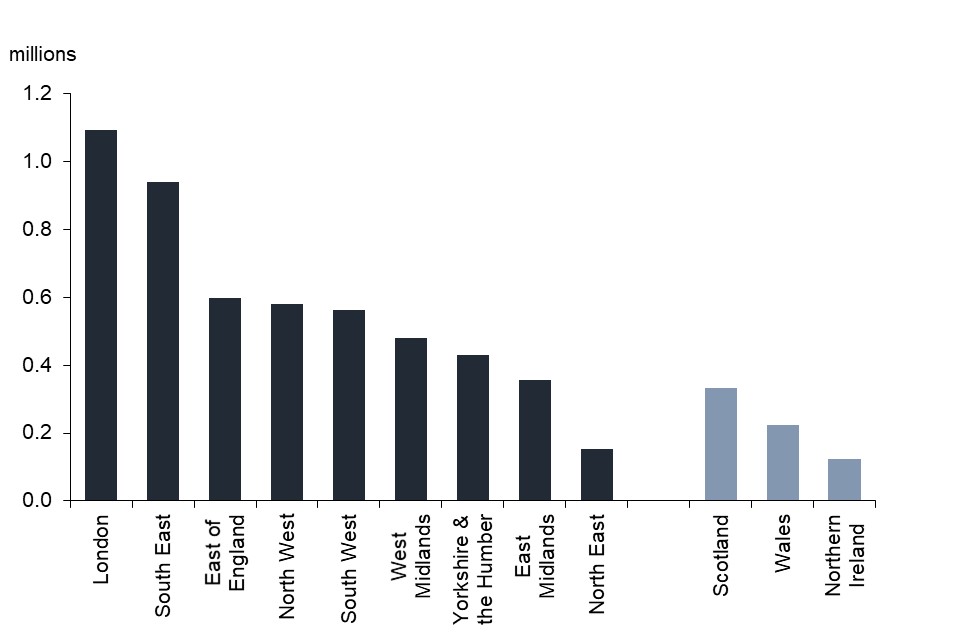
UK countries and the regions
Private sector businesses are not evenly distributed across the UK. Based on head office location, rather than location of specific branches/sites, London and the South East of England have considerably more businesses than any other UK country or region of England, as shown in Figure 7. At the start of 2019:
- there were 5.2 million private sector businesses in England, 334,000 in Scotland, 222,000 in Wales, and 124,000 in Northern Ireland
- London (1.1 million) and the South East of England (940,000) had the most private sector businesses, accounting for 35% of the UK business population
- the North East of England had 152,000 private sector businesses, the least of any English region
- further information on location is in Table 9 of the detailed tables
Figure 7: Number of private sector businesses by English region and UK country, start of 2019
Download this chart’s data (CSV, 1KB)
For regions and countries below UK level there is some volatility in estimates of year on year change. Looking in the longer term:
- the number of businesses has increased in all the UK countries and regions since 2010
- the biggest percentage increase in the number of businesses since 2010 was +52% in London
- the smallest percentage increase in the number of businesses since 2010 was +4% in Northern Ireland.
- further information on regional trends is in Table 26 of the detailed tables
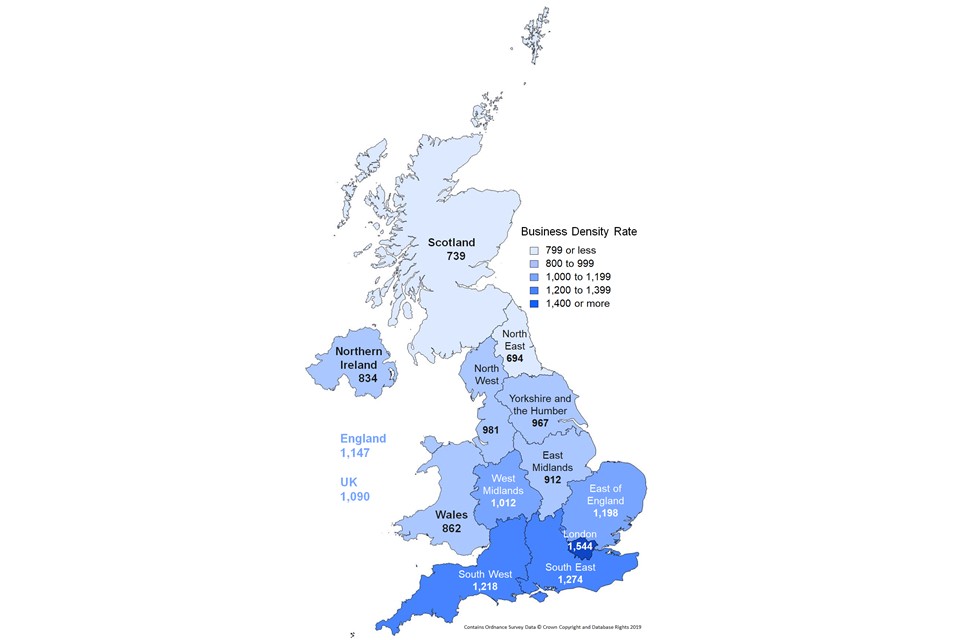
Along with the South West, London and the South East of England also had the highest business density rates in the UK, based on the size of the resident adult population, as shown in Figure 8. At the start of 2019:
- London (1,544) had the highest number of businesses per 10,000 resident adults
- there were also relatively high rates in the South East of England (1,274), the South West of England (1,218), and the East of England (1,198)
- the North East of England had the lowest business density rate (694) of any English region or UK country
- Scotland (739), Northern Ireland (834), Wales (862) and East Midlands (912) also had relatively low business density rates compared to the UK average.
- further information on business density is in Table 8 in the detailed tables
Figure 8: Number of businesses in the UK private sector per 10,000 adults, UK region and country, start of 2019
Download this chart’s data (CSV, 1KB)
Industries
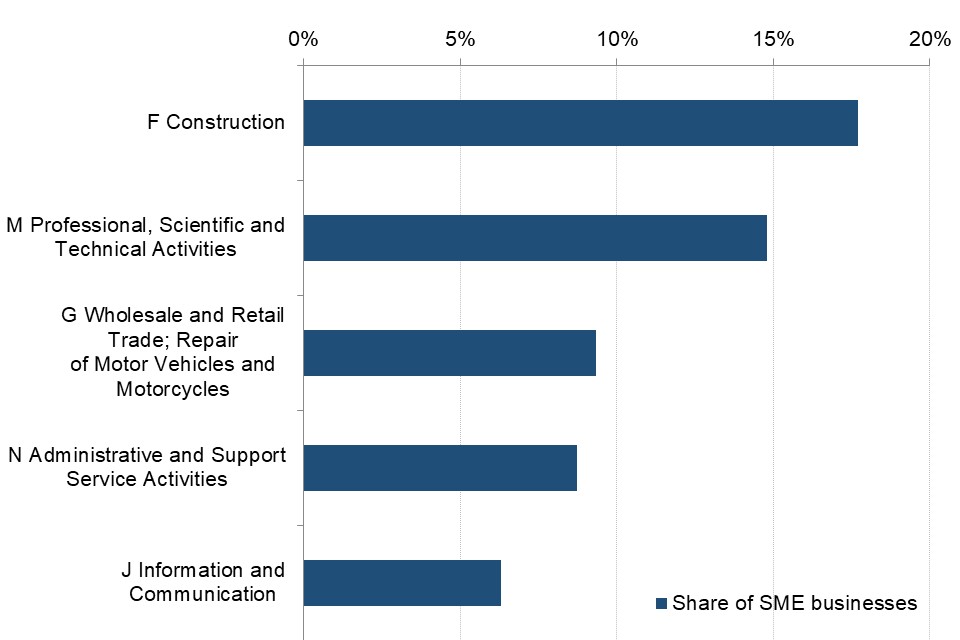
SMEs account for at least 99.5% of the overall population in each of the main industry sectors and are therefore distributed similarly to the business population overall. At the start of 2019:
- nearly a fifth (1.0 million) of all SMEs were operating in Construction, as shown in Figure 9, compared with less than 1% in the Mining, Quarrying and Utilities sector (36,000)
- there were also a considerable number of SMEs operating in the Professional, Scientific and Technical Activities (867,000 or 15%), and Wholesale and Retail Trade and Repair sectors (546,000 or 9%)
Figure 9: Industrial sectors with most SMEs, as percentage of total SME numbers, start of 2019
Download this chart’s data (CSV, 1KB)
SMEs accounted for 60% of employment and 52% of turnover at the start of 2019. Wholesale and Retail Trade is the industrial sector which has the highest share of both SME employment and turnover, see Figure 10. At the start of 2019:
- Wholesale and Retail Trade and Repair accounted for 14% of all SME employment and just over a third of SME turnover in the UK private sector
- almost a third of SME turnover was spread across three more sectors: Construction (12%), Professional, Scientific and Technical (10%) and Manufacturing (9%)
- further information for industries is in Table 5 in the detailed tables
Figure 10: Industrial sectors with highest SME turnover and employment, as percentage of total SME employment and turnover, start of 2019
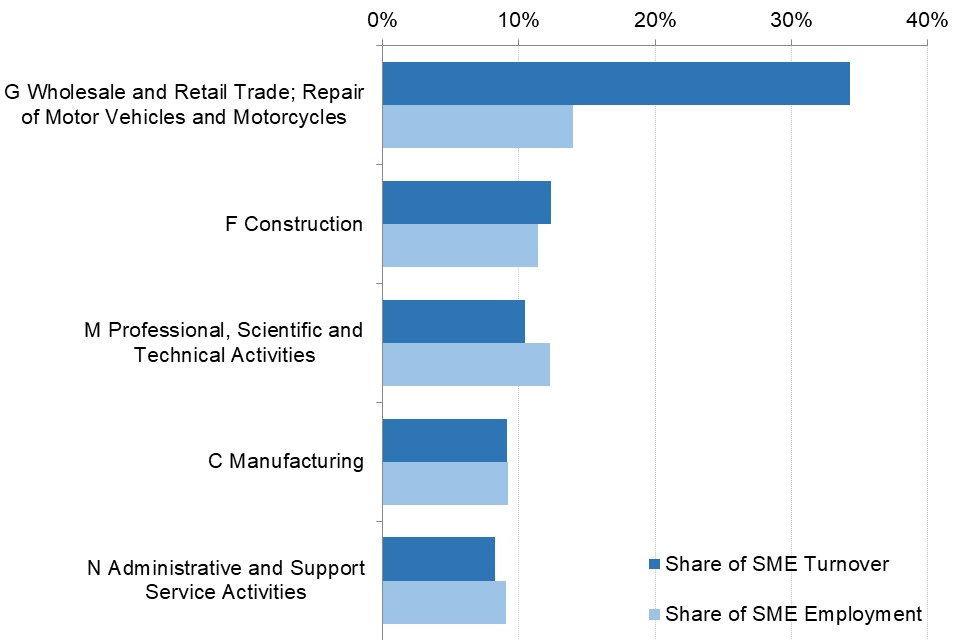
Note for figure 10: turnover figures exclude SIC 2007 Section K (financial and insurance activities) where turnover is not available on a comparable basis
Download this chart’s data (CSV, 1KB)
Large businesses accounted for 40% of employment and 48% of turnover - at the start of 2019:
- Wholesale and Retail Trade and Repair accounted for 25% of all large business employment and a third of large business turnover in the UK private sector
- the second largest sector in terms of large business employment was Administrative and Support Service Activities, which accounted for 15% of the total
- the second largest sector in terms of large business turnover was Manufacturing, which accounted for 21% of the total
Technical information
This publication is the latest in a series providing estimates of the total number of private sector businesses in the UK. This publication estimates the total number of UK private sector businesses at a point in time, including those that are registered for VAT or PAYE and those that are unregistered. Related ONS publications report only on VAT/PAYE registered businesses.
A guide explaining how this publication relates to other National Statistics on business population and demography has been published to help users understand the differences and choose the most appropriate source.
There is no single database containing all private sector businesses in the UK. The main source for this publication is the Inter-Departmental Business Register (IDBR), managed by ONS, which is used to provide the number of VAT/PAYE registered businesses in the UK. This publication also includes estimates of smaller non-employing (unregistered) businesses which are calculated using a combination of information from the ONS Labour Force Survey and HM Revenue and Customs (HMRC) self-assessment tax return data. More detail of the estimation process is provided in the Methodology and quality note.
Companies can take a range of legal forms, including Public Limited Companies, Private Limited Companies, Limited Liability Partnerships, and others. The IDBR only counts actively trading companies, rather than all those recorded on the Companies House register.
This edition uses the same methodology as that used since the 2011 edition of this publication. However, the methodology is not directly comparable to that used for BPE 2010 or to the older SME Statistics series (1994 to 2009).
To enable robust comparison over time, a time series is calculated using the latest methodology and data. This shows annual estimates of numbers of private sector businesses in the UK between 2000 and 2019. Estimates for UK countries and English regions and for different legal forms are provided for years since 2010 (the first year for which consistent estimates can be produced).
Known impacts from changes to HMRC systems have been adjusted for – further details are in the methodology note.
Information on the employment and turnover in these businesses is also provided. The function of the employment and turnover data provided is primarily to (i) classify businesses by employee size band and (ii) calculate shares of employment and turnover across industrial sectors, regions and legal statuses. This release includes an employment time-series in Table 28 of the detailed tables. However, users should note that these employment estimates are indicative and that ONS publishes other sources of employment data more suitable for monitoring total jobs and people in employment. See the Workforce Jobs series, the Business Registers Employment Survey (BRES), and the wider Labour Market Statistics (refer to the Methodology and quality note for more information).
All statistics relating to 2019 released in this publication are new. In contrast to previous editions of this release, no data from earlier years have been revised despite the availability of re-weighted ONS Labour Force Survey data. Examination of the effects of re-weighting revealed them to have a relatively minor impact on the time series and, as the change is based on survey data (which has uncertainty within it), it was decided not to revise the time series.
The definition of the private sector used in this publication excludes the non-profit sector but includes public corporations and nationalised bodies.
Turnover data throughout this release excludes SIC2007 Section K (Financial and insurance activities) as turnover is not available on a comparable basis.
Businesses that have sites (and employees) in more than one region or country are counted here only in the region or country where they are registered. These estimates may therefore differ from actual employment in a region, since some people in one region will work for businesses that are registered in another region.
All figures and percentages in this document are rounded. Therefore, totals may not exactly match the sum of their parts. Suppression and controlled rounding have been used to protect the data in this publication from disclosure. For further information, refer to the Methodology and quality note.
Definitions and terminology
| Term | Description |
|---|---|
| Company | Companies can take a range of legal forms, including Public Limited Companies, Private Limited Companies, Limited Liability Partnerships, and others such as public corporations and nationalised bodies in which the working directors are classed as employees |
| Employers | a company with a single employee director is treated as having no employees |
| Large business | a business with 250 or more employees |
| Medium-sized business | a business with 50 to 249 employees |
| Ordinary partnership | a business run by two or more self-employed people |
| Small business | a business with 0 to 49 employees |
| Small and medium-sized enterprises (SMEs) | businesses with 0 to 249 employees |
| Sole proprietorship | a business run by one self-employed person |
Further information
Future updates to these statistics
The next publication in this series is scheduled for Autumn 2020.
Related statistics
UK business; activity, size and location, published annually by the ONS, gives information about UK businesses broken down by legal status, industry, region, employment and turnover size bands.
Business Demography, published annually by the ONS, provides information on births, deaths and survivals of businesses in the UK, by geographical areas and standard industrial classification groups.
Businesses in Scotland, published annually by the Scottish government, provides information on numbers of enterprises (businesses) operating in Scotland, broken down by industry, business size, local authority area, urban and rural area and country of ownership.
Business Structure, published annually by the Welsh Government, contains data on the estimated number of businesses active in Wales.
Northern Ireland business; activity, size and location, published annually by the Northern Ireland Statistics and Research Agency, provides an overview of Northern Ireland’s business population.
Revisions policy
The BEIS statistical revisions policy sets out the revisions policy for these statistics, which has been developed in accordance with the UK Statistics Authority Code of Practice for Statistics.
Uses of these statistics
This publication is used extensively by government, the public, public bodies and businesses to analyse the scale, structure and significance of the total business population in the UK and to monitor change over time. For example, they are used by:
- government in understanding the likely impact of policy changes and monitoring the impact of recessions on different sections of the business population
- businesses in understanding market share and planning marketing strategies
- banks in developing an understanding of their customer base
- foreign firms in making UK location decisions
- academics to inform research into businesses at a local and national level
- a range of public bodies in decision making and in evaluating the success of regeneration and business-related policies
- public and private business support providers in targeting business support
User engagement
Users are encouraged to provide comments and feedback on how these statistics are used and how well they meet user needs.
The Business Population and Demographics Statistics (PDF) (BPDS) user group provides a forum for discussion of statistics and statistical research on the business population and demographics and is open to users based in central and local government, academia and the private sector.
The BEIS statement on statistical public engagement and data standards sets out the department’s commitments on public engagement and data standards as outlined by the Code of Practice for Statistics.
Get in touch
Comments about this statistical release and its usage are welcomed. Send to: business.statistics@beis.gov.uk
National Statistics designation
National Statistics status means that our statistics meet the highest standards of trustworthiness, quality and public value, and it is our responsibility to maintain compliance with these standards. The designation of these statistics as National Statistics was confirmed in October 2012 following an assessment. Since the latest review, we have continued to comply with the Code of Practice for Statistics, and have made the following improvements:
- a data downloader and an application programme interface (API) have been made available with the 2019 edition of the publication
- alterations to processing of ONS Labour Force Survey (2013 and 2016) and HMRC self-assessment tax returns (2016) data have improved data quality
- reduction in numbers of people with pre-release access to the publication
- changes have been made to format and layout of the statistical release in 2019 to make it more accessible and consistent with format of similar publications
- in 2019 detailed tables are published in OpenDocument spreadsheet format as well as excel format – for accessibility purposes
Pre-release access to statistics
Some ministers and officials receive access to these statistics up to 24 hours before release. Details of the arrangements for doing this and a list of the ministers and officials that receive pre-release access to these statistics can be found in the BEIS statement of compliance with the Pre-Release Access to Official Statistics Order 2008.
Contact
- Responsible statistician: Darren Barton
- Email: business.statistics@beis.gov.uk
- Media enquiries: 020 7215 1000
- Public enquiries: 020 7215 5297