UK House Price Index summary: April 2017
Published 13 June 2017

© Crown copyright 2017
This publication is licensed under the terms of the Open Government Licence v3.0 except where otherwise stated. To view this licence, visit nationalarchives.gov.uk/doc/open-government-licence/version/3 or write to the Information Policy Team, The National Archives, Kew, London TW9 4DU, or email: psi@nationalarchives.gov.uk.
Where we have identified any third party copyright information you will need to obtain permission from the copyright holders concerned.
This publication is available at https://www.gov.uk/government/statistics/uk-house-price-index-summary-april-2017/uk-house-price-index-summary-april-2017
1. Headline statistics for April 2017
the average price of a property in the UK was
£220,094
the annual price change for a property in the UK was
5.6%
the monthly price change for a property in the UK was
1.6%
the monthly index figure (January 2015 = 100) for the UK was
115.4
Estimates for the most recent months are provisional and are likely to be updated as more data is incorporated into the index. Read the revision policies.
2. Economic statement
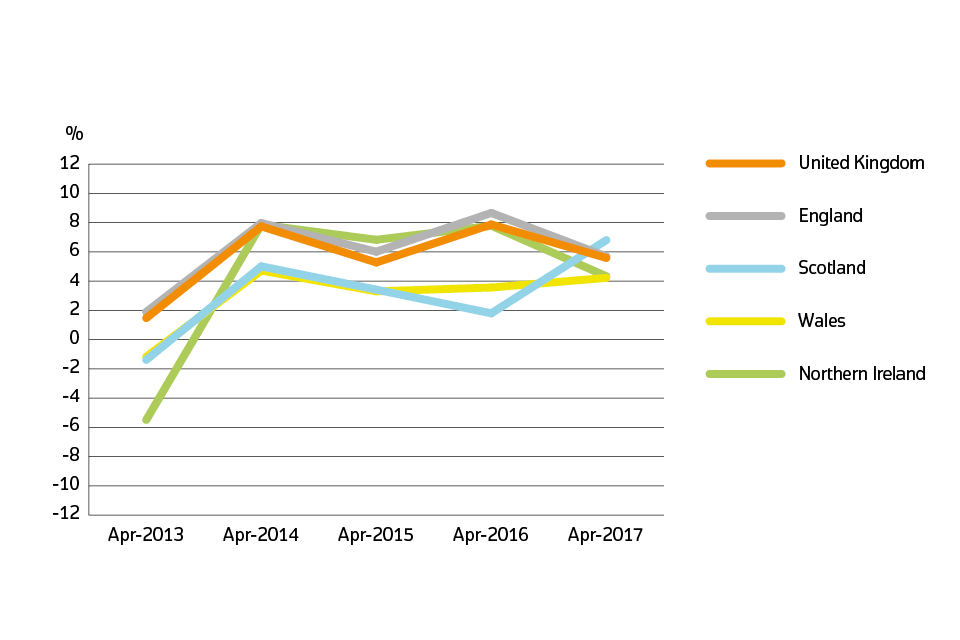
UK House prices grew by 5.6% in the year to April 2017, 1.1 percentage points higher than in the year to March 2017.
In terms of housing demand, the Royal Institution for Chartered Surveyors’ (RICS) residential market survey for April 2017 reported that price expectations are moderately positive while new buyer enquiries remain low.
The UK Property Transaction statistics showed that in April 2017 the total number of seasonally adjusted property transactions completed in the UK with value of £40,000 or above increased by 20.3% compared to April 2016. The unusually low level of transactions in April 2016 was associated with the introduction of the higher tax rates on additional properties introduced in this month. Comparing April 2017 to March 2017, property transactions fell by 3.2%.
Looking closer at the regional level of the UK, the largest house price growth was in the East of England (8.1%) while the lowest house price growth was in the North East (0.6%) in the 12 months to April 2017. House prices grew by 4.7% in London in the 12 months to April 2017, 1.5 percentage points higher than in the year to March 2017. This is the first time in 11 months that the rate of price growth in London has increased. This is consistent with RICS who have reported negative price expectations in London for the 13 consecutive months to April 2017.
According to the Bank of England Agent’s summary of business conditions May update, housing market activity was subdued on both the demand and supply side.
On the supply side RICS reported that new sales instructions remained negative for the fourteenth month in a row. They also report that average estate agent stock levels remain close to record lows. Further, RICS report “an acute shortage of stock remains a key factor underpinning prices for the time being”.
3. Price changes
3.1 Annual price change
Annual price change for UK by country over the past five years
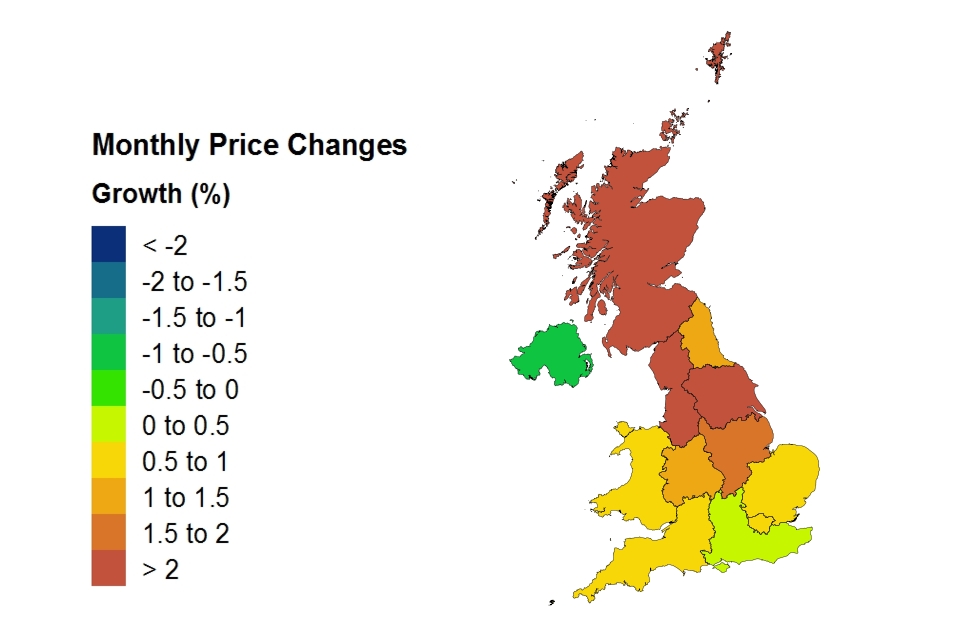
3.2 Average price by country and government office region
Price, monthly change and annual change by country and government office region
| Country and government office region | Price | Monthly change | Annual change |
|---|---|---|---|
| England | £236,519 | 1.3% | 5.7% |
| Northern Ireland (Quarter 1 - 2017) | £124,007 | -0.8% | 4.3% |
| Scotland | £145,735 | 5.4% | 6.8% |
| Wales | £147,921 | 0.9% | 4.2% |
| East Midlands | £178,844 | 1.6% | 6.5% |
| East of England | £280,690 | 0.6% | 8.1% |
| London | £482,779 | 0.7% | 4.7% |
| North East | £123,234 | 1.0% | 0.6% |
| North West | £152,765 | 2.1% | 4.1% |
| South East | £315,334 | 0.3% | 5.9% |
| South West | £243,215 | 0.7% | 6.8% |
| West Midlands Region | £183,250 | 1.3% | 6.0% |
| Yorkshire and The Humber | £155,357 | 3.9% | 4.9% |
Price changes by country and government office region
3.3 Average price by property type
Average monthly price by property type
| Property type | April 2017 | April 2016 | Difference |
|---|---|---|---|
| Detached | £332,839 | £311,664 | 6.8% |
| Semi-detached | £206,873 | £195,838 | 5.6% |
| Terraced | £177,379 | £170,071 | 4.3% |
| Flat or maisonette | £199,075 | £187,786 | 6.0% |
| All | £220,094 | £208,443 | 5.6% |
4. Sales volumes
Due to a period of 2 to 8 weeks between completion and registration of sales, volume figures for the most recent two months are not yet complete, so they are not included in the report.
4.1 Sales volumes: February 2017
Number of sales by country
| Country | February 2017 | February 2016 | Difference |
|---|---|---|---|
| England | 52,883 | 64,679 | -18.2% |
| Northern Ireland (Quarter 1 - 2017) | 4,379 | 6,127 | -28.5% |
| Scotland | 5,662 | 5,507 | 2.8% |
| Wales | 2,908 | 3,188 | -8.8% |
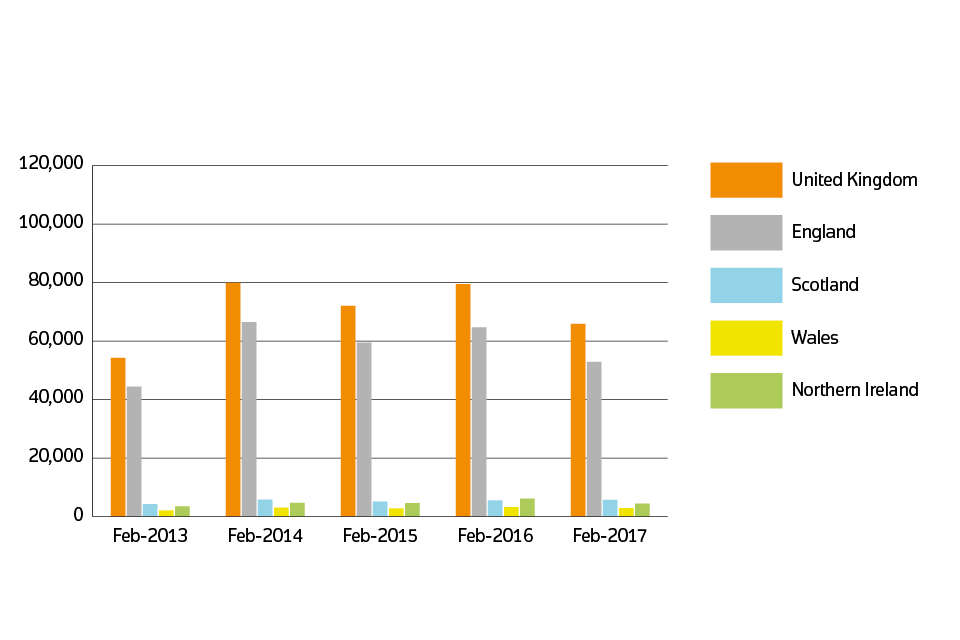
4.2 Sales volumes for the UK over the past 5 years
Sales volumes for 2013 to 2017 by country: February 2017
5. Property status for UK
New build and existing resold property
The first estimate for new build is based on a small sample which can cause volatility in this initial estimate.
| Property Status | Average price | Monthly change | Annual change |
|---|---|---|---|
| New build | £287,577 | 0.6% | 12.5% |
| Existing resold property | £215,732 | 1.7% | 5.1% |
6. Buyer status for Great Britain
First time buyer and former owner occupier
For Great Britain only, Northern Ireland data is not available for buyer status.
| Type of buyer | Average price | Monthly change | Annual change |
|---|---|---|---|
| First time buyer | £185,266 | 1.4% | 5.0% |
| Former owner occupier | £256,128 | 1.9% | 6.4% |
7. Funding status for Great Britain
Cash and mortgage
For Great Britain only, Northern Ireland data is not available for funding status.
| Funding status | Average price | Monthly change | Annual change |
|---|---|---|---|
| Cash | £208,985 | 1.1% | 5.5% |
| Mortgage | £230,188 | 1.9% | 5.9% |
8. Access the data
Download the data as CSV files or access it with our UK HPI tool.
Data revisions
View any revisions to previously published data in the data downloads or find out more about revisions in our guidance About the UK HPI.
9. About the UK House Price Index
The UK House Price Index (UK HPI) is calculated by the Office for National Statistics and Land & Property Services Northern Ireland. Find out about the methodology used to create the UK HPI.
Data for the UK House Price Index is provided by HM Land Registry, Registers of Scotland, The Land & Property Services/Northern Ireland Statistics & Research Agency and the Valuation Office Agency.
Find out more about the UK House Price Index.
10. Contact
Eileen Morrison, Data Services Team Leader, HM Land Registry
Email eileen.morrison@landregistry.gov.uk
Telephone 0300 006 5288
Aimee North, Head of Housing Market Indices, Office for National Statistics
Email aimee.north@ons.gov.uk
Telephone 01633 456400
Ciara Cunningham, Statistician for the Northern Ireland HPI
Email ciara.cunningham@finance-ni.gov.uk
Telephone 028 90 336035
Anne MacDonald, Land & Property Data Team, Registers of Scotland
Email Anne.MacDonald@ros.gov.uk
Telephone 0131 378 4991