Open data: visualising your neighbourhood with Illustreets
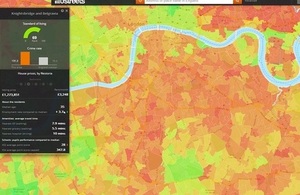
The free Illustreets web app uses open data to build a dynamic, colourful visualisation of any neighbourhood in England.

Illustreets uses open data to visualise information about a particular neighbourhood. Credit: Illustreets
A web app launched in September 2013 allows users to see detailed information about a particular area of England, including average property prices and rents, schools, public transport, census data and crime rates.
The web app is particularly useful for users who want to buy or rent a home. They can search using any address, postcode or place name in England.
It is based almost entirely on open data and sources include Ordnance Survey, the Department for Education, Ofsted, Office for National Statistics, Police.uk and the Environment Agency.
Manuel Timita, who co-developed the app, said:
We aim to take as much as possible of the UK open data available out there, put it in a format which the users will find easy to use and explore, and, more importantly, give it a context so that it is actually useful to a specific category of users (in our case home buyers and renters)…
We found a lot of useful guidance and links to various datasets on data.gov.uk, which is a brilliant initiative.
The app had more than 6,000 visitors in the first month after it was launched, and the developers are hoping to add more features in the future.
Get involved
If you’d like to see more great apps using open data or find out more about how they are made, visit www.data.gov.uk or tell us which of our unpublished datasets could bring economic or social benefits.
Use the search function to find data that’s important to you and click on the dataset to add your feedback.