250,000 fewer pupils in underperforming secondary schools
Number of pupils taught in underperforming secondary schools falls by almost 250,000 in 4 years.

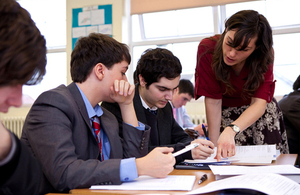
Teacher working with pupils
Performance tables published today show that the government’s education reforms are raising standards in secondary schools - with hundreds more schools meeting tougher targets.
This year, schools are below the floor if fewer than 40% of their pupils achieve 5 or more GCSEs, including English and maths, at C or better, and are behind on progress measures. The government raised the floor from 35% for last year’s performance tables.
The statistics show that 154 secondary schools are below the floor this year. That is down from the 195 schools below the floor last year. And had the same high standards been in place in 2010, 407 secondary schools would have been below the floor.
This improvement has meant the number of pupils being taught in underperforming secondary schools has fallen by 50,000 since last year and by 244,000 since 2010.
Figures based on the old floor standard show a similar picture. In 2010, 216 schools teaching 179,000 pupils fell below the 35% floor standard. If that floor was in place now, this year only 65 schools teaching 41,000 pupils would have fallen below it - a fall of 138,000 since 2010.
This improvement has been achieved against a backdrop of an increasing number of pupils taking a combination of academically rigorous subjects - the English Baccalaureate (EBacc).
Pupils achieve the EBacc if they get a C or better in the core subjects of English, maths, history or geography, the sciences, and a language. These are the subjects most valued by universities and employers. This is the first year that the effects of the EBacc are fully reflected in the tables.
The statistics show that:
- 72,000 more pupils took the EBacc than in 2012. In total, 202,000 pupils entered the EBacc (35% of the total), up from 130,000 (23%) in 2012
- in 735 schools, at least half of the pupils took the EBacc - more than double the 334 schools where that was the case in 2012
- no pupil entered the EBacc in just 37 secondary schools - down from 120 in 2012
- 23% of pupils in state-funded schools achieved the EBacc this year, up from 16% last year
Schools below the floor and with a history of underperformance face being taken over by a sponsor with a track record of improving weak schools.
The figures also show how results in sponsored academies, which have replaced previously underperforming schools, continue to improve. In sponsored academies, the proportion of pupils who achieved at least 5 good GCSEs (including in English and maths) rose by 2.3 percentage points, compared to 1.8 percentage points across local authority schools.
The results for sponsored academies also demonstrate how they are increasingly entering pupils for the key academic subjects of the EBacc.
The proportion of pupils in sponsored academies taking the EBacc has doubled since last year to 22%. Across all local authority mainstream schools, 34% of pupils entered the EBacc, up 13 percentage points.
Education Secretary Michael Gove said:
These figures are a credit to the professionalism and hard work of teachers.
Thanks to their efforts, the number of children taught in underperforming schools has fallen by almost 250,000 since 2010.
This progress has been achieved at the same time as our EBacc has ensured many more young people are taking the core subjects which will most help them find a good job or go on to university.
He added:
The results are also further evidence of the great success of the academy programme. Brilliant sponsors across the country are arresting decline in underperforming schools and then reversing it. As a result, more young people are leaving school with the qualifications they need to succeed in future.
Table 1
| Year exams were taken | Schools below the floor under the current standard of 40% | Number of children taught in those schools | Schools below the floor under the 2010 standard of 35% | Number of children taught in those schools |
|---|---|---|---|---|
| 2010 | 407 | 362,000 | 216 | 179,000 |
| 2011 | 251 | 216,000 | 107 | 86,000 |
| 2012 | 195 | 168,000 | 83 | 62,000 |
| 2013 | 154 | 117,000 | 65 | 41,000 |
Table 2
| Year exams were taken | Number of schools where no pupils entered the EBacc | Number of schools where no pupils achieved the EBacc | Number of schools where fewer than 10% of pupils entered the EBacc | Number of schools where fewer than 10% of pupils achieved the EBacc | Number of schools where more than 50% of pupils entered the EBacc | Number of schools where more than 50% of pupils achieved the EBacc |
|---|---|---|---|---|---|---|
| 2010 | 187 | 269 | 1,058 | 1,504 | 325 | 163 |
| 2011 | 164 | 234 | 1,062 | 1,466 | 323 | 168 |
| 2012 | 120 | 175 | 902 | 1,363 | 334 | 174 |
| 2013 | 37 | 72 | 327 | 723 | 735 | 237 |
DfE media enquiries
Central newsdesk - for journalists 020 7783 8300