Guide to AS and A level results for England, 2019
Ofqual's guide to results, standards and grade boundaries in the 2019 AS and A level results in England.
Key points
- The biggest reforms to general qualifications in a generation are almost complete with the majority of today’s results awarded for reformed A levels.
- Reformed A levels were awarded for the first time in 19 more subjects this summer (not counting A level maths), bringing the total number of reformed subjects to 44. The new A levels are linear qualifications, with refreshed content, but overall A levels have not been designed to be more demanding. Our focus has been to ensure that standards have been maintained for all qualifications awarded this summer.
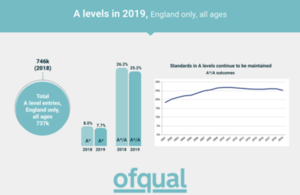
- Overall results in England are slightly lower at grade A and above compared to last year (25.2% in 2019 compared with 26.2% in 2018). This is likely to reflect changes in the A level cohort and students’ subject choices. While the number of 18-year-olds taking A levels in England has decreased by around 0.3% this year, the overall 18-year-old cohort has decreased by just under 3%. This suggests that proportionally more 18-year-olds are taking A levels this year.
- Entries for reformed AS qualifications in England have dropped by over 50% compared to last summer. This makes it much more difficult to interpret any changes in year-on-year results.
- The variability in results within centres is generally similar to previous years. Even when there are no changes to qualifications, individual schools and colleges will see variation in their year-on-year results; this is normal.
Today (15 August 2019) we are publishing:
- a summary of this year’s results (below)
- an infographic about this year’s A level results
- a report on variability in school and college A level results, 2017 to 2019
- interactive analytics of variability in school and college A level results, A level outcomes in England and an interactive map of England showing A level results in different subjects by grade and county
You may also find it useful to read about how we regulate GCSEs, AS and A levels in England.
An historical perspective…
The exam boards use the principle of comparable outcomes when awarding, as a way of ensuring that standards are maintained.
The principle of comparable outcomes is not new. It has always been used by exam boards, particularly when qualifications change. It’s a principle that exam boards have followed for decades: that if the ability of the cohort of students is similar to previous years, they would expect results (outcomes) to be similar. This means that, in general, students who would have achieved a grade A in one year would achieve a grade A in another year.
Comparable outcomes is operationalised through a combination of statistical predictions and examiner judgement. Predictions give us a way to maintain standards and a mechanism to make sure exam boards’ standards are aligned, so that it is no easier to get a grade with one board than another. Predictions are not used in isolation though. Senior examiners review the work of students at the key grade boundaries to make sure it is appropriate for the grade. Where they judge that it is not, they can move the boundary to a mark where they are satisfied that the standard of work is appropriate. And, in smaller entry subjects, where the statistics are likely to be less reliable, exam boards rely more on examiner judgement.
Since 2010 we have required exam boards to report their results to us against predictions and to provide a rationale where they are not in line. Results in recent years have been relatively stable year-on-year (see infographic).
Setting standards in AS and A levels in 2019
As in previous years, the approach outlined above has been used for all AS and A levels in 2019 – reformed and unreformed. It is particularly important at times of change, as it protects students from being disadvantaged because they are the first to sit new qualifications, when teachers do not have access to the same bank of resources and past papers. We have been clear since before students embarked on these new courses that the exam boards would use predictions to carry forward the standards to these new AS and A levels.
In the 2019 AS and A level awards, exam boards used predictions based on the students’ prior attainment at GCSE. And, as in previous years, senior examiners have reviewed students’ work in all awards. In some awards, the senior examiners recommended grade boundaries that deviated from those suggested by the statistical evidence. We have not intervened to ask any boards to change their grade boundaries for any of their awards this summer.
Reformed A level subjects in 2019
This summer, reformed A levels were awarded for the first time in 19 more subjects (not counting A level maths). This means that nearly all subjects are now reformed (there are a small number of language qualifications that will be first awarded in 2020).
The content of the new A levels has been refreshed and updated, with greater input from universities, and the assessment requirements have changed in some subjects (to reflect the content and associated changes in the proportion of non-exam assessment). The new A levels are linear qualifications, but overall A levels have not been designed to be more demanding.
We have been clear that exam boards would maintain standards from the legacy versions of the qualifications, so that, in general, students who would have achieved a grade A in previous years would achieve a grade A this year.
A level maths
In England, reformed A level maths was awarded to a full cohort of students for the first time this year. The outcomes in this qualification for students in England this year and last year are shown below.
Cumulative percentage outcomes in England for A level maths in 2018 and 2019
| A* | A | B | C | D | E | U | |
|---|---|---|---|---|---|---|---|
| 2019 | 16.3 | 40.5 | 58.4 | 75.1 | 88.6 | 96.8 | 100.0 |
| 2018 | 15.9 | 42.1 | 64.5 | 80.5 | 90.8 | 96.3 | 100.0 |
At a national level, there is a small reduction in overall achievement at grade A and above and a small increase in achievement at grades A* and E and above. This reflects changes in the aptitude of the cohort taking these qualifications.
Achievement at grades B, C and D has changed by a greater amount. These changes are likely to be a reflection of the small shifts in the aptitude of the cohort taking the qualification and significant changes to the structure of the qualification. In the legacy qualification students could re-sit units as many times as they wished and could complete more units than the minimum required in order to optimise their grades. This was an anomalous feature of the design of the previous qualification and is not a feature of the new linear qualifications.
We made UCAS aware of these outcomes, who passed details to higher education providers to help admissions officers understand the overall picture for A level maths results.
Reformed A level maths results in 2018
As part of our regular approach to maintaining standards, we monitor the setting of grade boundaries for every A level. We identified significant shifts in exam boards’ grade boundaries in reformed A level maths between 2018 and 2019. While some fluctuation in boundaries is not uncommon, we considered these particular changes to be more unusual.
Uniquely we decided that students should have the opportunity to take the new maths A level in 2018 after one year of teaching so, as usual, the brightest mathematicians could enter in year 12. We knew that this would make awarding in 2018 challenging, given the significant changes between the legacy and reformed specifications and the likely size and nature of the 2018 entry.
Our view is that the 2019 awards are sound. The much larger 2019 cohort (85,000) means we can be confident in the statistical predictions used to guide the awards. Exam boards’ senior examiners also had plenty of evidence of student performance across the range.
In contrast, fewer than 2,000 students took the qualification in 2018, mainly very able 17-year-olds many of whom went on to take further maths in 2019. Many of the students achieved the highest grades and the exam boards had little evidence of student performance at the lowest grades.
While the 2018 grade boundaries seemed appropriate at the time, given the difference between the 2018 and 2019 grade boundaries we asked the exam boards to look again at last year’s awards before publishing this year’s results. None of the exam boards believed there was compelling evidence to re-open its 2018 award.
We want to understand why the grade boundaries were so different between the two years. We will investigate the full range of evidence from 2018 and 2019 that is now available. We will consider each exam board’s decision not to re-open the 2018 awards, taking into account the relative demand of their 2018 and 2019 papers and students’ performance in each year.
We will publish our findings and any action each exam board should take in response at the earliest opportunity.
None of this has any bearing on this year’s grade boundaries, in which we are confident.
A level MFL and sciences
Following our work on inter-subject comparability for A level MFL (French, German and Spanish) and the sciences (biology, chemistry and physics), we committed to working with exam boards to ensure that these subjects did not become statistically more severely graded in the future. Exam boards were expected to ensure that their awards this summer were above the statistical predictions at grades A* and A. All exam boards adhered to this expectation.
The JCQ results data published today show that outcomes in these subjects at grades A* and A in England are up in some subjects and down in others (when considering outcomes for all students). This does not mean that these subjects have become more difficult, though. Rather, the changes in results are likely to reflect changes in the aptitude of the students taking these qualifications.
Number of A level qualifications per student
JCQ published data presents the numbers of entries and certifications, rather than data at student level. This is because students typically take AS and A levels with more than one exam board. It is also worth noting that many students also take AS or A levels alongside other qualifications, which we have not included in this analysis. We have combined the exam board data to look at the average number of A levels per student for 18-year-olds in England taking at least one A level each year (students generally complete their A levels aged 18). This is shown in the table below. For A level, the average number has remained stable since 2016.
Average number of A level qualifications per student (18-year-olds in England)
| 2016 | 2017 | 2018 | 2019 | |
|---|---|---|---|---|
| A level | 2.68 | 2.67 | 2.68 | 2.66 |
We have also considered the number of A levels that each individual student takes. The table below shows the percentage of students that took 1 A level, 2 A levels and so on. In recent years, there has been a trend towards a higher percentage of 18-year-old A level students taking 3 A levels and a lower percentage taking 4 and 5 or more A levels.
Percentage of students by the number of A levels taken per student (18-year-olds in England)
| A levels | 2016 | 2017 | 2018 | 2019 |
|---|---|---|---|---|
| 1 | 12.1% | 11.3% | 10.5% | 10.6% |
| 2 | 16.2% | 16.8% | 16.8% | 17.0% |
| 3 | 63.6% | 65.4% | 66.9% | 68.0% |
| 4 | 7.6% | 6.2% | 5.6% | 4.3% |
| 5+ | 0.4% | 0.3% | 0.2% | 0.1% |
Grade boundaries
It is difficult to compare in a meaningful way grade boundaries between reformed and legacy qualifications, for several reasons. Maximum marks for the papers differ, the number of papers in a subject differs, and the type of assessment can be different. It is particularly difficult to compare reformed grade boundaries with the legacy qualifications where there was a significant amount of non-exam assessment, or where the proportion of non-exam assessment has changed, since the grade boundaries on written papers may have been higher to compensate for high performance on the coursework. We have therefore only compared grade boundaries with last summer for A level subjects that are in phase 1 or 2 of reform, since for these qualifications we are able to compare like-with-like.
The following table shows a summary of the average change in qualification level grade boundaries for 2019 compared to 2018. For specifications where there are optional routes (eg history, religious studies) we have averaged across options before combining the data across subjects.
Although exam papers are intended to be of the same demand as previous years, in practice, this is very difficult to achieve precisely, so grade boundaries change to take account of the demand of the papers. On average, the grade boundaries at qualification level are slightly higher than last summer by just under 3 raw marks at grade A and by just under 1 raw mark at grade E. This is what we would expect from our sawtooth research. This research suggests that there is generally a small dip in performance when new qualifications are available for the first time, following which performance gradually improves. The comparable outcomes approach aims to ensure that students taking reformed A levels in the first years are not disadvantaged by the changes to the qualifications.
Changes in qualification level raw mark grade boundaries for phase 1 and 2 reformed A levels
| Average change (2019 – 2018) | |
|---|---|
| Grade A | +2.83 |
| Grade E | +0.82 |
Reformed AS qualifications
This summer is the fourth year that reformed AS qualifications have been awarded. These are standalone qualifications in England that no longer count towards the A level. Students therefore do not have to take the AS qualification if they are intending to certificate at A level.
AS entries for reformed qualifications have declined sharply this summer, and are down from just over 1.1 million in 2016 to 114,000 this year. This means that entries to some AS subjects are now relatively small. Due to the decline in entries, we have not published centre variability graphs for AS qualifications since 2017, since many subjects do not have sufficient entries to make valid comparisons. Where the cohorts are small and changing year on year, the outcomes may inevitably be more variable.
Instead, we have analysed the number of 17-year-old students taking at least one AS qualification in 2019 compared to previous years. This is shown in the table below. The number of students taking at least one AS qualification has declined significantly since 2017, following a smaller decline between 2016 and 2017.
Number of students taking at least one AS qualification (17-year-olds in England)
| 2016 | 2017 | 2018 | 2019 | |
|---|---|---|---|---|
| AS | 270,500 | 209,540 | 64,810 | 40,880 |