UK House Price Index (UK HPI) annual review 2017
A review of the UK House Price Index statistics for 2017 for England, Scotland, Wales and Northern Ireland.

Slowdown in house price growth in 2017
House prices measured by the UK House Price Index grew more slowly in 2017 compared with 2016. The UK annual growth rate for the year as a whole was 4.8% – compared with a 7% increase in 2016. On a calendar year basis, that is the lowest rise since 2013. While house price growth slowed in 2017, transaction volumes (PDF, 829KB) for house purchases remained flat.
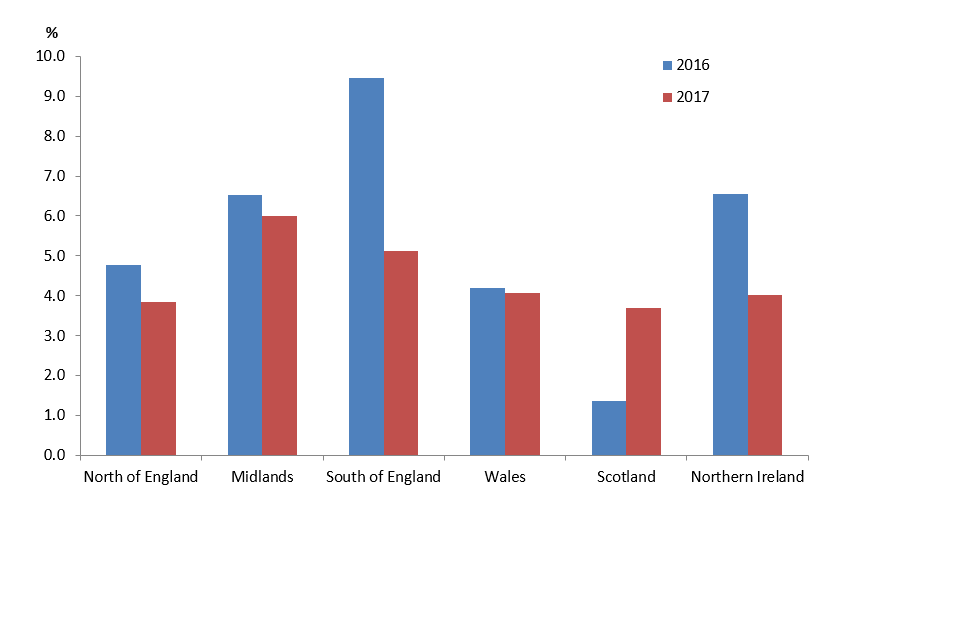
The slowdown at the national level does hide a wide variation in growth rates between regions and countries. Figure 1 below compares the annual growth rate for selected regions and countries for 2016 and 2017. For some the change between 2016 and 2017 is relatively small; by comparison, the annual growth in the south of England has nearly halved from 9.5% in 2016 to 5.1% in 2017.
Figure 1: Annual house price rates of change, countries and regions, 2016 and 2017

Note: North of England consists of North East, North West and Yorkshire and The Humber; Midlands consists of East Midlands and West Midlands; South of England consists of East of England, London, South East and South West.
While the southern regions of England may have started to experience slower house price growth during 2017, there remains a large difference in terms of average house price levels across different regions. The average house price in the North East in December 2017 was £131,000 compared with £484,000 in London.
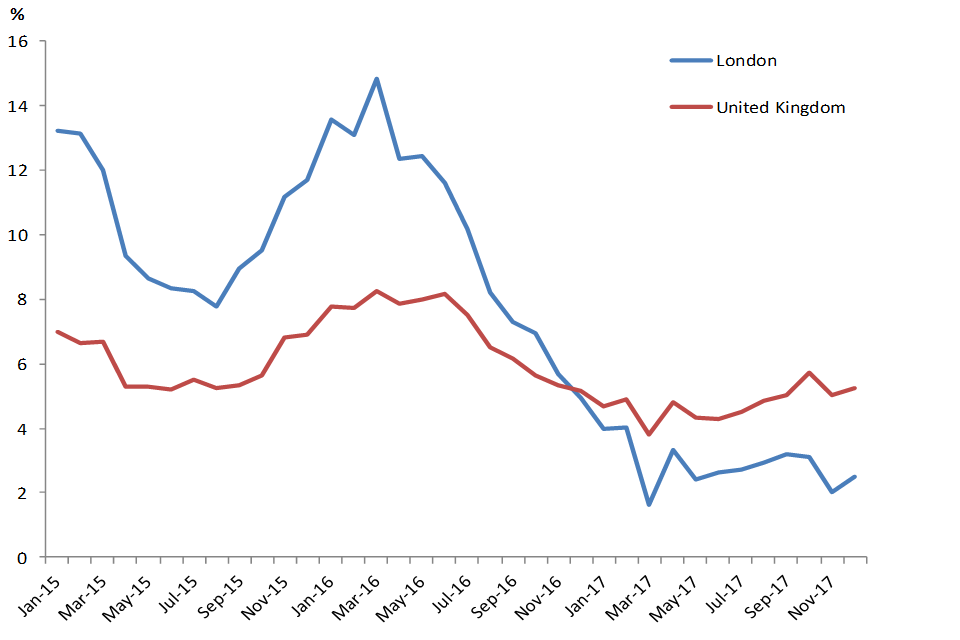
The slowdown in the south of England is most evident in London. Historically, house price growth in London has consistently been above that of the UK. However, since March 2016 there has been a sharp slowdown in the London house price annual growth rate which has continued to slow through 2017. As seen in Figure 2, for the whole of 2017 the UK house price annual growth rate has exceeded that of London. While London house prices are now increasing at a much slower rate than seen historically it still remains by far the most expensive region of the UK. The average London house price in December 2017 was £484,000, more than double that of the UK average house price of £227,000.
Figure 2: Annual house price rates of change, UK and London, January 2015 to December 2017

Finally, the local area showing the largest annual growth in 2017 was Tendring, a district in north-east Essex where prices increased by 11.8%. This increase may be due to buyers relocating to the coast following the sale of more expensive properties elsewhere.
The lowest annual growth was recorded in the City of Aberdeen, where prices fell by 6.1%, which could be due to the impact of falling oil prices on the local economy.
Biggest rise of UK local authorities, by annual growth in 2017
| Local authority | % change | Average price (£) |
|---|---|---|
| Tendring | 11.8 | 212,000 |
| Corby | 10.7 | 171,000 |
| East Northamptonshire | 10.2 | 222,000 |
| Hinckley and Bosworth | 10.1 | 204,000 |
| Salford | 10.1 | 152,000 |
Biggest fall of UK local authorities, by annual growth in 2017
| Local authority | % change | Average price (£) |
|---|---|---|
| City of Aberdeen | -6.1 | 165,000 |
| Aberdeenshire | -1.7 | 192,000 |
| Hyndburn | -0.7 | 92,000 |
| City of London | -0.6 | 810,000 |
| Brent | -0.5 | 487,000 |
Removing our experimental status
The new UK HPI was launched in June 2016 initially as an experimental statistic to:
-
allow for users to get used to the format of the new HPI
-
evaluate user reaction to the new data
-
evolve the publication of data further to meet user requirements
-
further develop the data sources used in its production
In September 2016, users of the index were invited to complete a questionnaire to help evaluate different aspects of the report and associated data. We have used these responses to make improvements, the first of which was implemented in December 2016, with the final phase of this development implemented in January 2018.
With these changes now in place, we are removing our experimental statistic status from 13 February 2018. To read more about this please see About the UK HPI, 1.1 Official statistic.