Changes in the behaviour and health of 40 to 60 year olds between 1991 to 1993 and 2011 to 2013
Published 27 December 2016
1. Introduction
This report analyses how the behaviour and health of people aged between 40 and 60 has changed over the past 20 years. It has been produced to support the development of social marketing campaigns in Public Health England. All data is taken from the Health Survey for England (HSE)[footnote 1], an annual survey designed to measure health and health related behaviors in adults and children living in private households in England. The survey was started in 1991 and has been carried out annually ever since.
2. Methodology
A subset of health-related questions on obesity, smoking, drinking and general health conditions, which have remained unchanged over the lifetime of the HSE survey, were selected for analysis. Analyses are based on unweighted data since survey weights are not available for the 1991 to 1993 base period. However, since all analyses are shown by gender and for a defined age group of interest (40 to 60) this should not materially affect the findings.
3. Results
3.1 Obesity
Figures 1a and 1b below show the change in the distribution of body mass index (BMI) of 40 to 60 year olds between 1991 to 1993 and 2011 to 2013. There is a clear shift towards the obese and severely obese weight groups, particularly for men, over the last 20 years. The proportion of 40 to 60 year old men who are overweight or obese has increased from 66.7% in 1991 to 1993 to 76.8% in 2011 to 2013, and for females the figure has risen from 54.8% to 63.4%.
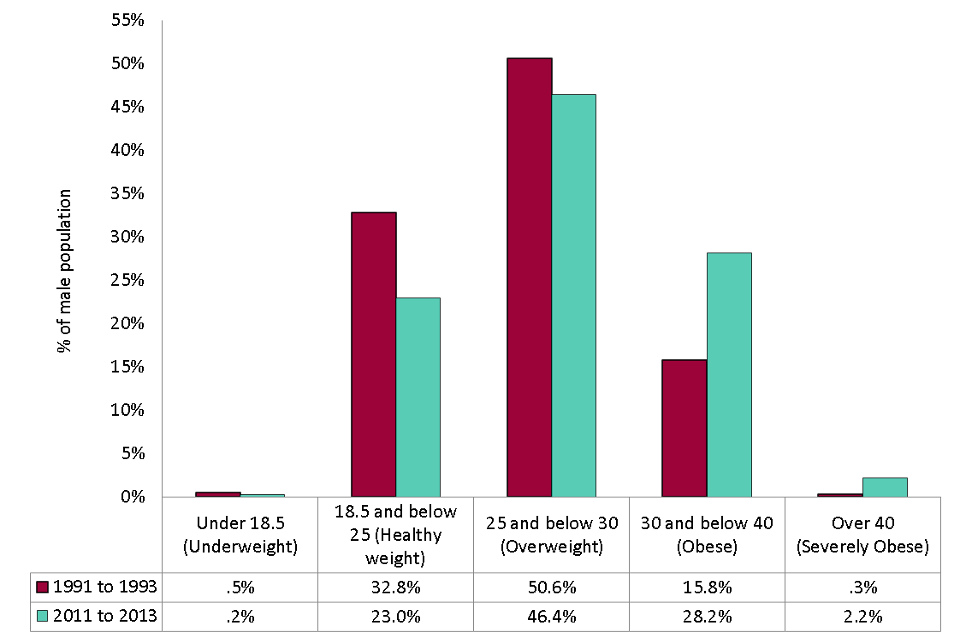
Chart showing the distribution of body mass index (BMI) for males aged 40 to 60 between 1991 to 1993 and 2011 to 2013
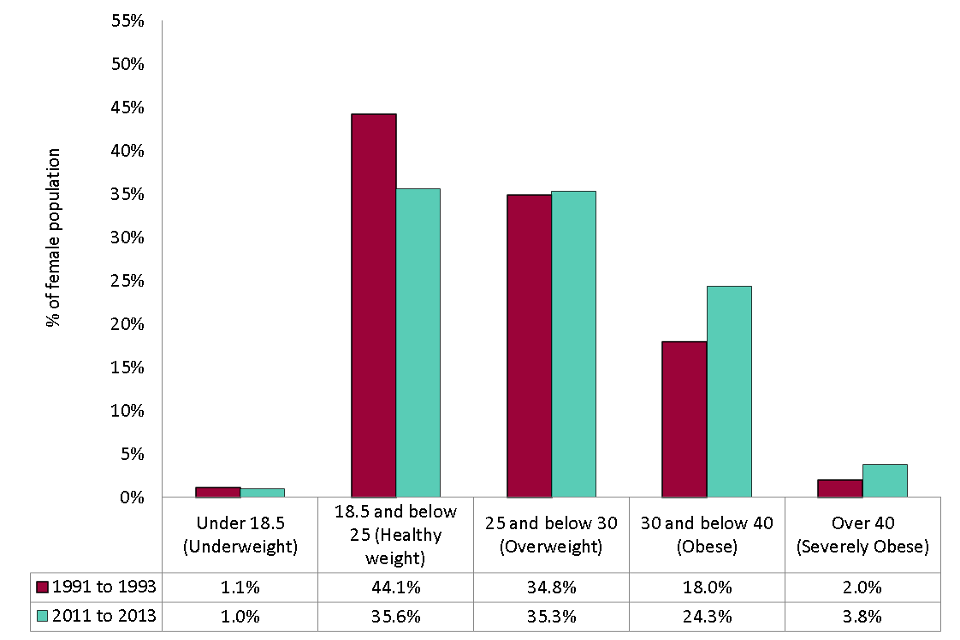
Chart showing the distribution of body mass index (BMI) for females aged 40 to 60 between 1991 to 1993 and 2011 to 2013
3.2 Alcohol consumption
Figures 2a and 2b below show how alcohol consumption has changed over the past 20 years. The classification is based on the number of units of alcohol consumed in a typical week and varies by gender as defined in this table:
Weekly units of alcohol consumed
| drinker risk group | men | women |
|---|---|---|
| lower risk | less than 21 | less than 14 |
| increasing risk | 21-50 | 14-35 |
| higher risk | 50 and over | 35 and over |
The HSE data shows that there has been an increase in the proportion of non-drinkers. For men aged 40 to 60 the proportion of abstainers has doubled from 5.3% in 1991 to 1993 to 11.1% in 2011 to 2013. For females the figure increased from 9.8% to 13.5%.
The proportion of 40 to 60 year old women in the increasing and higher risk categories has increased from 14% in 1991 to 1993 to 22% in 2011 to 2013. However the methodology for converting alcohol volume to units in government surveys was changed in 2007. The revised method[footnote 2] had a large impact on the estimates of units of alcohol consumed from wine because it changed both the assumed alcohol content of wine (from 9 to 12%) and the size of an average glass of wine.
Overall, the changes increased the estimated average weekly alcohol consumption for men by 26% and for women by 45% (because women drink proportionately more wine). Hence, it is difficult to reliably compare consumption levels before and after the change in methodology.
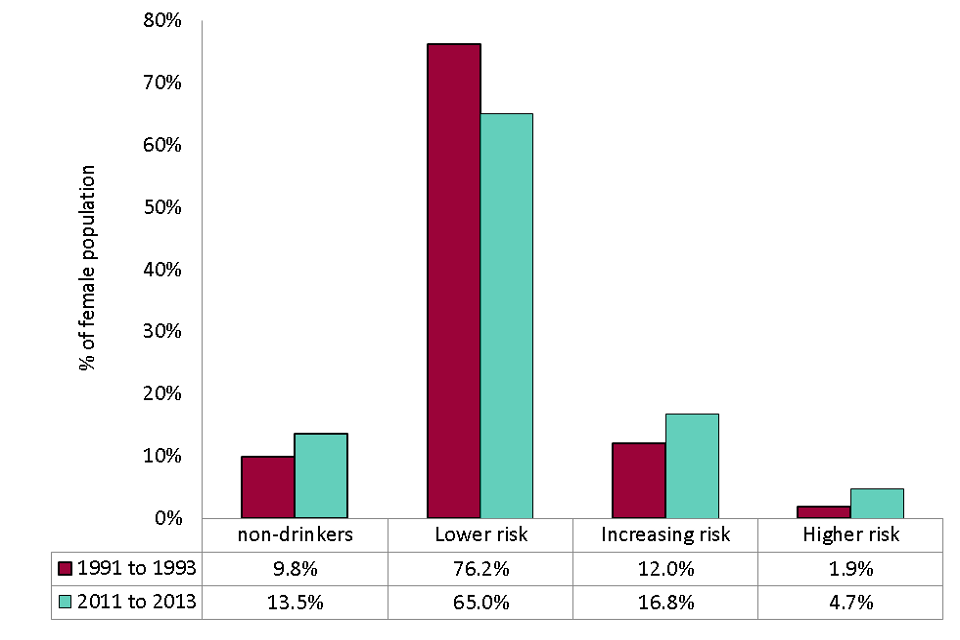
Chart showing the distribution of alcohol consumption risk group for females aged 40 to 60 between 1991 to 1993 and 2011 to 2013
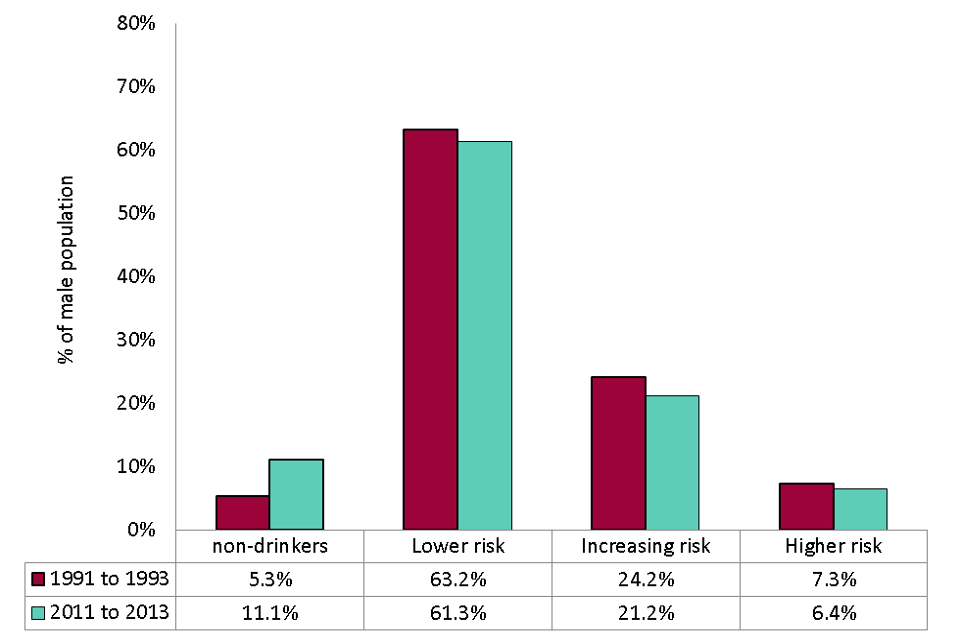
Chart showing the distribution of alcohol consumption risk group for males aged 40 to 60 between 1991 to 1993 and 2011 to 2013
3.3 Smoking
HSE data shows that there has been a statistically significant reduction in the proportion of smokers in both sexes over the last 20 years. The proportion of male smokers has reduced from 29% to 22% and female smokers have reduced from 29% to 20% in the 40 to 60 year old population.
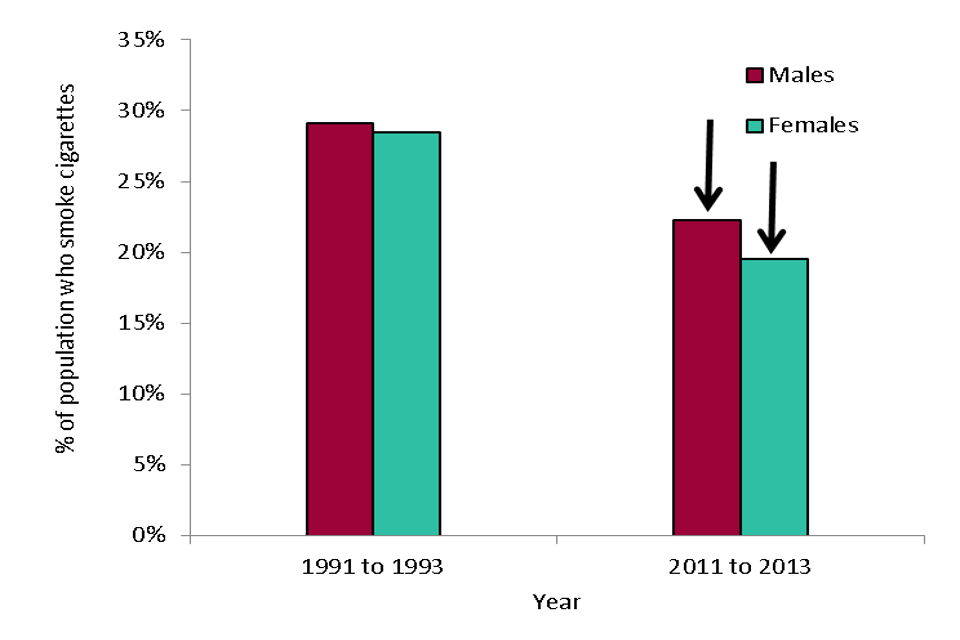
Chart showing the prevalence of male and female current smokers aged 40 to 60 in 1991 to 1993 and 2011 to 2013
3.4 Health conditions
The Health Survey for England asks respondents whether they have any long-standing illnesses (these are illnesses they have had for some time and expect to continue). Respondents can list up to six illnesses.
Figure 4a and figure 4b below show a comparison of common health conditions from the 1991 to 1993 surveys compared with 2011 to 2013. Statistically significant changes are annotated with an arrow.
This shows significant increases in:
- heart conditions for men (from 8.5% of the population in 1991 to 1993 to 11.4% in 2011 to 2013)
- diabetes for men and women where the prevalence has more than doubled over the period
- mental health conditions for men and women where the prevalence has trebled although this may, in part, reflect increased understanding and recognition of the condition over the past two decades
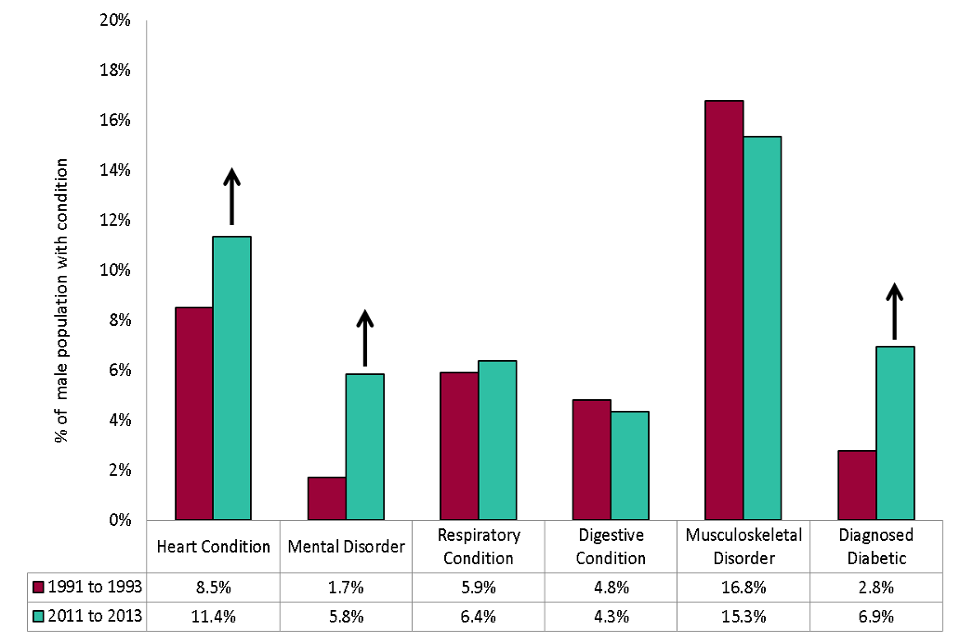
Chart showing the prevalence of medical conditions for males aged 40 to 60 in 1991 to 1993 and 2011 to 2013
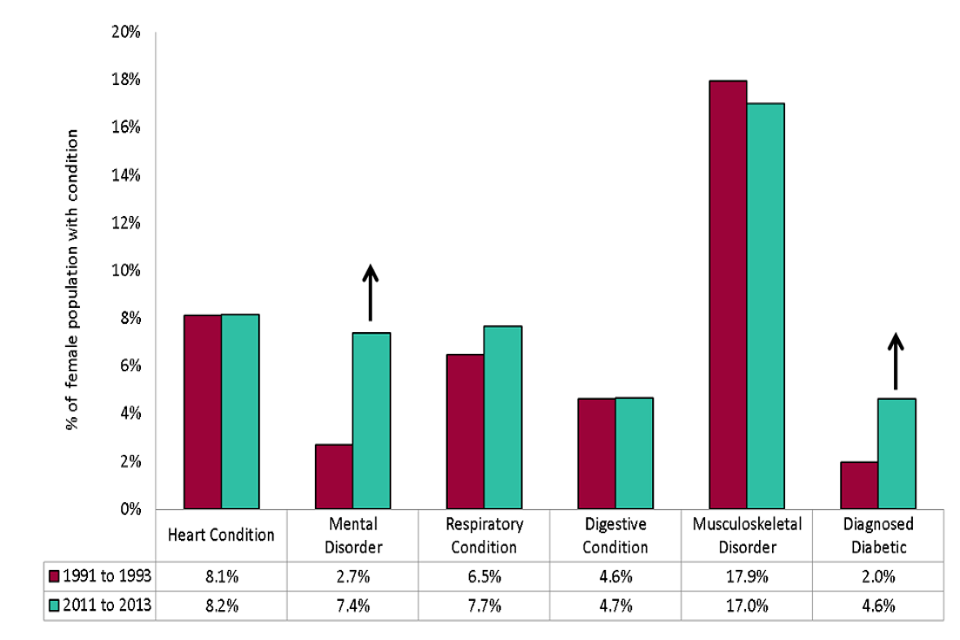
Chart showing the prevalence of medical conditions for females aged 40 to 60 in 1991 to 1993 and 2011 to 2013
4. Summary and discussion
The existence of a national health survey spanning over 20 years enables us to consider whether the current “middle-aged” generation is healthier or less healthy than the generation before them. These comparisons need to be made with care as changes in perceptions, understanding and definitions can distort the picture. However, from the analysis above we can conclude that in comparison to twenty years ago:
Men aged 40 to 60 are:
- more likely to be obese
- less likely to smoke and less likely to drink alcohol (although most do)
- more likely to suffer from a heart condition
- more likely to be diabetic
- more likely to report suffering from a mental health disorder
Women aged 40 to 60 are:
- more likely to be obese;
- less likely to smoke and less likely to drink alcohol
- more likely to be diabetic
- more likely to report suffering from a mental health disorder
-
Estimating alcohol consumption from survey data: updated method of converting volumes to units. National Statistics Methodological Series no. 37 (2007) ↩
