Civil Service People Survey 2023 - Results Highlights
Updated 29 August 2024

© Crown copyright 2024
This publication is licensed under the terms of the Open Government Licence v3.0 except where otherwise stated. To view this licence, visit nationalarchives.gov.uk/doc/open-government-licence/version/3 or write to the Information Policy Team, The National Archives, Kew, London TW9 4DU, or email: psi@nationalarchives.gov.uk.
Where we have identified any third party copyright information you will need to obtain permission from the copyright holders concerned.
This publication is available at https://www.gov.uk/government/publications/civil-service-people-survey-2023-results/civil-service-people-survey-2023-results-highlights
Overview of the Civil Service People Survey 2023 main findings
Contents
- Employee engagement and theme scores
- Discrimination, bullying and harassment
- Employee wellbeing
- Modernisation, reform, productivity and efficiency
- Future intentions
- Demographic background
- Annex: Background information
Summary of the results
65% of civil servants, across 103 organisations, participated in the 2023 Civil Service People Survey
This page is an overview of the headline findings of the 2023 Civil Service People Survey for the purpose of providing commentary to the results. It is composed of five sections: (i) employee engagement and theme scores; (ii) discrimination, bullying and harassment; (iii) employee wellbeing; (iv) modernisation, reform, productivity and efficiency; and (v) future intentions. The published spreadsheets show all core question scores. Further information about the survey is in the complementary Technical Guide, including the full list of participating organisations, development of the questionnaire over time and detail about how the indices are calculated.
356,715 civil servants from 103 organisations responded to the 2023 Civil Service People Survey, up from 347,957 in 2022. The overall response rate in 2023 was 65%, the same as in 2022.
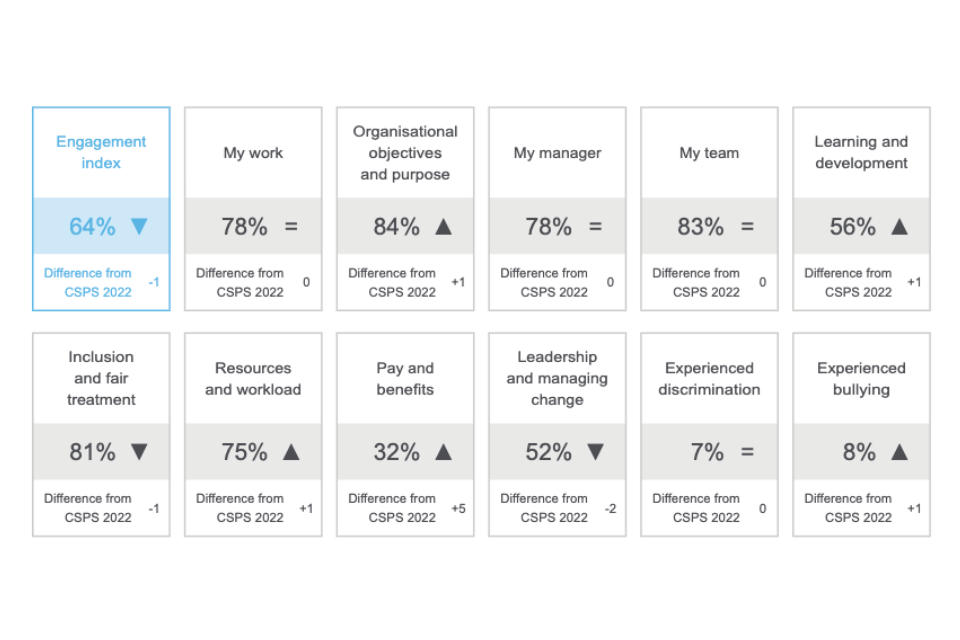
Figure 1: Summary of Civil Service People Survey 2023 Results (access Table 1)(ODS, 18KB)
Employee engagement and theme scores
The primary measure in the People Survey is the Employee Engagement Index. The index is a measure of how proud staff feel in working for their organisation, whether they would recommend their organisation as a great place to work, whether they feel a strong personal attachment to it, and whether they feel their organisation inspires and motivates them to do the best in their job and achieve their organisation’s objectives.
There are nine core theme scores within the People Survey, each of which measure a different element of employee experience at work.
The benchmark Engagement Index is 64%, 1 percentage point lower compared to 2022
Of the five questions that make up the engagement index, four of them decreased between 1 and 2 percentage points compared to 2022, with the exception of ‘I would recommend my organisation as a great place to work’ which did not change (details on how to calculate the index can be found in the explanatory notes below and in the technical guide). There is a mixed picture in relation to the nine themes that drive employee engagement.
Compared to 2022:
- ‘My Work’, ‘My Manager’, and ‘My Team’ did not vary;
- ‘Learning and Development’, ‘Resources and Workload’, and ‘Organisational Objectives and Purpose’ all increased by 1 percentage point, while ‘Pay and Benefits’ increased by 5 percentage points;
- ‘Inclusion and Fair Treatment’, and ‘Leadership and Managing Change’ decreased by 1 and 2 percentage points respectively.
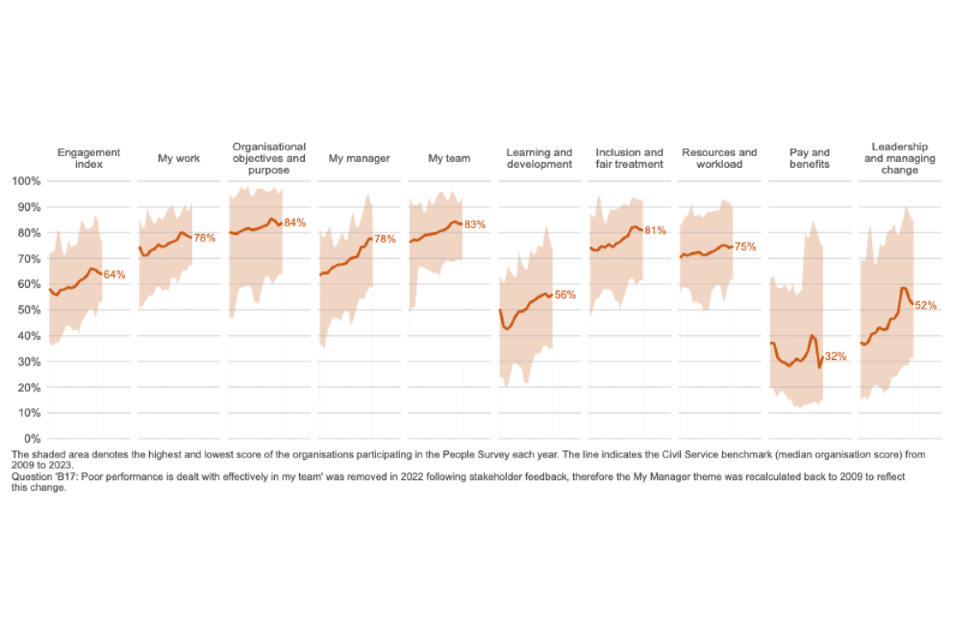
Figure 2: Civil Service People Survey benchmark scores 2009-2023 for Employee Engagement Index and main themes (access Table 2)(ODS, 18KB)
Engagement levels range from 56% to 70% across main departments
Across main departments, the Department for Culture, Media, and Sport (DCMS, 70%) has the highest engagement index while HM Revenue and Customs (HMRC) has the lowest (56%). Across the main themes, the Welsh Government (WG) has the highest scores for three of the nine engagement driver themes, while the Ministry of Defence (MoD) and the Ministry of Justice (MoJ) have the lowest score for three of the nine driver themes.
Note: Scores for MoJ and DfE include their respective agencies. Please refer to the Civil Service People Survey 2023 Benchmark results file for details.
| Category | CO | DBT | DCMS | DEFRA | DESNZ | DFE | DFT | DHSC | DLUHC | DSIT | DWP | FCDO | HMRC | HMT | HO | MOD | MOJ | SG | WG | NIO |
| Engagement index | 58% | 62% | 70% | 61% | 61% | 63% | 64% | 57% | 62% | 60% | 61% | 66% | 56% | 67% | 58% | 63% | 61% | 65% | 66% | 64% |
| My work | 77% | 77% | 82% | 77% | 78% | 79% | 78% | 77% | 79% | 77% | 74% | 80% | 71% | 79% | 73% | 78% | 74% | 80% | 83% | 80% |
| Organisational objectives and purpose | 69% | 79% | 82% | 77% | 77% | 80% | 80% | 70% | 78% | 71% | 86% | 82% | 83% | 82% | 81% | 81% | 82% | 82% | 85% | 84% |
| My manager | 75% | 77% | 79% | 77% | 77% | 80% | 80% | 77% | 81% | 76% | 77% | 75% | 78% | 79% | 76% | 72% | 73% | 80% | 80% | 78% |
| My team | 84% | 82% | 87% | 84% | 83% | 87% | 83% | 84% | 85% | 83% | 83% | 83% | 82% | 84% | 80% | 80% | 78% | 85% | 85% | 87% |
| Learning and development | 50% | 54% | 56% | 57% | 54% | 60% | 61% | 53% | 61% | 50% | 62% | 57% | 57% | 50% | 58% | 54% | 55% | 59% | 56% | 38% |
| Inclusion and fair treatment | 77% | 81% | 85% | 82% | 83% | 83% | 83% | 80% | 84% | 82% | 80% | 77% | 79% | 81% | 78% | 77% | 75% | 84% | 85% | 81% |
| Resources and workload | 72% | 73% | 75% | 71% | 72% | 76% | 77% | 72% | 76% | 70% | 76% | 74% | 74% | 74% | 73% | 70% | 70% | 75% | 79% | 73% |
| Pay and benefits | 32% | 24% | 24% | 21% | 22% | 38% | 28% | 31% | 26% | 24% | 33% | 28% | 31% | 20% | 35% | 30% | 28% | 56% | 52% | 36% |
| Leadership and managing change | 45% | 52% | 62% | 50% | 53% | 51% | 57% | 45% | 55% | 54% | 50% | 50% | 46% | 55% | 47% | 42% | 46% | 50% | 55% | 51% |
Note: The full names for the department codes used in this and other tables is at the bottom of this page in the Coverage section.
CO and FCDO achieved the biggest improvements across the theme scores
The Cabinet Office (CO) and the Foreign Commonwealth and Development Office (FCDO) have seen a significant increase in their engagement index compared to 2022 (+4pp in both cases). The Department of Health and Social Care (DHSC) and HMRC had a reduction in their engagement index of 3pp, followed by the Scottish Government (SG, 2pp) and HM Treasury (HMT) and MoD (1pp in both cases).
FCDO has the highest increase (+9pp) in the ‘Organisational Objectives and Purpose’ theme. The ‘Pay and Benefits’ theme increased by +12pp in the Home Office (HO), while the ‘Leadership and Managing Change’ theme increased by +7pp in the CO.
CO has the largest increase in the ‘My Work’ theme (+4pp), and shares with FCDO those for ‘Inclusion and Fair Treatment’ and ‘Resources and Workload’ (+3pp in both instances). The ‘Learning and Development’ theme saw the largest increase (+6pp) in the Department for Environment, Food and Rural Affairs (DEFRA) and Department for Levelling Up, Housing and Communities (DLUHC).
| Category | CO | DBT | DCMS | DEFRA | DESNZ | DFE | DFT | DHSC | DLUHC | DSIT | DWP | FCDO | HMRC | HMT | HO | MOD | MOJ | SG | WG | NIO |
| Engagement index | +4 | NA | 0 | +1 | NA | +2 | 0 | -3 | +2 | NA | 0 | +4 | -3 | -1 | +1 | -1 | 0 | -2 | +1 | +3 |
| My work | +4 | NA | +3 | +2 | NA | +2 | 0 | 0 | +3 | NA | +1 | +3 | -1 | +1 | 0 | -1 | +1 | -1 | +2 | 0 |
| Organisational objectives and purpose | +7 | NA | 0 | +3 | NA | +3 | -2 | +1 | +7 | NA | +1 | +9 | -1 | +3 | +2 | -1 | +1 | 0 | +1 | +2 |
| My manager | +1 | NA | -1 | +1 | NA | -1 | 0 | 0 | +1 | NA | +1 | +2 | 0 | 0 | +1 | 0 | +1 | -1 | +1 | 0 |
| My team | +1 | NA | -1 | 0 | NA | 0 | -1 | -1 | 0 | NA | 0 | +1 | -1 | -1 | 0 | 0 | 0 | -1 | 0 | -1 |
| Learning and development | +4 | NA | +1 | +6 | NA | +3 | +4 | +2 | +6 | NA | +2 | +4 | -3 | -3 | +2 | -1 | +3 | 0 | +4 | -3 |
| Inclusion and fair treatment | +3 | NA | 0 | 0 | NA | +1 | 0 | -1 | +1 | NA | +1 | +3 | -1 | -1 | +1 | -1 | 0 | -2 | +1 | +1 |
| Resources and workload | +3 | NA | 0 | +1 | NA | 0 | +1 | +1 | +1 | NA | +1 | +3 | +1 | +1 | +1 | 0 | +1 | 0 | +2 | +2 |
| Pay and benefits | +7 | NA | -3 | +2 | NA | +5 | 0 | +2 | 0 | NA | +4 | +7 | -5 | +2 | +12 | 3 | +3 | +8 | +5 | +4 |
| Leadership and managing change | +7 | NA | -1 | 0 | NA | +2 | -3 | -4 | +1 | NA | 0 | +6 | -3 | -5 | 0 | -1 | +1 | -3 | 0 | +6 |
Comparisons concerning DCMS should consider the latest machinery of government changes. DBT, DESNZ, and DSIT did not exist in 2022, therefore no comparisons could be made for these departments.
Discrimination, bullying and harassment
Discrimination is when an individual is treated differently or less favourably than someone else because of their personal characteristics, or when a working condition, policy, procedure or rule disadvantages one group of people more than another.
Bullying can be characterised as:
- Offensive, intimidating, malicious or insulting behaviour
- Abuse or misuse of power in ways that undermine, humiliate, denigrate or injure the recipient
- Bullying can also cover a broad spectrum of covert behaviours that may be more difficult to detect. It can include ill-treatment, interpersonal conflict, unwanted and unacceptable or counter-productive workplace behaviours.
Harassment is unwanted actions or comments that are demeaning and unacceptable to the recipient. It may be related to any personal characteristic of the individual, and may be persistent or an isolated incident.
Reports of discrimination remained stable at their lowest recorded level
The Civil Service benchmark score for discrimination continues to stand at 7%, the lowest recorded figure since the Civil Service People Survey began in 2009 and unchanged from 2022.
Other than the DHSC (+2pp) each department’s score was either unchanged or increased/decreased by 1pp from 2022.
Across the main departments, the WG has the lowest rate of discrimination (5%), while FCDO has the highest (13%). Of those reporting discrimination, the most common grounds of discrimination are grade (23%), disability (19%), age (17%) and working pattern (17%).
Figure 3: Experienced discrimination trend, 2009 - 2023 (access Table 3)(ODS, 18KB)
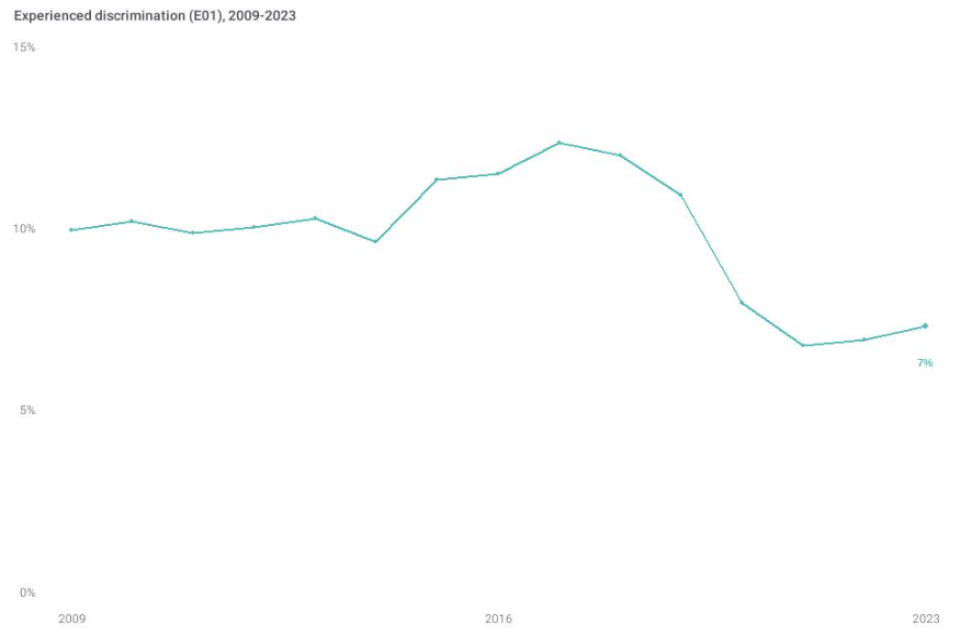
Figure 4: Experienced discrimination for the main organisations
| Department/Change | Percentage |
|---|---|
| FCDO (+1) | 13% |
| CO (+1) | 11% |
| MOD (0) | 11% |
| DWP (0) | 11% |
| MOJ (0) | 10% |
| HO (0) | 10% |
| HMRC (+1) | 9% |
| DHSC (+2) | 9% |
| DFE (0) | 8% |
| DBT (NA) | 8% |
| DSIT (NA) | 8% |
| DEFRA (+1) | 8% |
| DFT (0) | 7% |
| CSPS 2023 (0) | k7% |
| DESNZ (NA) | 7% |
| HMT (+1) | 7% |
| DLUHC (-1) | 7% |
| SG (+1) | 7% |
| NIO (+1) | 6% |
| DCMS (0) | 6% |
| WG (0) | 5% |
| Grounds of discrimination (E02) | CSPS 2023 | +/- 2022 |
| Grade | 23% | 0 |
| Disability | 19% | +1 |
| Age | 17% | 0 |
| Working pattern | 17% | -1 |
| Mental health | 16% | 0 |
| Gender | 15% | -1 |
| Working location | 15% | -1 |
| Ethnic background | 13% | -1 |
| Caring responsibilities | 12% | 0 |
| Pay | 8% | 0 |
| Social or educational background | 5% | 0 |
| Religion | 4% | 0 |
| Sex | 4% | 0 |
| Written or spoken language/ability | 4% | 0 |
| Sexual orientation | 3% | 0 |
| Marital or civil partnership status | 2% | 0 |
| Pregnancy, maternity, paternity | 2% | 0 |
| Gender reassignment/perceived | 1% | 0 |
| Any other grounds | 11% | 0 |
| Prefer not to say | 10% | +1 |
Reported rates of bullying and harassment increased to 8%
The Civil Service benchmark score for bullying and harassment increased by 1 percentage point compared to 2022, reaching 8%. Every department has seen either an increase or no change in their reported rates of bullying and harassment this year compared to 2022. The lowest rate of bullying and harassment across the main departments was at the WG (5%). The highest rates of bullying and harassment are at FCDO (12%), followed by the CO and MoD (11% each). Negative micromanagement (51%), and being treated less favourably than others (40%) were the most common types of bullying or harassment. Of those who experienced bullying or harassment, 5% said they experienced sexual harassment, while 1% said they experienced physical assault.
Figure 5: Experienced bullying and or harassment trend 2009-2023 (access Table 4)(ODS, 18KB)
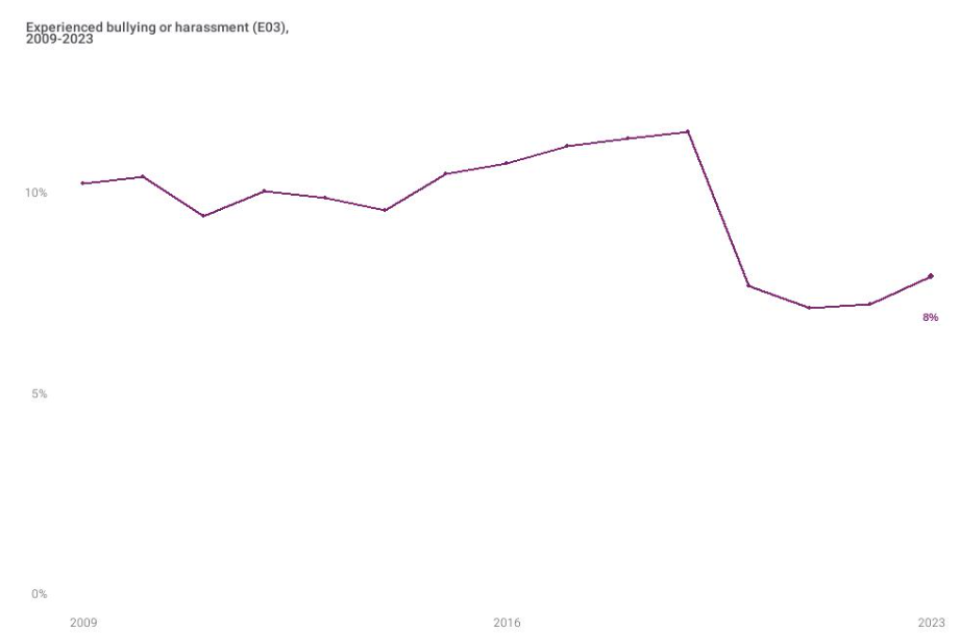
Figure 6: Experienced bullying and or harassment for the main organisations
| Department/Change | Percentage |
|---|---|
| FCDO (0) | 12% |
| CO (+1) | 11% |
| MOD (+1) | 11% |
| MOJ (0) | 10% |
| DWP (0) | 10% |
| DHSC (+1) | 10% |
| HO (0) | 10% |
| DBT (NA) | 9% |
| DFT (0) | 9% |
| DEFRA(+1) | 9% |
| DCMS (0) | 8% |
| HMRC (+1) | 8% |
| DSIT (NA) | 8% |
| SG (+1) | 8% |
| CSPS 2023 (+1) | 8% |
| DFE (0) | 8% |
| DESNZ (NA) | 7% |
| DLUHC (0) | 7% |
| NIO (+1) | 7% |
| HMT (+2) | 7% |
| WG (+1) | 5% |
| Type of bullying (E03A) | CSPS 2023 | +/- 2022 |
| Negative micromanagement | 51% | 0 |
| Treated less favourably than others | 40% | 0 |
| Humiliated in front of team/others | 37% | -1 |
| Intimidation, verbal/written aggression | 37% | -2 |
| Ignored, excluded, marginalised | 36% | -1 |
| Removal of job responsibilities | 28% | 0 |
| Undermining/taking credit for my work | 27% | 0 |
| Gossip/false accusations | 26% | 1 |
| Comments about MH or sickness | 12% | -1 |
| Disclosure of personal information | 10% | 0 |
| Personal appearance/accent | 10% | 0 |
| Sexual harassment | 5% | 0 |
| Denied time off for family/caring | 4% | -1 |
| Denied time off for ill health | 4% | -1 |
| Physical assault | 1% | 0 |
| Something else | 8% | 0 |
| Prefer not to say | 4% | +1 |
40% of staff reported their experience of bullying or harassment
The proportion of those who experienced bullying or harassment who said that they had reported their experience increased by 2 percentage points compared to 2022. Of those that reported their experience, most did so through a less formal means (56%) or confiding in someone (35%), while 23% did so formally. Of those not reporting their experience, 64% did not report it because they did not feel that corrective action would be taken.
Of those that reported their experience of bullying or harassment, 30% of colleagues indicated that appropriate action was taken to address the behaviour (+1pp compared to 2022). Although 41% indicated that the behaviour had stopped at the time of completing the survey, there has been an increase in the proportion of those who said they felt the culture in their area allowed this behaviour to continue (60% compared to 59% in 2022), but no change in the proportion of those that felt punished for reporting the incident (31%).
Figure 7: Reported bullying and or harassment trend 2016-2023 (access Table 5)(ODS, 18KB)
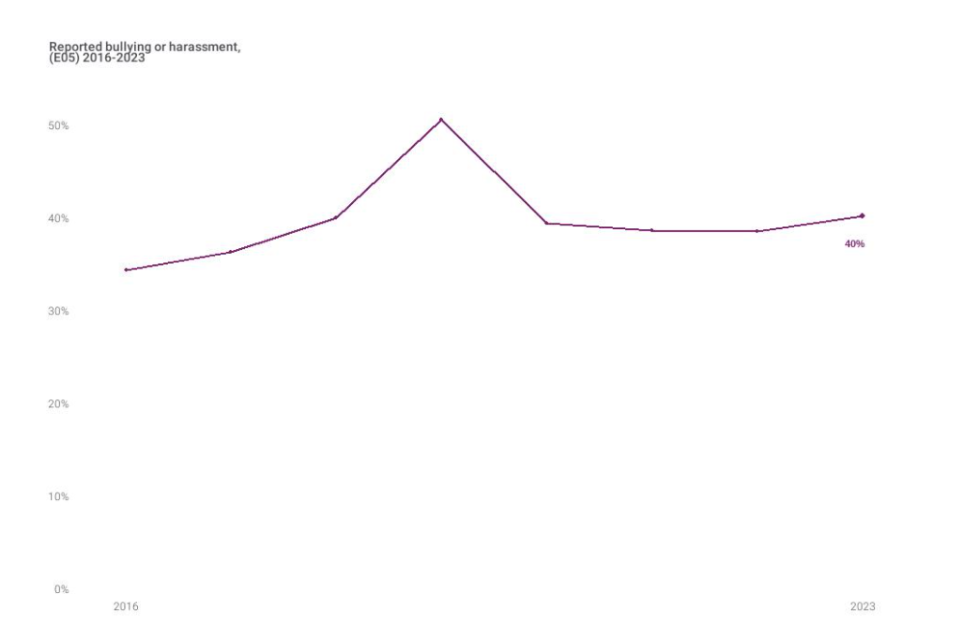
Figure 8: Appropriate actions taken following reporting bullying and or harassment (E06A)
| Year | Percentage |
|---|---|
| 2023 | 30% |
| 2022 | 29% |
Figure 9: Bullying and or harassment has stopped following reporting (E06B)
| Year | Percentage |
|---|---|
| 2023 | 41% |
| 2022 | 40% |
Figure 10: Culture allowing bullying and or harassment (E06C)
| Year | Percentage |
|---|---|
| 2023 | 60% |
| 2022 | 59% |
Figure 11: Felt punished for reporting bullying and or harassment (E06D)
| Year | Percentage |
|---|---|
| 2023 | 31% |
| 2022 | 31% |
| E05A. How did you report your experience? | CSPS 2023 | +/- 2022 |
| I reported in another way, through a less formal means | 56% | -7% |
| I confided in someone | 35% | 0% |
| I raised a formal complaint | 23% | 0% |
| In another way | 7% | 0% |
| E05B. Why did you not report your experience? | CSPS 2023 | +/- 2022 |
| I did not believe that corrective action would be taken | 64% | +2% |
| I did not want to be seen as a troublemaker | 44% | 0% |
| I felt I might jeopardise my job | 39% | 0% |
| I did not report it for another reason | 20% | -1% |
| I did not know how to report it or who to speak to | 9% | -1% |
| The behaviour stopped before I could report it | 5% | 0% |
Employee wellbeing
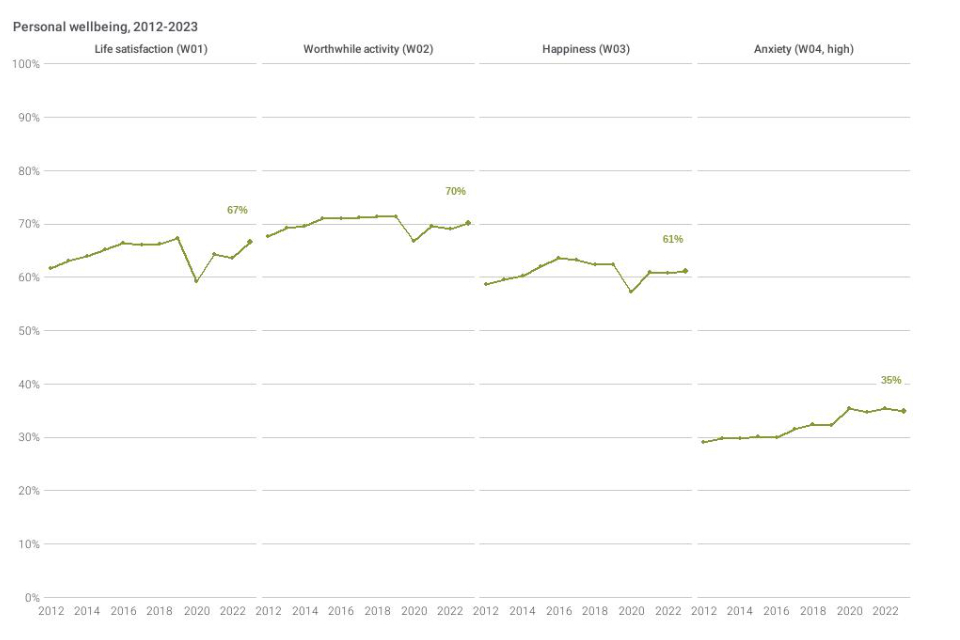
Employee wellbeing is measured in the Civil Service People Survey via four subjective wellbeing questions, aligned to Labour Force and Annual Population Surveys done by the Office for National Statistics. They cover life satisfaction, feeling that things in life are worthwhile, happiness, and anxiety. The Civil Service People Survey also includes self-assessed ratings of mental and physical health.
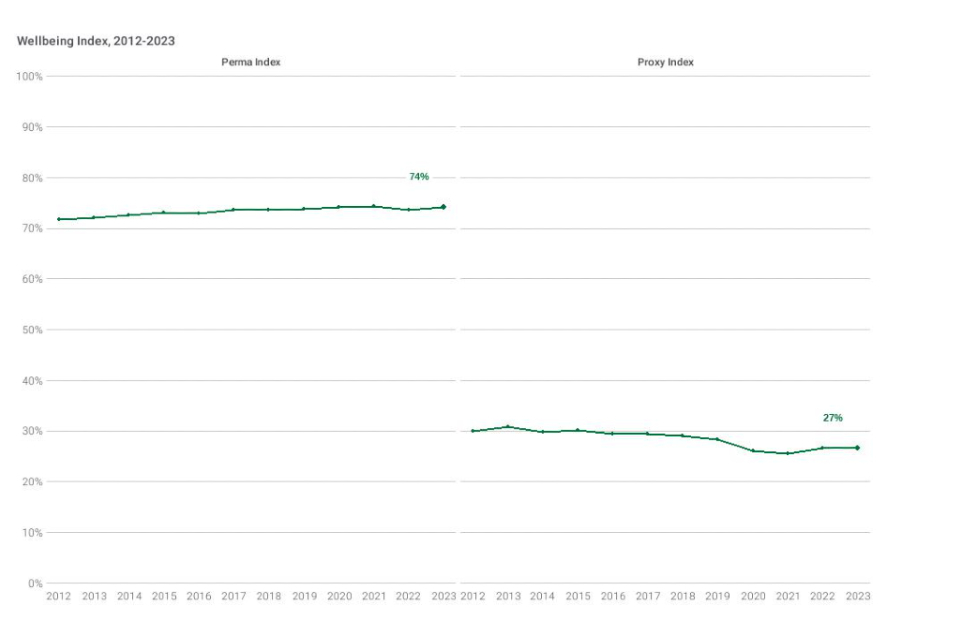
The Proxy Index measures the conditions that contribute to a stressful environment including: demands, control over work, support, relationships, role in the organisation, and change.
The PERMA Index measures the extent to which employees are flourishing at work and it is based on five dimensions: positive emotion, engagement, relationships, meaning, and accomplishment.
Three of the four benchmark scores for wellbeing improved compared to 2022
Compared to 2022, the Perma Index increased to 74%, while the Proxy Stress Index remained stable (27%).
Figure 12: PERMA and Proxy Stress Indexes trend 2012-2023 (access Table 6)(ODS, 18KB)
Three of the Civil Service benchmark scores for the personal wellbeing indicators slightly improved compared to 2022: life satisfaction (67%, +3pp), feeling things in life are worthwhile (70%, +1pp), and having high levels of anxiety (35%, -1pp). The only personal wellbeing indicator that remained stable compared to last year was happiness (61%).
Figure 13: Personal Wellbeing scores trend 2012-2023 (access Table 7)(ODS, 18KB)
Self-rated mental health increased compared to 2022
The benchmark for self-reported mental health (those reporting an excellent, very good or good level of mental health) increased by 1 percentage point and now stands at 72%, while self-reported physical health decreased by 1 percentage point to 72%.
In 2023 two new questions related to health and wellbeing were asked:
- 60% of staff indicated that their organisation provides good support for employee health, wellbeing and resilience; and
- 59% of staff indicated to discuss their personal wellbeing and or work-related stress with their manager on a monthly or weekly basis.
Modernisation, reform, productivity and efficiency
The Civil Service People Survey is a key tool for measuring attitudes and experiences across the Civil Service, and includes questions related to reform efforts. Over time these questions change, currently the survey assesses awareness of the Civil Service vision, how staff can work effectively and contribute to achieve common goals via a trustworthy relationship with their managers, collaboration with colleagues, the use of technology, and ways of working in the local areas. Since 2021 the survey included a question on self-assessed productivity and in 2022 we introduced a question on whether efficiency is pursued as a priority in the organisation.
60% of respondents are aware of the vision for “A Modern Civil Service”
The Civil Service benchmark score for awareness of the Civil Service vision for “A Modern Civil Service” increased by 1 percentage point compared to 2022 (60%).
More than half of respondents indicated that efficiency is pursued as a priority in their organisation. The organisations where this was perceived higher than the Civil Service benchmark are DWP (63%) followed by HMT (62%). Compared to 2022, there has been a -2 percentage points reduction in the proportion of staff (66%) who self-rated their productivity between 100% and 90%.
In 2023 a new question, about whether Civil Service Reform helps the way people work in their local area was introduced: 16% of respondents indicated that it does.
Figure 14: Technology helps collaboration by organisation (B59B)
| Department | Percentage |
|---|---|
| WG | 88% |
| DLHUC | 86% |
| DFE | 83% |
| DFT | 83% |
| HMRC | 81% |
| SG | 81% |
| CSPS 2023 | 80% |
| DESNZ | 77% |
| DWP | 76% |
| DEFRA | 75% |
| HMT | 71% |
| HO | 71% |
| DHSC | 70% |
| DCMS | 69% |
| MOJ | 67% |
| NIO | 66% |
| DBT | 64% |
| FCDO | 62% |
| CO | 61% |
| MOD | 58% |
| DSIT | 56% |
Figure 15: Efficiency is pursued as a priority in my organisation (B59H)
| Department | Percentage |
|---|---|
| DWP | 63% |
| HMT | 62% |
| HMRC | 60% |
| HO | 57% |
| MOJ | 55% |
| CSPS 2023 | 55% |
| CO | 54% |
| FCDO | 54% |
| DHSC | 51% |
| NIO | 51% |
| DFE | 50% |
| WG | 49% |
| SG | 49% |
| DFT | 48% |
| DLUHC | 48% |
| DBT | 48% |
| DCMS | 47% |
| MOD | 47% |
| DESNZ | 45% |
| DSIT | 43% |
| DEFRA | 43% |
| Civil Service Reform (B59-B59I) | CSPS 2023 | +/- 2022 |
| Aware of the vision for a ‘A Modern Civil Service’ (B59) | 60% | +1 |
| Understand how I can help achieve the vision (B59A) | 42% | +1 |
| Technology from my organisation enables me to collaborate (B59B) | 80% | 0 |
| Collaborate often with other organisations to achieve goals (B59C) | 37% | +2 |
| Consider how my work impacts upon the public (B59D) | 86% | -1 |
| I have a choice in where I do my work (B59E) | 83% | +4 |
| Trusted to do my job, even in a different location to my manager (B59F) | 95% | 0 |
| Self-rated productivity in past month (B59G) | 66% | -2 |
| Efficiency is pursued as a priority in my organisation (B59H) | 55% | -2 |
| Civil Service Reform is improving the way I work in my local area (B59I) | 16% | NA |
Note: Question B59I was added this year.
Future intentions
This section covers employees’ intentions in relation to continue working in or leaving their organisation. Reasons on why they would leave are also included.
22% of staff say that they would like to leave their organisation
Staff’s intention to leave as soon as possible or within the next 12 months increased by 1pp to reach 22% this year. 42% of civil servants who responded would like, instead, to stay working for their organisation for at least another year, and 36% for at least the next three years.
For civil servants who declared they intend to leave their organisation either as soon as possible or within the next 12 months, the most common reasons for doing so were a better pay and benefits package (50%); a promotion or career progression within the Civil Service (32%); or because of poor leadership (30%).
Figure 16: Intention to leave or stay in the organisation (C01)
| Year | Leave as soon as possible | Leave within the next 12 months | Stay for at least the next year | Stay for at least the next 3 years |
|---|---|---|---|---|
| 2022 | 7% | 15% | 34% | 42% |
| 2023 | 7% | 15% | 36% | 42% |
Figure 17: Reasons for intention to leave (C02)
| Reason | Percentage |
|---|---|
| A better pay and benefit package | 50% |
| A promotion or career progression within the CS | 32% |
| Due to poor leadership | 30% |
| For more interesting work | 29% |
| For a better work-life balance | 27% |
| Don’t like organisational culture | 26% |
| Due to unmanageable workload | 21% |
| A promotion or career progression outside of the CS | 20% |
| Due to poor line management | 19% |
| Lack of inclusion and fair treatment | 17% |
| Just want a change | 16% |
| Other | 9% |
| Retiring | 9% |
| Due to poor working relationship | 8% |
| Personal circumstances | 8% |
| End of my current contract / Loan | 3% |
Demographic background
This section provides a summary of the key findings at a Civil Service level by gender, ethnicity, health status, sexual orientation and socio-economic background, as per the five focus files published on our hub.
Employee Engagement Index
Compared to 2022, there have been minor reductions in the engagement levels, with a reduction by 1 percentage point for four demographic groups, and by 3 percentage points for one of them.
Specifically, compared to 2022:
- Employee Engagement was unchanged for Male (61%) and colleagues who identified as Other (53%), while it decreased by 1 percentage point for Female staff (63%). The engagement level also decreased for Cisgender (63% in 2022 and 62% in 2023) and for Transgender colleagues (58% in 2022 and 54% in 2023).[footnote 1]
- There was a 1 percentage point reduction of the engagement level for White respondents (61%) but no change for Ethnic Minority (66%).
- The engagement index was unchanged for colleagues with and without a long-term limiting condition (i.e. a disability that impacts their daily activities), at 56% and 64% respectively.
- The engagement score for Heterosexual respondents was 62% (1 percentage point lower than 2022), compared to 60% for staff who are Lesbian, Gay, Bisexual or Other (LGBO), for whom there was no change compared to the previous year.
- The engagement level remained unchanged for three of the four socio-economic background categories (intermediate, 63%, routine and never worked 62% for both categories) while it reduced by 1 percentage point for those in the high group (from 63% in 2022 to 62% in 2023).
Main themes scores
The nine benchmark theme scores, with the exception of ‘Leadership and Managing change’ remained unchanged or increased compared to 2022 for the large majority of demographics. Changes compared to 2022 are reported in brackets.
Ethnicity
| Theme/Demographic group | Ethnic Minority | White |
|---|---|---|
| My work | 76% (0pp) | 77% (0pp) |
| Organisational Objectives and Purpose | 85% (+1pp) | 83% (+1pp) |
| My Manager | 78% (+1pp) | 78% (+1pp) |
| My Team | 83% (0pp). | 83% (0pp) |
| Learning and Development | 61% (+1pp) | 59% (+1pp) |
| Inclusion and Fair Treatment | 79% (0pp) | 82% (0pp) |
| Resources and Workload | 77% (+1pp) | 75% (+1pp) |
| Pay and Benefits | 30% (+2pp) | 34% (+3pp) |
| Leadership and Managing Change | 53% (0pp) | 50% (+1pp) |
Sexual Orientation
| Theme/Demographic group | LGBO | Heterosexual |
|---|---|---|
| My work | 73% (0pp) | 77% (0pp) |
| Organisational Objectives and Purpose | 80% (+1pp) | 84% (+1pp) |
| My Manager | 77% (+1p) | 78% (+1pp) |
| My Team | 80% (-1pp) | 83% (0pp) |
| Learning and Development | 58% (+1pp) | 59% (+1pp) |
| Inclusion and Fair Treatment | 78% (0pp) | 81% (0pp) |
| Resources and Workload | 71% (+1pp) | 75% (+1pp) |
| Pay and Benefits | 31% (+2pp) | 33% (+3pp) |
| Leadership and Managing Change | 47% (-1pp) | 50% (-1pp) |
Long-term limiting condition
| Theme/Demographic group | Has Long-term Limiting Condition | No Long-term Limiting Condition |
|---|---|---|
| My work | 69% (+1pp) | 79% (0pp) |
| Organisational Objectives and Purpose | 79% (+1pp) | 84% (+1pp) |
| My Manager | 72% (+1pp) | 79% (+1p) |
| My Team | 78% (0pp) | 84% (0pp) |
| Learning and Development | 51% (+1pp) | 61% (+1pp) |
| Inclusion and Fair Treatment | 72% (0pp) | 84% (0pp) |
| Resources and Workload | 67% (+1pp) | 77% (+1pp) |
| Pay and Benefits | 26% (+3pp) | 35% (+3pp) |
| Leadership and Managing Change | 41% (-1pp) | 52% (-1pp) |
Sex/gender
| Theme/Demographic group | Composite sex/gender identity - Female | Composite sex/gender identity - Male | Composite sex/gender identity - Other | Gender Identity history - Cisgender | Gender Identity history - Transgender/other |
|---|---|---|---|---|---|
| My work | 77% (0pp) | 77% (0pp) | 66% (0pp) | 77% (0pp) | 68% (-1pp) |
| Organisational Objectives and Purpose | 85% (+1pp) | 81% (+1pp) | 77% (0pp) | 83% (+1pp) | 76% (-1pp) |
| My Manager | 78% (+1pp) | 78% (+1pp) | 74% (-1pp) | 78% (0pp) | 74% (0pp) |
| My Team | 84% (0pp) | 83% (0pp) | 78% (0pp) | 83% (-1pp) | 76% (-1pp) |
| Learning and Development | 60% (+1pp) | 57% (+1pp) | 54% (0pp) | 59% (0pp) | 53% (0pp) |
| Inclusion and Fair Treatment | 81% (0pp) | 81% (0pp) | 70% (-3pp) | 81% (0pp) | 71% (-3pp) |
| Resources and Workload | 75% (+1pp) | 74% (+1pp) | 67% (-1pp) | 75% (0pp) | 68% (0pp) |
| Pay and Benefits | 36% (+3pp) | 30% (+3pp) | 27% (+1pp) | 33% (+3pp) | 28% (0pp) |
| Leadership and Managing Change | 51% (-1pp) | 49% (0pp) | 40% (-3pp) | 50% (-1pp) | 42% (-3pp) |
Socio-economic background
| Theme/Demographic group | High | Intermediate | Routine | Never Worked |
|---|---|---|---|---|
| My work | 78% (0pp) | 77% (0pp) | 77% (0pp) | 74% (0pp) |
| Organisational Objectives and Purpose | 84% (+1pp) | 84% (+1pp) | 84% (0pp) | 83% (+1pp) |
| My Manager | 79% (+1pp) | 78% (0pp) | 78% (+1pp) | 76% (0pp) |
| My Team | 84% (0pp) | 83% (-1pp) | 83% (0pp) | 81% (0pp) |
| Learning and Development | 59% (+1pp) | 60% (+1pp) | 59% (+1pp) | 58% (+1pp) |
| Inclusion and Fair Treatment | 82% (0pp) | 82% (0pp) | 81% (0pp) | 78% (-1pp) |
| Resources and Workload | 75% (+1pp) | 75% (+1pp) | 75% (+1pp) | 71% (0pp) |
| Pay and Benefits | 34% (+3pp) | 35% (+3pp) | 34% (+4pp) | 31% (+2pp) |
| Leadership and Managing Change | 51% (-1pp) | 51% (-1pp) | 49% (-1pp) | 49% (-1pp) |
Discrimination
Between 2022 and 2023:
- Experience of discrimination at work remained the same for Male colleagues (7%) and for those who identify as Other (23%), while it increased by 1 percentage point for Female staff (9%). Rate of discrimination remained unchanged for Cisgender colleagues (8%), while it increased by +3pp for Transgender staff (21%).
- There was an increase by 1 percentage point in the proportion of Ethnic Minority staff (12%) who said they had been discriminated against at work, as well as for White colleagues (8%).
- There was a slight increase in the proportion of staff with a limiting long-term condition who had experienced discrimination (up by 1pp to 18%) and no change for those without a limiting long-term condition (6%), leaving the gap between the two still very large.
- There was no change in the proportions of heterosexual staff (8%) experiencing discrimination, but an increase by 1 percentage point for LGBO respondents (13%).
- Looking at the differences by socio-economic background, there was no change in the proportion of staff who are part of the never worked category (13%), as well as of routine and high ones (8%), while there was a small increase by 1 percentage point for the intermediate category (9%).
Bullying and Harassment
Between 2022 and 2023:
- Bullying/harassment rates remained the same at 7% for Male, 9% for Female colleagues and decreased by 1 percentage point for staff who identify as Other at 17%. The score did not change for Cisgender (8%) but it increased by 3 percentage points for Transgender colleagues (17%).
- There was no change in the proportion of Ethnic Minority (10%) colleagues who reported they had been bullied and/or harassed at work, but a small increase for White respondents (up to 8% compared to 7% in 2022) .
- There was an increase by 1 percentage point in the proportion of staff with a limiting long-term condition who said they’d been bullied and/or harassed at work (16%) but no change for staff without a limiting long-term condition (6%).
- There was an increase by 1 percentage point in the proportion of LGBO staff who indicated to have been bullied and/or harassed at work (13%), while the rate for Heterosexual respondents remained unchanged (8%).
- The level of bullying/harassment did not change based on respondents’ socio-economic background (12% for never worked, 8% for routine and high respectively), with the exception of those in the intermediate category, up by 1 percentage point to 9%.
Proxy and Perma Indexes
The Civil Service People Survey includes two indexes related to health and wellbeing: i. the Proxy Stress Index, which measures conditions that can contribute to a stressful environment; and ii. the Perma Index, which measures the extent to which employees are flourishing at work.
Between 2022 and 2023:
- The Proxy Stress Index did not change for Male and Female staff (27% in both cases), and for colleagues who identify as Other (32%). The Perma Index remained unchanged for Male at 73% and for Female staff at 75%, and it increased by 1 percentage point to 67% for colleagues who identify as Other. The Perma and Proxy indexes remained the same for Cisgender (74% and 27% respectively), while for Transgender colleagues the Perma index decreased by 1 percentage point, down to 68%, and the Proxy index increased by 1 percentage point to 32%.
- The Proxy Stress Index remained the same for both White and Ethnic minority staff (27% in both cases). Similarly, the Perma index did not change for White staff and Ethnic Minority colleagues, staying at 74% in both cases.
- The Proxy Stress Index did not change over the year for staff with (33%) and without (26%) a limiting long-term condition. The Perma Index increased by 1 percentage point for colleagues without a limiting long-term condition (76%), while remained unchanged for those with a limiting long-term condition (68%).
- There were no changes compared to 2022 in the Proxy and Perma indexes for both Heterosexual (27% for Proxy and 74% for Perma) and LGBO colleagues (29% for Proxy, and 71% for Perma).
- Considering socio-economic background, the Proxy Stress Index remained the same for all the four categories (27% for high, routine and intermediate, and 29% for never worked). Similarly, the Perma Index was unchanged for all the four socio-economic categories (75% for high, 74% for intermediate and routine, and 72% for never worked).
Civil Service Reform
Between 2022 and 2023, changes in awareness of the Civil Service vision for “A Modern Civil Service”:
- There was an increase in the awareness of the vision of a Modern Civil Service for Female staff (65%, +1pp), colleagues who identify as Other (60%, +2pp), and for Male civil servants (60%, +1pp). Awareness of the vision increased by 1 percentage point for both Cisgender (62%) and Transgender colleagues (57%).
- The level of awareness of the Civil Service vision “A Modern Civil Service” was 63% for White (+1pp) and 61% for Ethnic Minority respondents (+1pp).
- There was an increase by +1pp for both colleagues with and without a long-term limiting condition (61% and 63% respectively).
- 63% of Heterosexual colleagues indicated to be aware of the Civil Service vision (62% in 2022) compared to 61% of LGBO (59% in 2022).
- There were increases of the scores on the awareness of the Civil Service vision across all socio-economic groups (63%, +1pp for high; 64%, +1pp for intermediate; 65%, +1pp for routine) with the exception of the never worked category which remained unchanged (63%).
Annex: background information
Explanatory notes
Civil Service Benchmark
The Civil Service Benchmark is the median score across the 103 organisations who participated in the 2023 survey. We use this measure as our benchmark because it prevents the results from being skewed by a small number of organisations who contribute the largest number of respondents. A small number of question results here, where respondents can choose more than one option, are based on the results for all respondents.
Employee engagement index
The Employee Engagement Index is calculated as a weighted average of the responses to the five employee engagement questions (measuring pride, inspiration, attachment, advocacy, and motivation) and ranges from 0% to 100%. A score of 0% represents all respondents giving a rating of “strongly disagree” to all five questions. A score of 100% represents all respondents giving a rating of “strongly agree” to all five questions.
Theme scores
There are nine core theme scores within the People Survey. Each theme score is based on the average percentage of “strongly agree” or “agree” responses to all questions in that theme.
Coverage
Where we refer to our ‘main departments’, this is the 17 main Whitehall departments plus the Devolved Administrations (Welsh Government [WG] and Scottish Government [SG]) and the Northern Ireland Office [NIO]). Results are for the core department excluding any agencies, except for the Ministry of Justice and the Department for Education where the scores are inclusive of staff in executive agencies. The full names for the department codes used in tables are below:
CO - Cabinet Office
DBT - Department for Business and Trade
DCMS - Department for Culture, Media and Sport
DEFRA - Department for Environment, Food and Rural Affairs
DESNZ - Department for Energy Security and Net Zero
DFE - Department for Education
DFT - Department for Transport
DHSC - Department for Health and Social Care
DLUHC - Department for Levelling Up, Housing and Communities
DSIT - Department for Science, Innovation and Technology
DWP - Department for Work and Pensions
FCDO - Foreign, Commonwealth and Development Office
HMRC - HM Revenue and Customs
HMT - HM Treasury
HO - Home Office
MOD - Ministry of Defence
MOJ - Ministry of Justice
SG - Scottish Government
WG - Welsh Government
NIO - Northern Ireland Office
Suppression and rounding
Figures are displayed as whole numbers for the ease of reading. To ensure the figures are as accurate as possible, rounding takes place at the last stage of any calculation unless otherwise indicated.
-
Female includes both cisgender and trans female respondents. Male includes both cisgender and trans male respondents. Other covers a range of identities which do not directly align solely with a female or male identity (e.g. non-binary or genderfluid). Cisgender includes those whose gender identity is the same as their sex at birth, transgender/other includes those whose gender identity is not the same as their sex at birth. ↩