DWP annual report and accounts 2023 to 2024 (HTML)
Updated 13 November 2024

© Crown copyright 2024
This publication is licensed under the terms of the Open Government Licence v3.0 except where otherwise stated. To view this licence, visit nationalarchives.gov.uk/doc/open-government-licence/version/3 or write to the Information Policy Team, The National Archives, Kew, London TW9 4DU, or email: psi@nationalarchives.gov.uk.
Where we have identified any third party copyright information you will need to obtain permission from the copyright holders concerned.
This publication is available at https://www.gov.uk/government/publications/dwp-annual-report-and-accounts-2023-to-2024/dwp-annual-report-and-accounts-2023-to-2024-html
Annual Report and Accounts 2023 to 2024 for the year ended 31 March 2024
Accounts presented to the House of Commons pursuant to section 6 (4) of the Government Resources and Accounts Act 2000
Annual Report presented to the House of Commons by Command of His Majesty
Ordered by the House of Commons to be printed on 22 July 2024.
This is part of a series of departmental publications which, along with the Main Estimates 2024 to 2025 and the document Public Expenditure: Statistical Analyses 2024, present the government’s outturn for 2023 to 2024 and planned expenditure for 2024 to 2025.
This publication is licensed under the terms of the Open Government Licence v3.0 except where otherwise stated. To view this licence, visit: www.nationalarchives.gov.uk/doc/open-government-licence/version/3/
Where the report identifies any third-party copyright information you will need to obtain permission from the copyright holders concerned.
This publication is available at: www.gov.uk/official-documents
Any enquiries regarding this publication should be sent to DWP at:
Finance Director General’s Office
5th Floor, Caxton House
6-12 Tothill Street
London SW1H 9NA
ISBN 978-1-5286-4660-4
HC 62
Printed on paper containing 40% recycled fibre content minimum.
Printed in the UK by HH Associates Ltd. on behalf of the Controller of His Majesty’s Stationery Office.
Corrections
Correction 1
Page 80: Due to the omission of a chart which would have shown the number of accepted IPRs by Primary Service Line 2023-2024. The narrative to be amended to reflect that the additional information is published separately.
Text currently reads:
Cases received for IPRs can cover more than one DWP service line as customers may have more than one benefit in payment, meaning the customer can have more than one primary service line recorded for the IPR. The chart below shows the primary service lines relating to the customers’ cases accepted to IPRs across 2023-24.
Text should read:
Cases received for IPRs can cover more than one DWP service line as customers may have more than one benefit in payment, meaning the customer can have more than one primary service line recorded for the IPR. Additional information is published separately.
Correction 2
Page 242: The Statement of Outturn against Parliamentary Supply Analysis of Resource Outturn by Estimate contains an administrative error within the 2022-23 outturn column relating to four benefit lines within the Total AME non-voted section. The prior year totals were correctly reported in the 2022-23 ARA (page 230) as well as correctly reported in the Core tables of this ARA (page 253). This error also had no effect on the 2022-23 control total as it was a transposition error across the four lines.
The four benefit lines are documented below.
| Non-voted | Error Outturn: total 2022 to 2023 £000 |
Correction Outturn: total 2022 to 2023 £000 |
|---|---|---|
| AE Social Fund: Winter Fuel | 11,759 | 4,565,822 |
| AF Incapacity Benefit | 4,527,025 | 11,759 |
| AG Social Fund: Other | 4,565,822 | 191,742 |
| AH Employment and Support Allowance (Contributory) | 191,742 | 4,527,025 |
Date of correction: 11 November 2024
Performance report: Permanent Secretary’s Overview
This Annual Report and Account sets out the activities of the Department for Work and Pensions (DWP) over the 2023 to 2024 financial year.
DWP’s role is to provide services to over 20 million people, paying benefits, pensions and helping people to move into and progress in work. Over the course of the last year, the Department has continued to deliver a number of labour market programmes, such as Restart, Sector-based Work Academy Programmes, the Youth Offer and 50+ Choices. These programmes have improved employment outcomes for jobseekers across the country.
DWP spent £265.9 billion in Resource AME, which covers benefits paid through the welfare system in 2023 to 2024, including support for people with a disability or health condition, Universal Credit, the State Pension and Cost of Living Payments.
The Department implemented Additional Jobcentre Support across 90 jobcentres, delivered over 90,000 starts through the Sector-based Work Academy Programme and over 160,000 customers participated in the Restart scheme.
On fraud and error in 2023 to 2024, £1.3 billion in AME savings were delivered and, overall, fraud and error stayed broadly constant. The State Pension Legal Entitlement and Administrative Practice (LEAP) exercise has now completed two of the three customer groups: the Cat BL and Cat D cases. DWP has also worked closely with HM Revenue and Customs on the Home Responsibilities Protection correction exercise, and have jointly established processes to take customers through the exercise. DWP has started making payments to people whose updated National Insurance records entitle them to an increased State Pension and arrears payments.
On Universal Credit, over 540,000 Migration Notices were delivered to relevant households to notify them to make the move from legacy benefits to Universal Credit. On the Health Transformation Programme, new Functional Health Assessment contracts were signed in September, ready for implementation in 2024 to 2025.
Our Values, We Deliver, We Adapt, We Care, We Value Everybody and We Work Together and guide how colleagues work with each other, customers, and others. I would like to thank all DWP’s 85,000 colleagues for their continued hard work for the benefit of those we serve.
Peter Schofield
Permanent Secretary and Accounting Officer
Performance Overview
This section provides a summary of the purpose, plans and performance of the Department for Work and Pensions. This includes an overview of our organisation, services and structure during the period 1 April 2023 to 31 March 2024. Any reference to government refers to the government in place at that time.
Our Vision, Our Role, Our Values
In 2023 to 2024 the aims of DWP aims to improve people’s day-to-day lives and help them build financial resilience and a more secure and prosperous future. The Department aimed to do this by helping people to move into work and supporting those already in work to progress, with the aim of increasing overall workforce participation. DWP helps people to plan and save for later life, while providing a safety net for those who need it now.
To achieve this aim during 2023 to 2024 DWP focused on delivering against the following Strategic Outcomes and cross cutting Delivery Objectives.
DWP’s people are its biggest asset, and ensuring they have the right skills and capability to deliver is essential to realising the Department’s vision. To deliver the vision DWP continues to focus on its 5 values. Everyone in DWP has a role to play in achieving them.
DWP values guide how colleagues work with each other, customers, and others. Understanding how colleagues live up to them helps us learn for the future.
- we care
- we deliver
- we adapt
- we work together
- we value everybody
Public Sector Equality Duty
DWP is committed to embedding and meeting the public sector equality duty (which covers the nine protected characteristics of; age, disability, gender reassignment, pregnancy and maternity, race, religion and belief, gender, marriage and civil partnerships and sexual orientation) in everything the Department does.
DWP Services
Services for maximising employment, reducing economic inactivity, and supporting the progression of those in work.
| Service | Description |
|---|---|
| Jobcentre Plus | Provides employment advice combined with detailed knowledge of local labour markets the aim being to match people to suitable job vacancies and to help those in low-paid work to progress and increase their earnings, through DWP’s network of jobcentres. |
| Restart | Supported people who have been unemployed for at least nine months. |
| DWP’s Sector-based Work Academy Programme (SWAP) | Placements offer training, work experience and a guaranteed job interview to those ready to start a job. Its aim is to enable people to learn the skills and behaviours that employers in particular industries look for. |
| Train and Progress | Supported Universal Credit customers to participate in full-time work-related training for up to 16 weeks, allowing jobseekers to access vocational courses, such as the Department for Education’s Skills Bootcamps, which offer targeted higher-level learning in sectors. |
| DWP Youth Offer | Provided individually tailored Work Coach support to 16 to 24 year olds in the Universal Credit Intensive Work Search group, offering access to vital skills, training and employment opportunities through the Youth Employment Programme, Youth Employability Coaches and Youth Hubs. From September 2023, the Youth Offer was expanded so additional 16 to 24 year old UC claimants can take advantage of the Work Coach support offered, including young parents and carers. |
| Universal Credit | Is available to people living in the UK aged 18 or over who are on a low income or need help with living costs. Claimants may be out of work, working (including self-employed or part-time) or unable to work (for example, due to a health condition). Support is withdrawn at a steady rate as claimants move into and progress in work. |
| 50PLUS employment support | Is provided through jobcentres, with Additional Work Coach Time for eligible 50PLUS jobseekers on Universal Credit delivering more intensive, tailored support during the first nine months of their claim. Work coaches and employers are supported by over 70 dedicated 50PLUS champions working out of every jobcentre across the UK. The Midlife MOT enables workers in their 40s, 50s and 60s take stock of their work, health and money, to give them access to career, health and financial guidance to help them plan for the future. All citizens can access the online Midlife MOT, which signposts to later life planning information and resources. |
| In Work Progression | Offers access to work coach support to people who are working and earning over the Administrative Earnings Threshold, the aim being to increase their earnings and progress in work. Support is offered across all jobcentres on a voluntary basis. |
Services to deliver financial support to people who are entitled to it.
| Service | Description |
|---|---|
| The Child Maintenance Service | Can arrange child maintenance on behalf of separated parents who may be unable to agree a child maintenance arrangement between themselves. |
| The Reducing Parental Conflict | Programme aims to decrease the number of children who have to live with damaging levels of parental conflict, by giving parents access to evidence-based support to increase collaboration, whether they are together or separated. |
Services to enable disabled people and people with health conditions to start, stay and succeed in work, and get financial support.
| Service | Description |
|---|---|
| The Work and Health Programme | Provides support on a voluntary basis to disabled people, disadvantaged groups and people with health conditions, taking a holistic approach to tackling barriers to employment by linking up with health and social care providers and other local services. |
| Universal Support | Aims to expand the availability of support to disabled people, people with health conditions and people with additional barriers to employment into sustained work. Work and Health Programme (WHP) Pioneer and Individual Placement and Support in Primary Care (IPSPC) form the first phase of delivering Universal Support, to those who are eligible for WHP and not in the Universal Credit Intensive Work Search regime or claiming Jobseeker’s Allowance at the point of referral. WHP Pioneer is delivered by WHP providers across England and Wales. |
| Intensive Personalised Employment Support | Provides personalised, intensive support for people who are disabled, have complex barriers to work and who the work coach considers to be more than 12 months from the labour market. The final participants for this programme started December 2023. |
| Access to Work | Aims to provide help to get or stay in work for those who have a physical or mental health condition or disability. The support provided depends on needs and can be: —- a grant to help for practical support with work —- support with managing mental health at work —- money to pay for communication support at job interviews |
| The Disability Confident employer scheme | Is a business-led scheme aiming to increase employment opportunities for disabled people by encouraging employers to think differently about disability and take action to improve how they attract, recruit and retain disabled employees. |
| Personal Independence Payment | Aims to help people between age 16 and pension age with the additional costs associated with a disability or long-term health condition. |
| Disability Living Allowance | For children under 16 helps with extra costs associated with mobility or long-term health condition. In Scotland Child Disability Payments are available for extra costs a disabled child might have. |
Services to support financial resilience in later life.
| State Pension | Is available for people who have reached State Pension age and have obtained the qualifying years on their National Insurance record by working, receiving credits or paying voluntary contributions. The amount of State Pension received depends on the number of qualifying years they have. |
| Pension Credit | Protects pensioners on a low income by topping up any income already received to a standard minimum amount, with higher amounts for pensioners with caring responsibilities, a severe disability or certain housing costs. |
For full details of DWP services, see Department for Work and Pensions – GOV.UK
DWP Structure
The Department is led by the Secretary of State for Work and Pensions and the Permanent Secretary, who is the most senior civil servant. The Permanent Secretary and Directors General form the Executive Team, the senior decision-making body, providing corporate leadership for the Department.
As of 31 March 2024, Director General-led groups were:
| Director General led groups | Areas of responsibility |
|---|---|
| Service Excellence Group | Child Maintenance services —- Retirement services —- Dispute resolution services —- Customer Experience —- Service Modernisation —- Deployment —- Service Delivery Optimisation |
| Work and Health Services | Operational delivery of Universal Credit, Disability Services, Working Age Operations, and Counter Fraud, Compliance and Debt with jobcentres and service centres across Great Britain and Northern Ireland —- Provision of all working-age face-to-face services through jobcentres, including the relationship with employers and other external partners |
| Change and Resilience Group | Major change projects and programmes —- Senior Responsible Owner for the Universal Credit Programme —- Business continuity, resilience and crisis management for the whole of the DWP —- Fraud and error |
| Policy Group | Advising ministers on policy and strategic decisions —- Leading the departmental Outcome Boards to support collaboration and deliver outcomes —- Looking ahead and developing proposals for change, including leading cross-government strategic challenges —- Managing the Department’s welfare spending |
| Finance Group | Strategic Finance —- Payments and financial controls —- Financial management and partnering —- Business strategy —- Commercial —- Contract Management and Partner Delivery —- Analysis —- Risk management —- Security and data protection |
| Digital Group | Providing information management and expert digital, data and business transformation services —- The running of the digital estate including telephony, on-site systems, and web solutions and applications —- Sharing of DWP data across government and representing DWP at cross-government Digital and Data forums —- The Department’s Digital Innovation capability and the delivery of the Artificial Intelligence strategy —- Senior Information Risk Owner |
| People and Capability | Providing expert HR services and business partnering —- Pay strategy and policy – SCS and Delegated —- Resourcing and capacity —- Strategic workforce planning —- HR Case Management —- Capability, Learning and Talent —- Performance systems —- People Strategy —- HR Policy —- Maintaining positive Trade Union and Employee Relations —- People Safety —- Embedding DWP values and creating an inclusive culture |
| Corporate Transformation | Internal major transformation programmes and projects such as Synergy, Workplace Transformation, and DWP Critical Estates Projects —- The departmental Environmental Sustainability Strategy and Sustainability Governance —- Transitioning to a smaller, more affordable, and adaptable estate whilst investing in improving DWP’s core critical assets —- Leading DWP on Government Reform, including Places for Growth and smarter working |
Strategic Outcomes during 2023 to 2024
This high-level overview is expanded upon in the Performance Analysis section of this report which includes further details of DWP activities and analysis of progress against performance indicators.
Strategic Outcome 1 – Maximise employment, reduce economic inactivity and support the progression of those in work
Summary
DWP continued to focus on supporting people back towards the labour market, into work, and to progress in work. The Department has tackled barriers to work by enhancing existing services and through the Back to Work Plan. DWP work collaboratively with other departments to support people furthest from the labour market and those from under-represented groups to improve their future ambitions.
Performance Metrics
Employment rate of 16 to 24 year olds
Employment rate of 16 to 64 year olds
Employment rate of 50 to 64 year olds
Unemployment rate of 16+ year olds
Unemployment rate of 16 to 64 year olds
Unemployment rate of 50 to 64 year olds
Employment rate gap between 35 to 49 and 50 to 64 year olds
Economic Inactivity Rate for 16 to 64 year olds
Number of children in workless households
UC households in receipt of childcare element
Starts on Restart
Outcomes from Restart
Starts on SWAPs
UN Sustainable Development Goals
SDG 1, 4, 8 and 10
Performance Analysis
See Performance Analysis section
Strategic Outcome 2 – Deliver financial support to people who are entitled to it
Summary
Throughout 2023 to 2024 DWP delivered 40.8 million Cost of Living Payments, recognising the challenges faced by those on low incomes and the most vulnerable in our society. From April 2023, benefit rates and State Pensions were uprated by 10.1%.
DWP has arranged and collected £1.3 billion in child maintenance payments in the 12 months to December 2023, by making it easier for customers to access the Online Application process, self-serve calculator and automated payment line.
The Department continued to provide housing support, with a spend of £31.8 billion of support in the 2023 to 2024 financial year through Housing Benefit and the housing element of Universal Credit.
Performance Metrics
Absolute low-income rate, after housing costs, for working-age adults.
Absolute low-income rate, after housing costs, for children.
Rate of unfulfilled eligibility, total, and for PIP, UC, DLA
Value of unfulfilled eligibility, total, and for PIP, UC, DLA
UN Sustainable Development Goals
SDG1, 5 and 10
Performance Analysis
See Performance Analysis section
Strategic Outcome 3 – Enable disabled people and people with health conditions to start, stay, and succeed in work, and get financial support
Summary
DWP has achieved the goal to see a million more disabled people in employment between 2017 and 2027 and aimed to build on that success in 2023 to 2024. To do this the Department has introduced Universal Support, a new supported employment programme, and broadened access to Additional Work Coach Support for disabled people.
DWP has published a Health and Disability White Paper which sets out changes to the benefits system to support disabled people and those with health conditions start, stay, and succeed in work and to live independently.
Performance Metrics
Disability Employment Rate Gap.
Absolute low income rate, after housing costs, for individuals in families where someone is disabled.
Rate of economic inactivity with long term sickness as the main reason
UN Sustainable Development Goals
SDG1, 4, 8 and 10
Performance Analysis
See Performance Analysis section
Strategic Outcome 4 – Support financial resilience in later life
Summary
DWP remains committed to supporting people to build financial resilience at all stages of their life. The State Pension continues to provide a foundation to support people’s financial wellbeing in retirement and for people on a low income and at risk of poverty, DWP provides additional support through Pension Credit.
Working through DWP’s arm’s length bodies, the Department encourages people to save towards their retirement through a private pension, supported by their employer.
The Department has continued to improve systems, for example by enabling some changes of circumstances to be reported online via the Get your State Pension service. This has simplified the process, reduced processing time and enabled more pensioners to access services digitally.
Performance Metrics
Percentage of pensioners in absolute low income, after housing costs.
Number of people automatically enrolled in workplace pensions.
Proportion of automatic enrolment-eligible employees participating in a workplace pension.
UN Sustainable Development Goals
SDG1, 5 and 10
Performance Analysis
See Performance Analysis section
Delivery Objectives
Deliver high quality services, modernising services and improving customers’ experience
Summary
DWP has continued to modernise the delivery of services to improve customer experience. DWP has simplified processes and made it easier for customers to self-serve, so that its people can provide additional support to customers with more complex needs. The Department has strengthened its complaints and appeals process, learning lessons to help improve customer satisfaction. DWP continued to make progress in clearing backlogs, despite increases in demand for many of its services.
DWP is delivering the Scottish Devolution Programme with the Scottish Government, to ensure the effective devolution of welfare support following the Scotland Act 2016.
Performance Metrics
Percentage of claimants satisfied with DWP services overall.
Percentage of claims processed within planned timescales.
Percentage of UC claims processed within planned timescales.
Performance Analysis
See Performance Analysis section
Improve services, tackle Fraud, Error and Debt and drive efficiencies.
Summary
The Department is committed to tackling fraud and error in the benefits system and recovering debts owed. The Fraud, Error and Debt Report outlines what has been done to reduce overpayments and prevent loss, how underpayments are being corrected, and sets out how the Department has been managing debt recovery.
Performance Metrics
Annually Managed Expenditure (AME) savings made against DWP £1.3 billion AME savings target.
Fraud and error levels in the benefit system including both the rate and monetary value across the benefits measured in 2023 to 2024.
Performance Analysis
See Fraud Error and Debt report
Enabling the delivery of our services
Summary
Enabling functions remain an important driver of the Department’s ability to deliver on its Strategic Outcomes. These are key activities or operations that build capacity and capability, including:
- Workforce, Skills and Location
- Innovation Technology and Data
- Delivery, Evaluation, Collaboration
- Sustainability
UN Sustainable Development Goals
SDG 16
Performance Analysis
See Performance Analysis
Risks affecting the delivery of DWP’s objectives
Introduction
DWP continued to operate in a challenging external environment during 2023 to 2024, responding to global instability, cost of living pressures and uncertainty in the economy.
DWP’s risk management approach
Last year’s accounts set out the top three risk themes for 2023 to 2024:
1. Tackling fraud, error and debt
2. Building capacity in the labour market (tackling economic inactivity and improving workforce participation)
3. Resource capacity, delivering high quality services and driving efficiencies
The Executive Team has been focused on developing and delivering mitigations to the Department’s principal, top level risks, recognising the many links and complexities in the risk set.
The Department’s risk management plans need to focus on what can be influenced and ensure that decision making choices fully consider the impacts across linked risks to manage the total risk position across the Department. Key areas of focus include:
- managing increased demand for DWP services, which showed no signs of slowing in 2023 to 2024. The Department has flexed our resources to move people to work on areas of highest priority and recruited significant numbers of new colleagues.
- delivering the Department’s programme of change and transformation, which has been affected by capacity and capability challenges. Deliverability and affordability are being continuously reviewed and assessed.
- cyber-threats and the security of data have the Department’s full attention. Progress has been made on making DWP’s IT infrastructure more resilient and secure, increasing protection against cyber-attacks and other external threats, and improving data management controls.
- tackling levels of fraud and error by designing in fraud and error controls. Improving detection capability through targeted reviews, exploration of data analytics and machine learning.
- maintaining the focus on delivering a package of new measures to reduce economic inactivity which has risen from before the pandemic, expanding existing support measures while maintaining performance. During 2023 to 2024, the Risk Management Assessment (RMA) programme has continued to provide assurance on the effectiveness of risk management practices and internal control across the Department. The programme is being reviewed and enhanced to continue to ensure that DWP has a clear understanding of the risks that need to be managed, and carefully tested mitigation plans.
Chief Finance Officer Review
Introduction
In 2023 to 2024 DWP provided £266.1 billion in financial support to around 20 million people. To deliver this, £9.6 billion was spent, against a departmental Expenditure Limit of £9.8 billion, administering pension and benefit payments. This was in addition to delivering services supporting people to move into and progress in work, supporting disabled people and those with long-term health conditions.
The economic environment has continued to be challenging throughout 2023 to 2024 with cost of living continuing to rise, although at a slower rate due to falling inflation. The Department has continued to prioritise delivery of essential services and financial support to customers.
Although recruitment continued throughout the year, there has been sustained high levels of demand for DWP services. In order to balance the running of existing core services with new measures introduced at Autumn Statement and Spring Budget, the Department focused resources on delivery of the Strategic Outcomes and Delivery Objectives.
The departmental budget and how it is set
The departmental budget is split into the following spend categories:
Annually Managed Expenditure (AME) for costs that may be unpredictable. Most welfare spending is classified as AME.
Departmental Expenditure Limit (DEL) for costs relating to running the Department. DEL costs are split between Programme and Administration.
Both DEL and AME are split into two further categories. Resource spending is money that is spent on day-to-day resources and administration costs. Capital spending is money that is spent on investment and things that will create growth in the future. For further explanation on spend categories, go to How to understand public sector spending – GOV.UK (www.gov.uk)
Annually Managed Expenditure forecasts
The Office for Budget Responsibility (OBR) forecasts welfare expenditure twice a year, at the Autumn Statement and the Spring Budget. The forecasts take account of any changes to OBR’s underlying assumptions about the economy, modelling changes, and tax and spending measures announced by the Chancellor. The OBR publishes the details of the forecasts in the Economic and fiscal outlook (EFO).
Welfare Cap
The welfare cap is a limit on the amount that government can spend on certain social security benefits and Tax Credits. 50% of welfare spending is subject to the welfare cap, which excludes the State Pension and payments to jobseekers.
At the Spring Budget 2024, the OBR estimated the breach of the welfare cap plus margin to be £7.4 billion in 2024 to 2025, down by £1.1 billion since Autumn Statement. This reduction is primarily driven by higher assumed earnings growth within the Universal Credit caseload which reduces UC expenditure, and an increase in the proportion of Tax Credit claims that are assumed to close rather than migrating to Universal Credit.
The next formal assessment of the welfare cap by OBR will be at the first fiscal event of the new Parliament, in 2024 to 2025. If the welfare forecast is above the welfare cap plus margin, the Department will breach the cap and the Secretary of State will need to either:
- Lay a paper before the House of Commons proposing government policy measures which will reduce welfare spending to within the level of the cap
- Explain to the House of Commons why a breach of the welfare cap is considered justified
Departmental Expenditure Limit budget
DWP’s 2023 to 2024 budget was initially set at Spending Review 21 (SR21) at £7.8 billion (excluding depreciation). As the economic environment evolved, HM Treasury made additional funding available, including to support those most in need via the Household Support Fund (£842 million). In 2022 to 2023, DWP secured agreement with HM Treasury to budget transfer (£212 million) from that year in return for a corresponding increase in 2023 to 2024 to enable delivery across the Spending Review settlement period. The Department also received additional funding to support the Workforce Participation and Target Case Review activity within Universal Credit (£407 million). Once depreciation is taken into account, DWP received total DEL funding in its Mains Estimate 2023 to 2024 of £9.8 billion. The Spring Budget 2023 also introduced a number of employment measures to support back-to-work schemes, with additional funding being provided at Supplementary Estimate. DWP returned funding against ring-fenced funding items of spend which could not be utilised elsewhere, meaning that the Department’s overall funding remained virtually unchanged at £9.8 billion.
Departmental budget vs actual spend in 2023 to 2024
The table below sets out the Department’s actual spend in 2023 to 2024 against budget
| Spend category | Budget £ billion | Actual £ billion | Variance |
|---|---|---|---|
| Resource AME | 273.3 | 265.9 | -7.4 |
| Capital AME | 0.4 | 0.2 | -0.2 |
| Total AME | 273.7 | 266.1 | -7.6 |
| DEL Administration | 1.0 | 1.0 | 0 |
| DEL Programme | 8.1 | 8.0 | -0.1 |
| Total Resource DEL | 9.1 | 9.0 | -0.1 |
| Total Capital DEL | 0.7 | 0.6 | -0.1 |
| Total Managed Budget vs Actual Spend | 283.5 | 275.7 | -7.8 |
For further details, including trends over the past five years, see the core tables.
Departmental spend in 2023 to 2024
Welfare spend in 2023 to 2024
| Welfare spend | Pension age benefits £ billion | Working age benefits £ billion | Totals |
|---|---|---|---|
| Support for children and working age disabled people and people with health conditions | – | £27.1 | |
| Support for pension age disabled people and people with health conditions | £13.1 | – | |
| Employment and Support Allowance | – | £12.4 | |
| Housing Benefit | – | £9.2 | |
| Cost of living payments | – | £7.8 | |
| Other pension and benefits | £7.7 | – | |
| Housing Benefits | £6.0 | – | |
| Other working age benefits | – | £4.2 | |
| Cost of living payments | £2.6 | – | |
| State Pension | £124.1 | – | |
| Universal Credit | – | £52.0 | |
| Other AME including capital AME | – | – | -£0.1 |
| AME | – | – | £266.1 |
Resource Annually Managed Expenditure
In 2023 to 2024, Resource AME was £265.9 billion, including Cost of Living Payments. This was around £36 billion (15%) more than in 2022 to 2023, largely due to the annual uprating of pensions and benefits of 10.1%, as well as the continued roll-out of Universal Credit, which includes payments formerly made through personal Tax Credits paid by HM Revenue and Customs.
58% of Resource AME expenditure was paid to pensioners, with the State Pension accounting for £124.1 billion and Pension Credit for £5.5 billion. The cost of the State Pension increased by £14.0 billion (13%) compared to 2022 to 2023.
Over £78 billion[footnote 1] of Resource AME (29%) supported people with a disability or health condition (including pensioners).
Around £58.4 billion of Resource AME (22%) was spent on a range of other benefits, with the majority going to working age people (73%). This includes £32.5 billion on Universal Credit (excluding payments to support those with either incapacity or caring responsibilities).
The Department provided £10.4 billion of additional support to customers who needed it the most through the Cost of Living Payments, an increase of £2.1 billion (25%) from 2022 to 2023. More than 7 million households on means-tested benefits and Tax Credits received up to £900, at a total cost of £6.8 billion. A further 6 million people who receive a qualifying disability benefit received a one-off £150, totalling £1 billion. Over 8 million pensioner households received £300 alongside their Winter Fuel Payment in November/December 2023, valued at £2.6 billion.
Capital Annually Managed Expenditure
The Department spent £157.1 million on Capital AME in 2023 to 2024, including £30.3 million on Support for Mortgage Interest payments, £129.2 million on Universal Credit Advances and £46.3 million on Estates Dilapidations, the costs incurred at the end of a lease to return a building to its original state. This was offset by £48.7 million of Social Fund loan net repayments.
See more detailed information on benefit expenditure outturn and forecasts in the DWP benefit expenditure tables on GOV.UK.
Departmental spend in 2023 to 2024
| Spend | Cost £ billion |
|---|---|
| Digital Group | £1.0 |
| Service Excellence | £0.8 |
| Change and Resilience | £0.7 |
| Policy Group | £0.2 |
| People and Capability | £0.2 |
| Health and Safety Executive | £0.2 |
| Money and pension Service | £0.2 |
| Finance Group | £0.1 |
| Other Corporate* | £0.0 |
| Work and Health Services | £2.6 |
| Contract Management and Partner Delivery | £2.2 |
| Corporate Transformation | £1.4 |
*includes spend for Central Analysis and Science, Communications and Private Office totalling £42.7 million
Departmental Expenditure Limit
While the Department started the year in a relatively balanced financial position, a number of challenges emerged. Through strong monthly financial management and collaborative working, the Department, has been able to meet all of these challenges and more, remaining within the funding allocation for the year. The main challenges across 2023 to 2024 were as follows:
- an uplift in colleague pay was 2.5% higher than the original HM Treasury Spending Review assumption. DWP defined a strong, sustainable set of efficiencies (see detail below) which were higher than original HM Treasury targets and sufficient to cover the pay pressure.
- there was a large increase in volumes of Personal Independent Payment assessments (£29 million) across the year, and in the second half of the year, significant rises in the number of Access to Work claims, added an additional pressure of £60 million. Those pressures were absorbed by the Department.
- increased costs in some Change Programmes caused additional funding pressure, which DWP was able to accommodate by reallocating funding across the portfolio.
- while recruitment plans for the year started strongly, higher than expected levels of internal appointments created further vacancies, in addition to people leaving the Department in the first half of the year. The overall impact meant that the Department did not make material increases in the headcount until the later part of the year.
Increasing efficiency
DWP carried out a cross departmental review of a number of activities to consider options for doing them differently or for less, meeting the Spending Review efficiency challenge and keeping in line with the Government Efficiency Framework’s efficiency drivers[footnote 2].
DWP delivered £343 million in cashable savings through our procurement activity and a further £128 million in non-cashable savings[footnote 3]. During 2023 to 2024, the Department saw the introduction of the Government Commercial Organisation Corporate Scorecard. This is a mechanism for defining and measuring the key metrics that will best represent the commercial function’s performance priorities for the year, and is agreed between the Chief Commercial Officer, Finance Director General, and the Head of the Government Commercial Function. Throughout the year the Department provides monthly updates on savings to the Head of the government Commercial Function.
Further information on efficiencies from the Workplace Transformation and Service Modernisation programmes, and investment in digital services, is set out in the Delivery Objectives sections.
Performance Analysis
This section expands on the Performance Overview and includes details of DWP activities and further analysis of progress against performance indicators covering the period 1 April 2023 to 31 March 2024. Any reference to government refers to the government in place at that time.
Strategic Outcomes
Strategic Outcome 1: Maximise employment, reduce economic inactivity, and support the progression of those in work
Maximising employment
Introduction
DWP jobcentres offered advice and support to those seeking employment, including face-to-face time with work coaches and interview assistance. The Department continued to deliver on major interventions and core regimes, such as Restart, Sector-based Work Academy Programmes, Youth Offer and 50+ Choices. Autumn Statement 2023 announced the Back to Work Plan.
Restart
The Restart scheme was established in response to the COVID-19 pandemic and forecast increases in unemployment, as part of the Plan for Jobs. First referrals to Restart were in July 2021. Restart was set up as a 3 year scheme originally due to close to new referrals in June 2024. To the end of April 2024, 610,000 people have started the scheme, with 230,000 of these having moved back into work whilst participating in the scheme[footnote 4].
The Department also published an evaluation of the scheme on 9 May 2024[footnote 5]. Survey data from Wave 2 of the evaluation suggested that participants were more likely to report being in work, approximately 12 months after referral, than non-participants (35% compared to 26%). This is based on self-reported data and a more robust assessment of the impact of Restart will be produced at the end of the Scheme.
Additional Jobcentre Support pilot
Additional Jobcentre Support is testing the impact that daily intensive support has on claimants’ movement into work and overall earnings. Additional Jobcentre Support Phase 1 rolled out from February 2023 in 60 jobcentres and tested two two-week interventions at weeks 13 and 26, with one week of employability support and one week of work search support each time.
Phase 2 expanded the Additional Jobcentre Support pilot to more jobcentres in October 2023 to test additional mandatory interventions with claimants as early as week 7 of their claim. Additional Jobcentre Support now intervenes at week 7 with a week of daily employability support, and then again at weeks 13 and 26 for two-week periods of daily work search support.
Sector-based Work Academy Programmes
Sector-based Work Academy Programmes (SWAPs) offer eligible jobseekers training, work experience and a guaranteed interview for a job or apprenticeship the aim being to help businesses with recruitment and enable customers to learn the skills and behaviours employers need. SWAPs are targeted at filling jobs in sectors such as construction, health and social care, logistics, hospitality, public sector and security. In 2023 to 2024, jobcentres delivered 98,710 SWAP starts, exceeding the ambition of 80,000.
DWP Train and Progress
Train and Progress was introduced in April 2021 to reinforce work coach engagement with jobseekers in identifying and addressing skills needs, so that customers are better equipped to take up job vacancies and achieve their career goals. The core element of DWP Train and Progress is to enable Universal Credit customers to participate in full-time work-related training for up to 16 weeks. This allows jobseekers to access vocational courses such as the Department for Education’s Skills Bootcamps, which offer targeted higher-level learning in sectors such as construction, engineering and logistics.
Youth Offer
The Youth Offer provides individually tailored work coach support to eligible young people aged 16 to 24 in the Universal Credit Intensive Work Search Regime. This includes the Youth Employment Programme, Youth Employability Coaches for young people with additional barriers to finding work, and Youth Hubs across Great Britain. From September 2023, the offer was expanded to young people in other regimes including young parents and carers.
The Youth Offer is a demand-led programme. As of 1 March 2024, over 1 million young people have accessed support through the Youth Offer.
Care leavers
DWP supports care leavers, who often face a difficult transition to adulthood, through a series of safeguards and easements to simplify and improve their interaction with the benefit system. The Department has continued to contribute to cross-government activity to support care leavers into sustainable independent living to help them thrive and fulfil their potential. Our pledges under the Care Leaver Covenant list the DWP offer to care leavers and is published on GOV.UK. Department for Work and Pensions: Care Leaver Covenant offer – GOV.UK (www.gov.uk)
Individual Placement and Support and Peer Mentoring
As part of the government’s 2021 drugs strategy, DWP committed to expanding Individual Placement and Support (IPS) for drug and alcohol dependency programmes across England by March 2025, and provide employment support for individuals with an addiction, including a peer mentoring programme.
As of March 2024, the programme is live in 90 local authority areas, providing up to 9 months of employment support and 4 months of in-work support, to those in clinical treatment.
The Department also launched a peer mentoring test in 2023 to 2024 across selected areas in London, Hampshire, Merseyside, Hull and North Wales. This supports individuals to disclose their dependency, access treatment and move closer to work.
Support for refugees and humanitarian visa groups
DWP provides a range of support to help those granted refugee or humanitarian protection status, as well as those on the Afghan Resettlement and Ukraine Schemes, to integrate in the community and find work. This includes access to DWP employment programmes such as Restart, Sector-based Work Academies and early access to the Work and Health Programme. Work coaches promote DLUHC’s STEP- Ukraine Programme and Home Office’s Refugee Employability Programme.
Prison work coaches
A network of 200 prison work coaches deliver employment and benefit support to prisoners and prison leavers. DWP has continued to test different approaches to helping customers prepare their Universal Credit claim and claimant commitment.
Supporting Families Employment Advisors
Through its network of around 300 Supporting Families Employment Advisors, who worked as part of the cross-government Supporting Families Programme, DWP has developed relationships with disadvantaged families, with the aim of supporting them on the path to work, financial stability, and continuous employment outcomes. The Department for Education-led Supporting Families Programme has funded local authorities to help almost 637,000 families make sustained improvements with the issues that led to them joining the programme. The most recent data suggests that Supporting Families Employment Advisors are assisting nearly 10,000 families, resulting in around 200 job starts every month.
Supporting ethnic minority claimants
DWP supports ethnic minority claimants to move into employment by providing access to mainstream services and bespoke programmes that are designed to be flexible to individual and local needs. The Department is also taking targeted action in 20 places with a high ethnic minority employment gap. At the end of March 2024, there were 5.4 million individuals from an ethnic minority background in employment, an increase of 378,000 on the year.
Sanctions
Under the Back to Work plan, claimants are expected to either take up a job, mandatory work placement or engage in a programme of intensive activity.
To ensure that claimants comply with specific work-related requirements, DWP toughened up the approach to conditionality and sanctions, including expectations around attending jobs fairs and job interviews. Compliance is monitored by work coaches, who have been given additional tools to help track attendance, leading to sanctions where necessary.
Where sanctions are applied, DWP is ensuring claimants re-engage and re-comply by applying claim examinations through Targeted Case Reviews.
Continuing the Move to Universal Credit
As of August 2023, there were around 2.1 million households on legacy benefits remaining in scope for moving to Universal Credit. The government’s commitment was to move all legacy benefit customers to Universal Credit by the end of the financial year 2024 to 2025 with the exception of customers on Employment and Support Allowance only, and customers claiming Employment and Support Allowance and Housing Benefit (ESA only and ESA and HB).
From 3 April 2023, DWP began increasing the numbers of Migration Notices issued and by the end of March 2024 had issued over 540,000 Migration Notices to households.
Between July 2022 and March 2024, 824,050 individuals in 540,070 households were sent Migration Notices. A total of 400,940 individuals living in 275,980 households have made a claim to Universal Credit so far.
DWP now has ‘Move to Universal Credit’ operating across all jobcentre districts within Great Britain.
Both the NAO and PAC recently examined whether DWP was making progress in implementing Universal Credit[footnote 6]. The NAO concluded DWP is on track with its plan to move claimants of legacy benefits over to Universal Credit. Both the NAO and PAC highlighted concerns with the proportion of Tax Credit claimants not transferring when invited to do so and made recommendations relating to continuing the support DWP provides to help claimants move to Universal Credit. PAC also recommended the Department continues to capture the learning from its current programme in order to migrate vulnerable claimants effectively.
DWP has carried out a range of research and monitoring to better understand why some Tax Credit customers are not claiming Universal Credit and have made enhancements to the Migration Notice and reminders, to improve engagement with Tax Credit customers.
There is a range of support available to individuals to help them make the move to Universal Credit, including a dedicated DWP telephone line, face-to-face support in the local jobcentre and independent support through Help to Claim, delivered by Citizens Advice and Citizens Advice Scotland. The Department has also developed and tested a new ‘enhanced support’ journey for ESA and Income Support customers who require more support to claim. This process is now in place for these customer groups and involves outbound telephony, system checks and home visits, dependent on individual support needs.
Reduce economic inactivity
Introduction
The workforce participation package of measures announced at the Spring Budget 2023 support people to enter work, increase their working hours, and extend their working lives. These measures focus on key groups who face additional barriers to work, including disabled people and those with health conditions, the over 50s, parents and carers.
Support for older workers
DWP continues to deliver the 50PLUS employment support offer to customers across the jobcentre network and doubled the number of 50PLUS champions in November 2023 to continue to raise awareness of the needs and value of older workers.
The Midlife MOT helps workers in their 40s, 50s and 60s take stock of their work, health and money, to give them access to the best possible career, health and financial guidance to be better prepared for the future. This year we launched a £5 million expansion of the Midlife MOT. All citizens can access the online Midlife MOT which signposts to later life planning information and resources. Work continued with the government-appointed Business Champion for Older Workers to engage employers and support businesses to better recruit and retain older workers. DWP is also piloting a private sector Midlife MOT, which went live in May 2023.
Lead carer conditionality
DWP introduced changes to conditionality for lead carers of children aged 1 to 12 on Universal Credit. These changes were designed to reduce inactivity and increase labour market participation. From July 2023 the Department increased the frequency of jobcentre appointments for lead carers of children aged 1 and 2. From October 2023, the maximum hours of work-related activity for lead carers of children aged 3 to 12 increased to 30 hours.
Support the progression of those in work
Introduction
DWP has extended the support jobcentres provide to people in work and on low incomes to help them increase their earnings and move into better paid quality jobs.
In Work Progression
Over 2023 to 2024 the Department continued to support those who were in work to progress and increase their earnings. Voluntary support remains available to all claimants in the light touch and working enough groups. Claimants earning above the Administrative Earnings Threshold (AET) but below the Conditionality Earnings Threshold (CET) are in the light touch group. Claimants working and earning the equivalent of CET at National Living Wage (or National Minimum Wage if under 23) are in the working enough group.
This support focuses on removing barriers to progression, such as considering skills gaps and identifying training opportunities which help people looking for progression opportunities in their current role or through a new one. Jobcentre colleagues are supported by a network of 37 District Progression Leads across Great Britain who work with partners to spearhead the scheme.
From spring 2024, the Administrative Earnings Threshold (AET) was increased to £892 per month (£1,437 per month for couples), bringing an additional 180,000 low earning claimants into regular contact with a work coach. For further information on the AET, see Administrative Earnings Threshold to rise for Universal Credit Jobseekers – GOV.UK (www.gov.uk)
New rules require 180,000 on Universal Credit to increase working hours – GOV.UK (www.gov.uk)
UC childcare costs
To support working parents to take on additional hours, in June 2023 DWP increased the monthly UC childcare costs ‘caps’ (or maximum amounts) by 47%, allowing parents to claim back more for the childcare they need. In the same month, measures were introduced to pay claimants’ initial childcare costs directly to the childcare provider and then pay 85% of those same costs to the parent, as if they had paid it themselves. This allows parents to pay the advance payment that childcare providers require, and have additional funds to pay their next month’s costs.
These measures ensure that parents looking to move into work or increase their hours are not prevented from doing so because of high childcare costs. In April 2024, the maximum UC childcare amounts increased further to £1,014.63 per month for a single child, and £1,739.37 per month for larger families.
DWP’s performance
The following section provides the latest position on key metrics used to assess performance against this outcome. The labour market measures are drawn from the Labour Force Survey (LFS), which has experienced data quality problems as a result of low sample sizes.
The Office of National Statistics (ONS) notes that:
Due to increased volatility of LFS estimates, resulting from smaller achieved sample sizes, estimates of quarterly change should be treated with additional caution.
Employment rate by age
The latest available data, covering January to March 2024, shows the UK employment rate at 74.5% for people aged 16 to 64. The 16 to 64 employment rate is down 0.8 percentage points on the year, and down 1.7 percentage points on December to February 2020 (prior to the impact of COVID-19). The UK employment rate for young people (16 to 24) is 50.4% in January to March 2024. This is 24.0 percentage points lower than the UK employment rate for people aged 16 to 64. The 16 to 24 employment rate is down 4.1 percentage points on the year and down 4.9 percentage points on December to February 2020. The UK 50 to 64 employment rate is 70.8% in January to March 2024.
This is 3.7 percentage points lower than the UK employment rate for people aged 16 to 64. The 50 to 64 employment rate is up 0.7 percentage points on the year and down 1.5 percentage points on December to February 2020.
UK employment rate of 16 to 64, 16 to 24 and 50 to 64 year olds (Jan to Mar 2014 to Jan to mar 2024
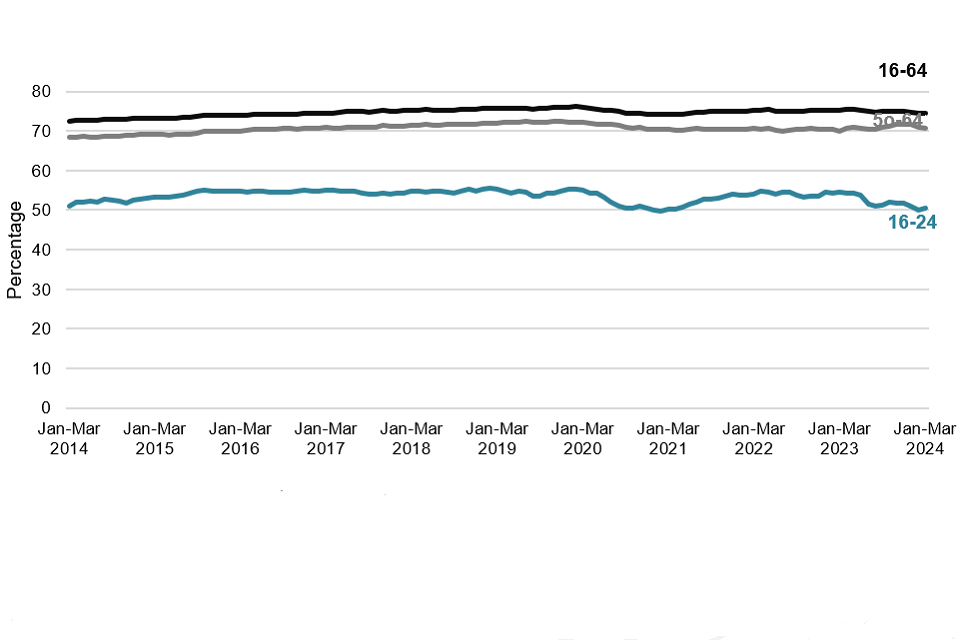
UK figures are seasonally adjusted. Source: A01 Summary of labour market statistics: Labour market status by age group – Office for National Statistics – (ons.gov.uk)
Unemployment rate by age
The latest available data covering January to March 2024, shows the UK unemployment rate at 4.3% for people aged 16+ (this is the headline measure of unemployment). The 16+ unemployment rate is up 0.3 percentage points on the year and up 0.2 percentage points on December to February 2020 (prior to the impact of COVID-19). The UK unemployment rate for people aged 50 to 64 is 2.6% in January to March 2024. The UK unemployment rate for people aged 50 to 64 in January to March 2024 is 1.7 percentage points lower than the UK unemployment rate for people aged 16+. The unemployment rate for people aged 50 to 64 is down 0.6 percentage points on the year and down 0.4 percentage points on December to February 2020.
The UK unemployment rate is at 4.4% for people aged 16 to 64 in January to March 2024. The 16 to 64 unemployment rate is up 0.3 percentage points on the year and up 0.2 percentage points on December to February 2020 (prior to the impact of COVID-19). The UK unemployment rate for people aged 50 to 64 in January to March 2024 is 1.7 percentage points lower than the UK unemployment rate for people aged 16 to 64.
UK unemployment rate of 16+, 16 to 64 and 50 to 64 year olds (Jan to Mar 2014 to Jan to Mar 2024)
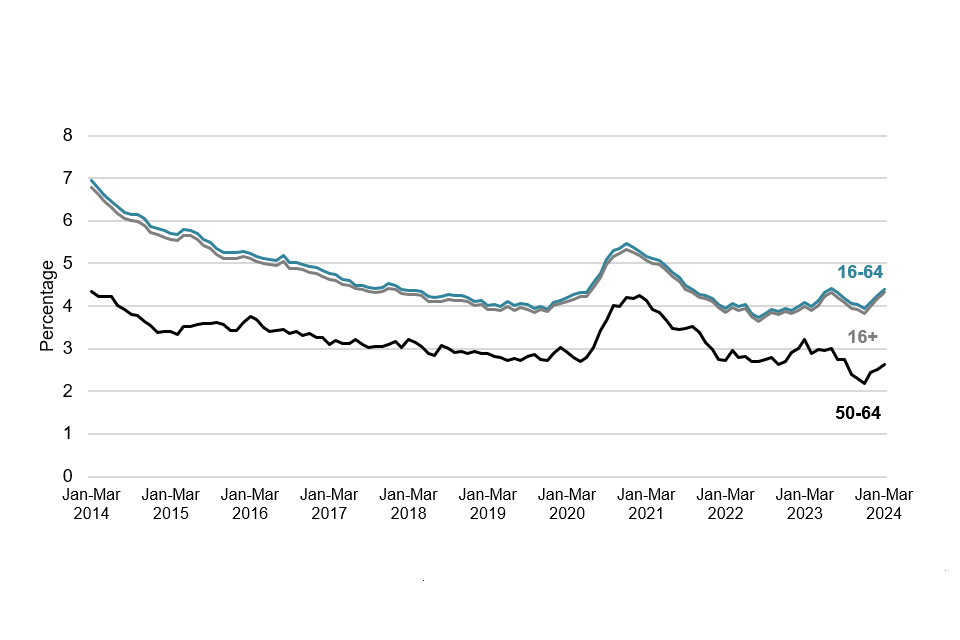
UK figures are seasonally adjusted. Source: A01 Summary of labour market statistics: Labour market status by age group – Office for National Statistics (ons.gov.uk)
Employment rate gap between 35 to 49 and 50 to 64 year olds
The latest available data, covering January to March 2024, shows that the UK employment rate gap between 35 to 49 and 50 to 64 year olds is at 14.3 percentage points. The employment rate gap between 35 to 49 and 50 to 64 year olds is down 0.8 percentage points on the year, and is up 1.2 percentage points on December to February 2020.
UK employment rate gap between 35 to 49 and 50 to 64 year olds (Jan to Mar 2014 to Jan to Mar 2024)
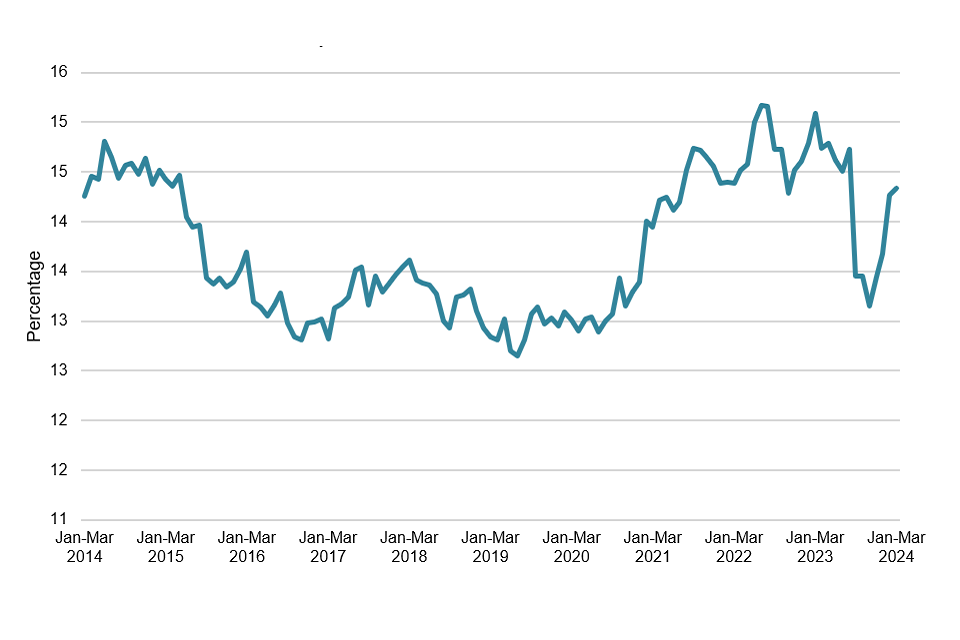
UK figures are seasonally adjusted. Source: A01 Summary of labour market statistics: Labour market status by age group – Office for National Statistics – (ons.gov.uk)
Economic inactivity rate
The latest available data, covering January to March 2024, shows that the UK economic inactivity rate for 16 to 64 year-olds is 22.1%. This is up 0.6 percentage points on the year, and up 1.6 percentage points on December to February 2020. See Strategic Outcome 3 for the rate of economic inactivity with long-term sickness as the main reason.
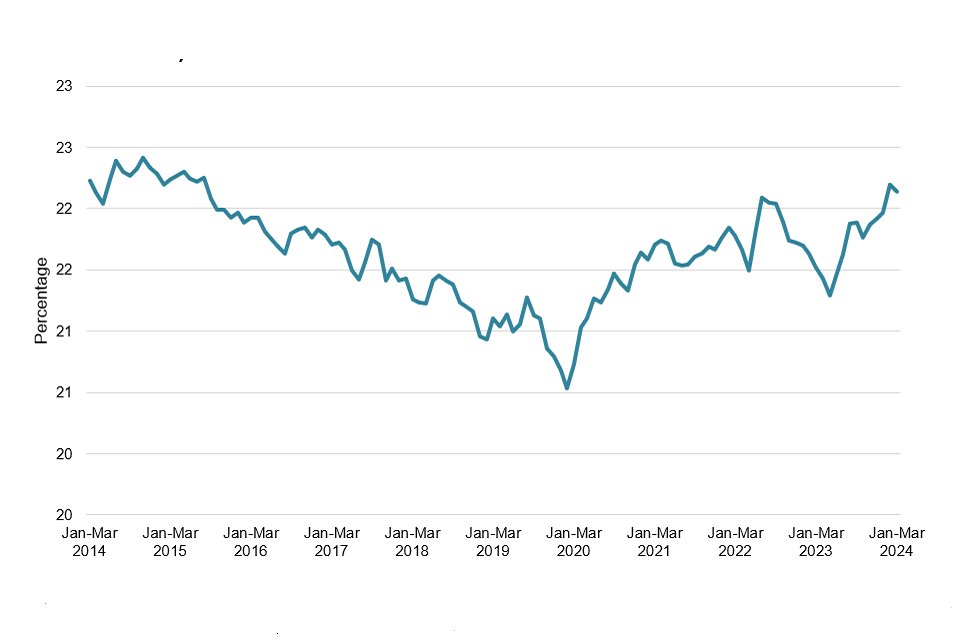
*UK figures are seasonally adjusted. Source: A01 Summary of labour market statistics: Labour market status by age group – Office for National Statistics (ons.gov.uk)
Number of children in workless households
The latest available data, for April to June 2023, shows that the number of children in workless households fell by 85,000 in the preceding year, to a total of 1.23 million.
UK children in workless households (2014 to 2023)
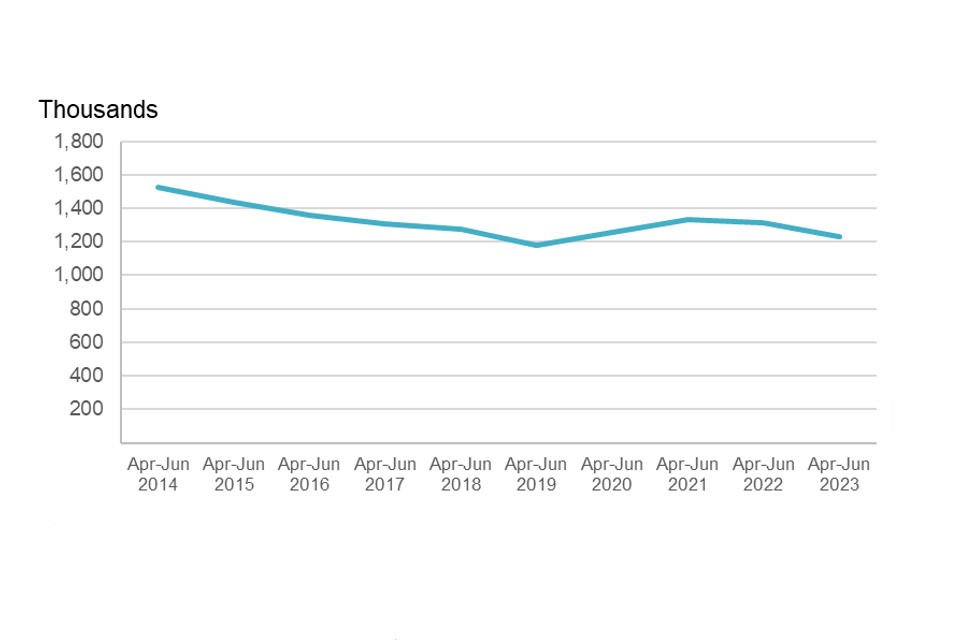
Source: table K children in households by combined economic activity status of household members – Office for National Statistics (ons.gov.uk)
ONS has suspended production of the household Labour Force Survey datasets used in these estimates. It is currently reviewing next steps for the release of children in workless households statistics. At present we do not know when the next update will be available.
Households in receipt of Universal Credit childcare element
In February 2024, 176,000 households received the UC childcare element. This has increased by 21,000 (14%) since February 2023, reflecting the overall increase in the number of households on UC. In June, July and August 2023, and again in November and December 2023, the number of households receiving the UC childcare element fell slightly. This is in line with similar falls in previous years and is likely to be because households use childcare less during holiday periods.
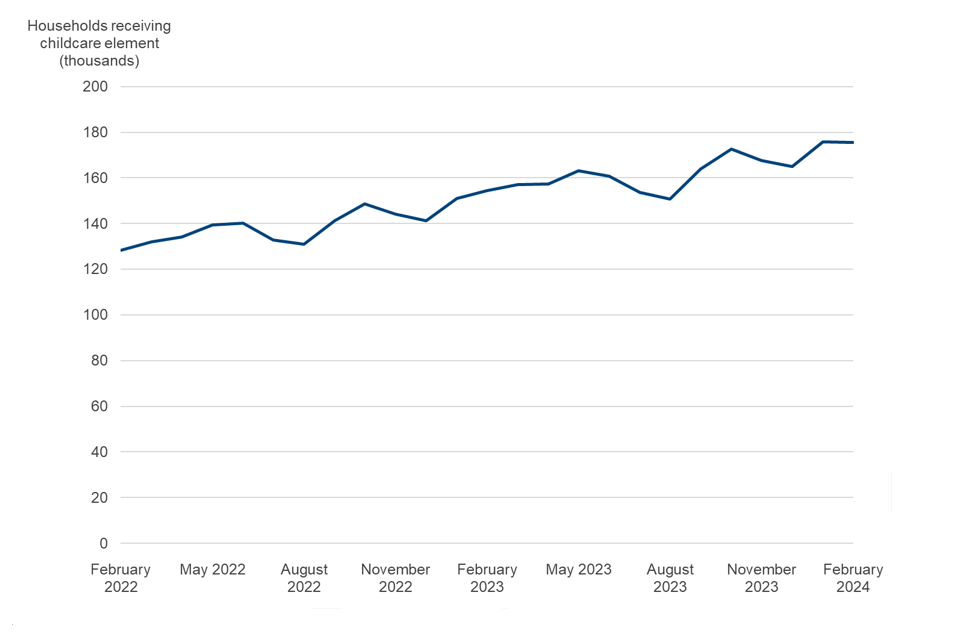
Households counted by month of assessment period start date.
Source: Universal Credit administrative data, Universal Credit statistics, 29 April 2013 to 11 April 2024 – GOV.UK (www.gov.uk)
Strategic Outcome 2: Deliver financial support to people who are entitled to it
Introduction
The Department administers working-age, retirement, disability, and ill health benefits to around 20 million claimants across the United Kingdom.
In 2023 to 2024 DWP continued to provide additional cost of living support, both through its own Cost of Living Payments and by discretionary welfare assistance provided by local authorities. The Department also continued support children and families through the child maintenance system and through the Reducing Parental Conflict and Supporting Families Programmes.
This section details how the Department supported people with the cost of living and with meeting housing costs, and protected long-term outcomes from children in 2023 to 2024.
Delivering welfare and benefits to support people with the cost of living
Cost of Living Payments
While the rate of inflation reduced during 2023 to 2024, DWP recognised and sought to address the challenges and cost of living pressures faced by vulnerable customers and those on low incomes. On 17 November 2022, further Cost of Living Payments were announced worth a total of £10.4 billion. Legislation was laid so that the first payments were paid from April 2023, with a total of 40.8 million payments being paid:
- over 7 million households on eligible means-tested benefits received up to £900 in Cost of Living Payments, with a total value of £6.8 billion
- over 6 million people who qualified for an ‘extra costs’ disability benefit received a one-off £150 disability Cost of Living Payment, totalling £1 billion
- over 8 million pensioner households received a pensioner Cost of Living Payment of £300 as a top up to their Winter Fuel Payment from November 2023, at a total cost of £2.6 billion
The Work and Pensions Select Committee carried out an inquiry into the Cost of Living Payments and published a report on 14 November 2023. Full details of responses can be found here Cost of living support payments: government Response to the Committee’s First Report - Work and Pensions Committee – (parliament.uk).
Household Support Fund
In 2023 to 24 DWP provided £1 billion, including Barnett[footnote 7] impact, to enable the extension of the Household Support Fund. This meant that £842 million was available to local authorities in England to support those most in need, with the scheme running from 1 April 2023 to 31 March 2024. The Household Support Fund operates in England only. The Devolved Administrations receive Barnett Formula funding as a result of this, as usual, and it is for them to decide how to allocate their additional funding.
Supporting people to meet the costs of housing
Ensuring people have a safe, stable, and affordable place to live is vital to improving people’s financial and personal resilience, enabling them to access work and improving their quality of life. DWP continued to provide housing support, with a spend of £31.8 billion of support in the 2023 to 2024 financial year through Housing Benefit and the housing element of Universal Credit. The Department increased access to Support for Mortgage Interest from April 2023, by reducing the qualifying period and extending eligibility to Universal Credit claimants with earnings, meaning an additional 200,000 people could benefit.
Protecting long-term outcomes for children
Child Maintenance Service
DWP continued to deliver a Child Maintenance Service (CMS). In the 12 months up to December 2023, the CMS arranged around £1.3 billion in child maintenance payments, up £152 million on the previous 12 months.
Applications to CMS, increased by 7% in the year to December 2023. The CMS compliance has increased by 3 percentage points over the same 12 months, reaching 68%.
Vital child maintenance payments are reaching parents through improved enforcement processes, in the quarter ending December 2023 money per civil enforcement action was up 6% on the same period in 2022. DWP has introduced an online application process and automated payment line, and have expanded the changes that customers can make online. More information is in the Service Modernisation Programme section.
Reducing Parental Conflict Programme
DWP protects longer-term outcomes of children through the Reducing Parental Conflict Programme. In August 2023 we published an evaluation[footnote 8] into the effectiveness of 7 different parental relationship interventions. This showed that the interventions, which typically included a number of face-to-face or online sessions with a trained practitioner, have positive outcomes for children and their parents. Benefits included child mental health and wellbeing, and reduced parental conflict. The families involved sustained those positive outcomes throughout the 12 months that they were measured.
Supporting Families Programme
Employment Advisers played a key role in the Supporting Families Programme, helping families experiencing multiple disadvantages with the aim of achieving financial stability and long-term unemployment outcomes. Families supported included those who are workless, require support with their finances, and where a young person in the household is not in education, employment or training (NEET).
For more information on Universal Credit childcare costs, see Universal Credit childcare costs – GOV.UK (www.gov.uk)
Unfulfilled eligibility
Unfulfilled eligibility refers to cases where claimants are eligible for a higher award but have not provided the correct information needed to calculate that award. The claimant might have provided the wrong information or failed to inform and report about changes to their circumstances which would have resulted in a higher award.
In May 2024 DWP published estimates on unfulfilled eligibility, with further detail on the purpose of this statistical series outlined in the Fraud, Error and Debt report.
For information on how DWP continues to deliver key services to customers, simplify processes and provided additional support to customers with complex needs to support individuals to claim what they are entitled to see the Delivery Objectives. For information on how DWP has supported disabled people and those with health conditions see Strategic Objective 3. In the 2023 to 2024 Unfulfilled Eligibility estimates, Disability Living Allowance, Personal Independence Payment, and Universal Credit account for around three quarters of the total value of unfulfilled eligibility. In particular Disability Living Allowance and Personal Independence Payment account for the highest levels of unfulfilled eligibility in the benefits system and therefore these areas are focussed in further detail below.
Supporting people to claim what they are eligible for
DWP ensure people can access financial support when they need it and understand the importance of paying people their correct entitlement. Personal Independence Payment (PIP), Disability Living Allowance (DLA) and Attendance Allowance (AA) are all tax-free, non-contributory and non-means tested. Accessing financial support.
DWP has seen increasing numbers of Personal Independence Payment (PIP) claims. The Department has introduced a blend of phone, video and face-to-face assessments with the aim of delivering a more efficient and user-centred service. DWP has also increased the availability of health professionals who carry out the PIP assessments, and case managers who are responsible for making decisions on PIP awards.
PIP new claims almost doubled between 2020 and 2023 (470,000 to 850,000), and therefore careful management of all PIP assessments was required to ensure that new claimants received their decision as quickly as possible. For claimants already in receipt of PIP but awaiting a review of their award, case managers were able to make decisions on award reviews where there is sufficient and robust evidence, without referral to an assessment provider. DWP has also introduced processes to make sure that no claim goes out of payment while waiting for a review, using short term award extensions where appropriate.
Right from the outset for individuals making new claims to PIP DWP provides information to customers via gov.uk to support their understanding of the PIP eligibility criteria and evidence requirements for claiming that benefit. Instructions on reporting a change of circumstance are also available including how to contact the Disability Service Centre who manage PIP. DWP encourages all PIP claimants to inform it straightaway if their needs have changed for better or worse. Priority is given to claims where claimants report a change in their needs to ensure DWP is paying individuals the right amount. For more information on how the Department continues to deliver key services to customers, simplifying processes and provided additional support to customers with complex needs, see the Delivery Objectives.
For more information on Health Transformation Programme and other work that DWP does to support disabled people and people with health conditions - see Strategic Objective 3. DWP will continue to improve services across the Department, engaging with key stakeholder groups to ensure the right outcome for customers.
DWP performance
The following section provides the latest position on key metrics used to assess performance against this outcome.
Absolute low-income rate, after housing costs, for working-age adults
Absolute low income refers to people living in households with income below a level set at 60% of median income in 2010 to 2011, adjusted for inflation.
In 2022 to 23, 17% of all working-age adults, 6.9 million, in the UK, were living in absolute low-income households after housing costs compared with 21%, or 8.0 million in 2013 to 2014.
Absolute low-income rate, after housing costs, for working age adults
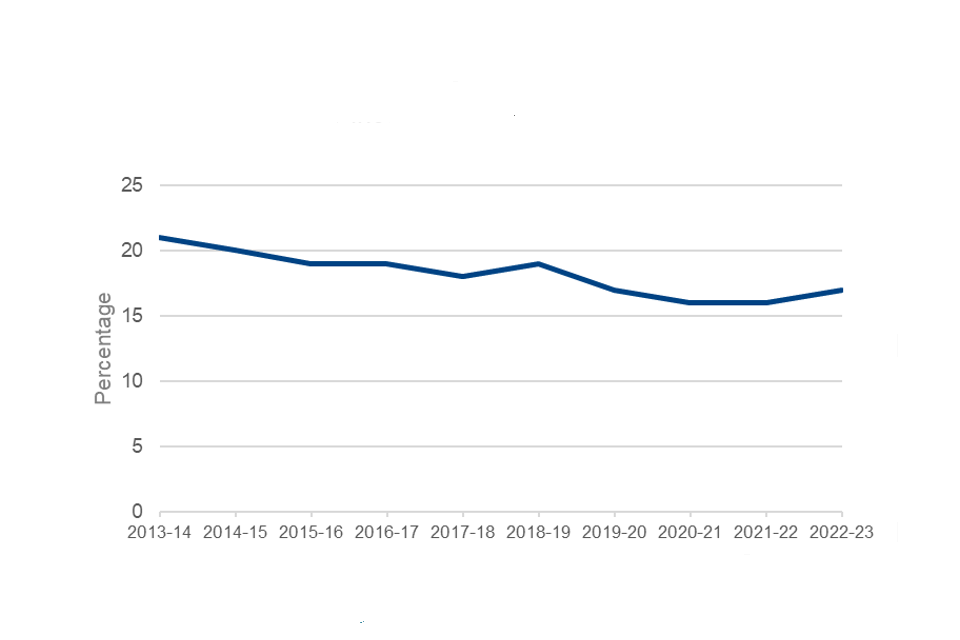
*Source: Households below average income (HBAI) statistics – GOV.UK (www.gov.uk)
Absolute low-income rate, after housing costs, for children
In 2022 to 2023, 25% of all children, 3.6 million children in the UK, were living in absolute low-income households after housing costs compared with 28%, or 3.8 million in 2013 to 2014.
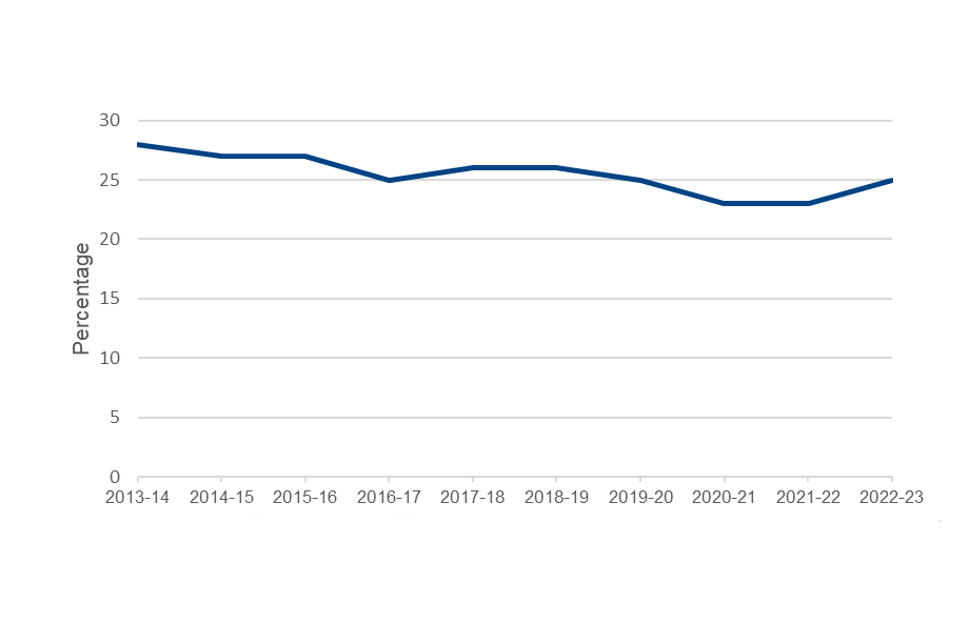
Source: Households below average income (HBAI) statistics – GOV.UK (www.gov.uk)
Unfulfilled Eligibility Estimates
DWP measures unfulfilled eligibility to understand the levels, trends, and reasons behind it – helping us identify what the Department can do to reduce the level of unfulfilled eligibility in the benefit system.
The total unfulfilled eligibility rate for 2023 to 2024 was 1.2% (£3.1 billion) compared to 1.0% (£2.3 billion) in 2022 to 2023.
The analysis showed for 2023 to 2024, Disability Living Allowance (DLA), Personal Independence Payment (PIP), and Universal Credit (UC) accounted for around three quarters of the total value of unfulfilled eligibility. The table below sets out the rate and financial value of unfulfilled eligibility for these benefits.
Unfulfilled eligibility in PIP, UC and DLA 2023 to 2024
| Benefit | 2023 to 2024 UE Value £ million | 2023 to 2024 UE rate % | 2022 to 23 UE value £ million | 2022 to 2023 UE rate % |
|---|---|---|---|---|
| Total | 3100 | 1.2 | 2300 | 1.0 |
| PIP | 870 | 4.0 | 850 | 4.8 |
| DLA | 750 | 11.1 | – | – |
| UC | 730 | 1.4 | 610 | 1.4 |
Universal Credit
The rate of unfulfilled eligibility remained at 1.4% in 2023 to 2024, the same as 2022 to 2023, with a financial value of £730 million, compared to £610 million the previous year. The largest source of unfulfilled eligibility in UC for 2023 to 2024 was for housing costs, due to claimants failing to report increases in their rent, and accounting for around 0.5%.
Personal Independence Payments
The rate of unfulfilled eligibility in PIP was 4.0% in 2023 to 2024, compared to 4.8% in 2022 to 2023. The financial value was £870 million - accounting for around a quarter of unfulfilled eligibility - compared to £850 million last year. All unfulfilled eligibility in PIP was due to claimants not informing the Department that they needed more help or that their conditions had deteriorated.
Disability Living Allowance
The rate of unfulfilled eligibility in DLA was 11.1% in 2023 to 2024. The financial value was £750 million, and all unfulfilled eligibility in DLA was due to claimants not informing the Department that they needed more help or that their conditions had deteriorated. The make-up of the DLA caseload has changed substantially since this benefit was last measured in 2004 to 2005 and therefore, DWP is unable to draw a comparison between the estimates. The reason for this change is because in 2004-05 DLA was primarily made up of working-age customers, but now, with the introduction of PIP, there are fewer working-age customers on DLA. The DLA sample for the 2023 to 2024 estimate was therefore made up purely of children and of adults over the age of 65.
Other
Other benefits account for much smaller amounts of total unfulfilled eligibility compared to PIP, DLA, and UC in 2023 to 2024. The drivers of this unfulfilled eligibility were largely housing costs (failing to report increases in rent) and capital.
Strategic Outcome 3: Enable disabled people and people with health conditions to start, stay and succeed in work, and get financial support
Introduction
Having met the goal to see a million more disabled people in employment between 2017 and 2027, the Department remained committed to helping as many disabled people and people with health conditions as possible to start, stay and succeed in work.
The working-age economic inactivity rate increased from 20.5% (8.55 million people) in December 2019 to February 2020, to 22.1% (9.38 million people) in January to March 2024: an increase of 832,000 people. During the same period, long-term sickness has also been rising and is now the is most common reason given for being economically inactive.
This section describes DWP’s activity to enable disabled people and people with health conditions to start, stay and succeed in work, and get financial support. It includes initiatives introduced following the announcements in the 2023 Spring Budget and Autumn statements, as well as information on the Health Transformation Programme (HTP).
Supporting claimants with timely and personalised support finding work
To support disabled people and people with long-term health conditions who are looking to return to work, DWP provides a range of support through the Jobcentre Plus network and through contracted employment provision. In this reporting period the Department has continued to expand support available within Jobcentre Plus, and designed new programmes specifically aimed at addressing the barriers to work experienced by disabled people and those with health conditions.
Disability Employment Advisor
Every jobcentre has access to one or more Disability Employment Advisors (DEA). DEAs offer advice and expertise on how best to help disabled people back into work and also directly support customers with a health condition or disability.
The Additional Work Coach Support (AWCS) pilot that was launched in summer 2022, continued throughout 2023 to 2024. AWCS provides disabled people and people with health conditions increased one-to-one personalised support from their work coach to help them move towards, and into, work. Over the last financial year, the number of jobcentres providing this support increased from one-third to two-thirds.
Work and Health Programme
The Work and Health Programme (WHP) provides personalised support to disabled people and disadvantaged groups who are motivated to work and expect to find it within 12 months. Participants receive up to 15 months of pre-employment support, with up to 6 months of light touch in-work support. All support is personalised to the needs of each participant, using expertise from private, public, voluntary and community sector providers.
WHP helps participants facing a wide range of barriers to work receive coordinated and holistic support. This includes support from agencies with expertise in working with ex-offenders, care leavers, refugees, drug and alcohol users, and veterans, among others.
Between November 2017 (when WHP began its roll-out across England and Wales) and February 2024, 320,000 people had started the programme, 130,000 people had started work and 85,000 people had achieved a sustained job outcome or 6 months of being in self-employment.
Universal Support
Universal support has been developed using the five stage Supported Employment model, which is based on the concept of ‘place, train and maintain. Work and Health Programme (WHP) Pioneer and Individual Placement and Support in Primary Care (IPSPC) form the first phase of Universal Support delivery and have already launched in England and Wales. WHP Pioneer opened for referrals in September 2023, offering support to an additional up to 25,000 ‘economically inactive’ people (defined as those who are eligible for WHP and not in the Universal Credit Intensive Work Search regime or Jobseeker’s Allowance at the point of referral). WHP Pioneer is delivered by WHP providers across England and Wales.
Since the launch of the first phase of Universal Support, latest data to the end of February 2024 shows there have been 5,600 starts on WHP Pioneer. Further details are available through the following link Work and Health Programme statistics – GOV.UK (www.gov.uk). Individual Placement and Support in Primary Care (IPSPC) provides support to disabled people out of work and those at risk of falling out of work due to health issues, and follows on from Health-led Trials in two locations. The Health-led Trials impact evaluation reports – GOV.UK (www.gov.uk) data was updated in April 2024.
DWP provided funding to 12 lead local authorities to deliver IPSPC services across 42 upper tier local authorities in England from April 2023.
IPSPC delivers through co-locating employment specialists across primary health care teams. These specialists work in partnership with clinicians, carers, and employers, encouraging the recognition of employment as an important driver of people’s holistic good health.
Intensive Personalised Employment Support
The voluntary Intensive Personalised Employment Support (IPES) programme supports unemployed and inactive disabled people with complex barriers to employment, who are motivated to work but are more than twelve months from the labour market. It’s aim is to empower them to find suitable employment or self-employment, or to develop the skills to do so.
IPES was launched in December 2019 in England and Wales to provide support for up to 10,000 people over a 4 year period. The Department increased capacity to meet extra demand, supporting a total number of disabled people on the programme of over 11,000 by the time referrals ended in December 2023.
NHS Talking Therapies
The Employment Advisers (EAs) in NHS Talking Therapies programme offers a unique combination of psychological treatment and employment support for clients receiving therapy for common mental health conditions, such as stress, anxiety and depression, to help them find, remain in or return to work.
Access to Work
Access to Work (ATW) is a discretionary grant to support the recruitment and retention of disabled people for employers. The grant contributes to disability-related extra costs of working faced by disabled people that are beyond reasonable adjustment, and can provide up to £66,000 worth of flexible, personalised support per person per year.
In June 2023, Access to Work introduced a new hybrid Holistic Assessment to respond to stakeholder feedback, offering customers more choice over how their assessments are carried out.
To support transitions into employment, a series of Adjustments Passports have been launched, including an Adjustments Planner for students in November 2023. The Adjustments Passports/Planner detail users’ adjustments, reduce the need to repeat personal information, remove the need to undergo assessments and support structured conversations with employers.
In 2023 a new digital payment portal and online application portal went live, enabling customers to claim for funding and choose to make their applications online.
The new digital services have been developed and tested with disabled people, organisations and charities to ensure they are as accessible as possible. For people unable to use online services, DWP retains the paper-based and telephony methods of applying for services.
Employers provide inclusive work environments
DWP delivered a range of evidence-based programmes, trials and tests, working with employers, to remove the additional barriers disabled people and people with health conditions face to start, stay and succeed in work. These focus on the Disability Confident employer scheme, launch of an Information and Guidance service for employers, the Mental Health Productivity Pilot, and a range of Occupational Health reforms.
The Disability Confident employer scheme
The Disability Confident employer scheme provides advice, support, and free resources to help employers attract, recruit, retain and develop disabled people in the workplace. As of 31 March 2024, there were approximately 19,000 members on the scheme, employing an estimated 11.5 million people.
Digital Information and Guidance service
The digital Information and Guidance service for employers was launched into live testing in 2022, and the Department has continued to work with businesses to expand content in 2023 to 2024.
The Support with Employee Health and Disability service has received approximately 13,000 hits since moving into public live testing in late 2022. Development this year included new content on managing difficult situations at work, and redesigning the site so that it is easier and quicker to navigate and produces simpler, bite-sized summaries.
The service is aimed at small and medium sized employers and is available across Great Britain. It forms part of government’s response to the Health is Everyone’s Business consultation.
The Mental Health and Productivity Pilot
The Mental Health and Productivity Pilot (MHPP) ran in the Midlands Engine region from 2019 with the aim of helping employers support the mental health and wellbeing of employees – including interventions to assess and develop organisations’ strategies in this area. It also tested early interventions for individual employees with sub-clinical mental health conditions to help them to stay and succeed in work. The MHPP delivered promotion and prevention interventions to over 1,000 businesses, approximately reaching over 650,000 employees across the Midlands Engine region (over 13% of the working population), before completing in December 2023.
Occupational Health consultations
Two occupational health (OH) consultations were announced at Spring Budget 2023 seeking views on ways of increasing employer uptake of this support.
- HM Treasury/HM Revenue and Customs: Tax Incentives for Occupational Health
- DWP/Department of Health and Social Care: Occupational Health, Working Better
Announced at Autumn Statement 2023, the Occupational Health: Working Better response outlined plans to establish an expert group to support development of a new occupational health Voluntary Minimum Framework. The group was chaired by Dame Carol Black, with the first meeting taking place during quarter 1 of 2024.
In January 2023, the Department launched a £1 million fund to stimulate innovation in the OH market, focused on increasing access to and capacity in OH. The fund encourages the development of new models of OH tailored to small and medium enterprises (SME) and the self-employed, through better use of technology. Phase 1 ended in January 2024.
To start addressing shortages within the clinical OH workforce, in July 2023 the OH Workforce Expansion scheme was launched, which is providing funding for doctors and nurses to undertake OH training, and an option to take exams to gain formal qualifications in OH. The first exams took place in May 2024.
Review into autism and employment
On World Autism Acceptance Day in April 2023, DWP announced a new review into autism and employment. The review focused on identifying barriers preventing autistic people from starting employment, staying in employment, and growing their careers. Between April and September, the review received evidence from hundreds of employers, autistic people and others, then compiled 19 recommendations and actions to boost autism employment rates over the next five years.
Systems to support individuals through better incentives and gateways
At Autumn Statement 2023, DWP announced that it would trial new ways of providing people receiving a fit note with timely access to work and health support. This will include referrals to a range of support tailored to their needs, such as integrated employment and health support through WorkWell, care coordination to help individuals manage their treatment journey, and signposting to wider social and psychological support. The outcome of this work is to help people stay in or return to work by accessing work and health support at the right time.
- The fit note guidance products on GOV.UK in October 2023 to make them easier to navigate, remove outdated information and provide a new, streamlined one-page guide for healthcare professionals.
- A project to embed the fit note in secondary care - such as hospital IT systems in England - is currently being implemented. This aims to encourage healthcare professionals in secondary care to issue fit notes where that is most appropriate.
The Health and Disability White Paper
Transforming Support: The Health and Disability White Paper – GOV.UK (www.gov.uk) was published alongside the Spring Budget in March 2023 and sets out future support for disabled people and people with health conditions.
Work Capability Assessment reform
Ahead of these changes, at Autumn Statement 2023 changes to the Work Capability Assessment (WCA) criteria were announced, to reflect changes in work since the criteria were last comprehensively reviewed in 2011.
White paper tests and trials
In 2023 to 2024, the Department expanded the Employment and Health Discussion (EHD) test and made progress on Condition-Focused Assessors work. The Department also began testing a Health Impact Record, introduced a new initiative for the Severe Disability Group, and concluded the Enhanced Support Service (ESS) proof of concept.
The Department expanded the EHD test to 13 sites across England and Wales in October 2023. The EHD is led by a healthcare professional and focuses on how DWP can help people to overcome their barriers to moving towards work.
Work on Condition-Focused Assessors also progressed. In Autumn 2023, in Health Transformation Area sites in London and Birmingham, small-scale testing started matching certain PIP, UC and ESA claimants’ primary health condition to an existing assessor with professional experience of supporting people with that condition. The aim is to understand whether claimants view this different approach positively and if it improves their trust in the assessment process. This test was expanded in January 2024 to include claimants with multiple conditions.
The department is testing a new initiative, the Severe Disability Group, for people with the most severe health conditions, so they do not need to complete a detailed application form or go through an assessment. This policy is being tested on a small scale across a range of health conditions. Insight will then be gathered from service users, DWP colleagues and organisations to make sure it works as intended.
Testing of the Enhanced Support Service proof of concept concluded in March 2024. The Enhanced Support Service provided bespoke personalised support for vulnerable people who find it hardest to use the benefits system, such as those who do not have friends or family to support them. It was not a universal service. This test has provided insights into how the Department can provide support and assistance to vulnerable citizens.
White paper engagement with stakeholders
DWP continued to work with disabled people, people with health conditions and expert stakeholders to develop policy reform and reach the important goals set out in the white paper.
Since publication the Department has created a White Paper Engagement Board, bringing together representatives from:
- Disabled People’s Organisations forum
- Disability Charities Consortium policy leads group
- Disability Health Policy forum
- Ethnic Minority Forum
- Disability Confident Business Leaders Group
- Other organisations and charities
Detailed engagement has been carried out with stakeholders on specific policy areas and tests and trials. This provides stakeholders with the opportunity to share their expertise, knowledge and lived experience.
Health Transformation Programme
Introduction
The Health Transformation Programme (HTP) aims to modernise health and disability benefit services and enable the delivery of changes set out in the Health and Disability White Paper. HTP is developing a new single Health Assessment Service (HAS) to provide a streamlined, tailored, claimant-focused service for functional health assessments. It will also transform the end-to-end journey for people applying for Personal Independence Payment (PIP).
In-house Health Transformation Area
In the small-scale in-house Health Transformation Area (HTA), colleagues continue to develop, test, and iterate systems and processes for the new HAS and PIP service. Latest quarterly information published on 19 March 2024 shows that, in the HTA, 10,120 PIP, UC and ESA cases have been referred for health assessment. From January 2024, the Department has started to pilot processes and ideas developed in the HTA, in a Disability Services operational site for the first time. The aim is to grow the service gradually and carefully from here.
In July 2023 a new service testing began, to enable claims for PIP to be made online on GOV.UK in selected areas across England, subject to certain eligibility criteria. In December 2023 this ’Apply for PIP’ service was made available in postcode districts across England covered by the HTA.
Functional Assessment Service
New Functional Assessment Service (FAS) contracts that prepare the foundation for future transformation were signed in September 2023. Under these new contracts a single supplier will be responsible for delivering all assessment services in a geographic area, meaning claimants will interact with only one provider to assess their disability or health condition. Current contracts were extended to provide an 11-month transition period, and the current focus is to carefully manage this complex transition to mitigate the risk of instability and support as smooth a transition as possible. The new contracts will provide the flexibility to gradually introduce the new Health Assessment Service once developed.
Health Transformation Programme evaluation strategy
In May 2023 we published the Health Transformation Programme evaluation strategy was published. As per the commitment set out in the strategy, the first of a quarterly series of Management Information was published in December 2023 on the volume of assessment referrals in the HTA, and volume of Apply for PIP submissions. Latest data was published in March 2024 and can be found at Health Transformation Programme Management Information to January 2024 – GOV.UK (www.gov.uk)
Following its HTP Value for Money study, the National Audit Office published its report ‘Transforming health assessments for disability benefits’ in June 2023, which concluded that there are risks to Value for Money which need to be carefully managed to ensure the full benefits intended. The Public Accounts Committee took evidence on the NAO report in July 2023 and published a report. DWP’s response to the Public Accounts Committee recommendations was published in February 2024.
DWP performance
The following section provides the latest position on key metrics used to assess performance against this outcome.
Disability employment rate gap
There were 5.5 million disabled people in employment in January to March 2024, an increase of 200,000 since January to March 2023 In addition to the number of disabled people in employment, DWP continues to monitor the disability employment gap, the difference between the disabled and non-disabled employment rates. The gap has decreased by 0.6 percentage points over the last year, from 29.4 percentage points in January to March 2023 to 28.8 percentage points in January to March 2024.
These measures are ‘outcome measures’ reflecting the real-world improvements the government wants to see, rather than direct measures of DWP performance. They are affected by external factors such as the size of the underlying disabled population and overall labour market performance, as well as DWP activity.
Disability employment gap (2014 to 2024)
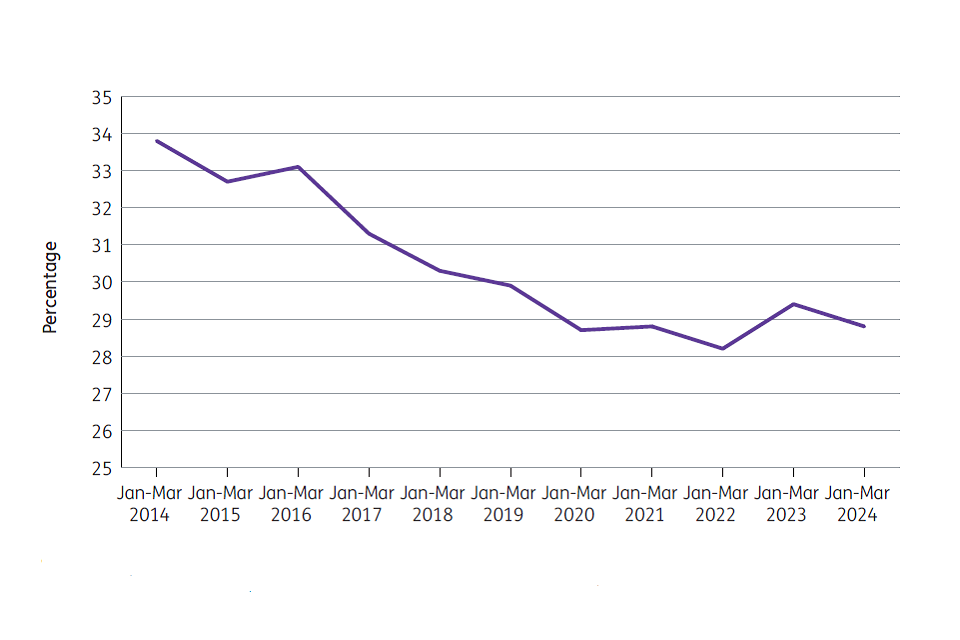
Source: A08: Labour market status of disabled people
Rate of economic inactivity with long-term sickness as the main reason
The percentage of people whose main reason for being economically inactive is long-term sickness has generally been increasing since before the pandemic. The latest figures for January to March 2024 show there are now 2.82 million people who are economically inactive with the main reason as long-term sickness, an increase of 0.2 percentage points (109,000) on the year. Long-term sickness is the most common reason (for the working-age population as a whole) for being economically inactive. See Strategic Outcome 1 for the UK Inactivity Rate for 16 to 64 year olds.
Rate of econonomic inactivity with long-term sickness as the main reason (2014 to 2024)
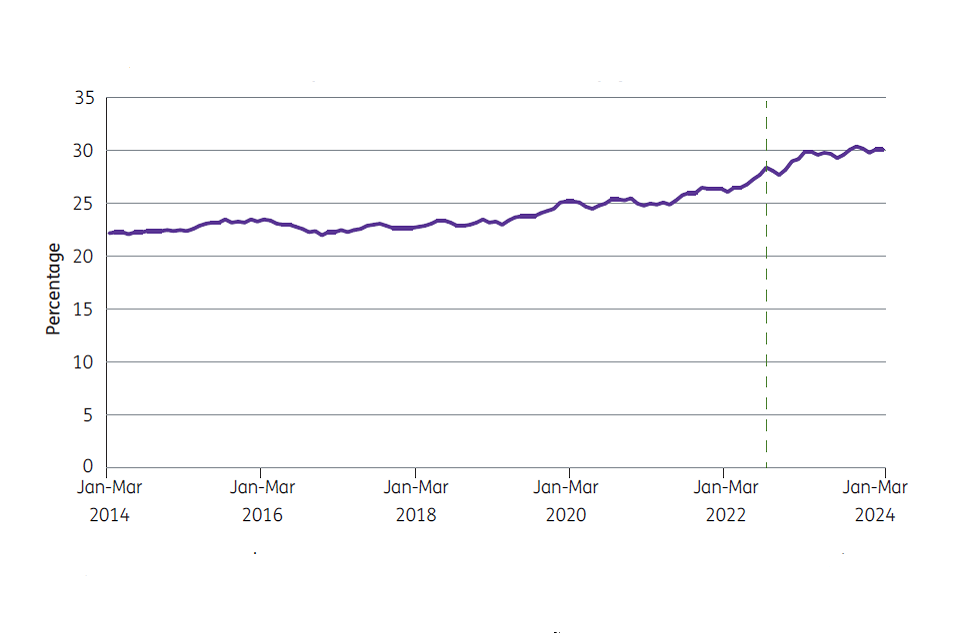
Data from July to September 2022 onwards has been reweighted to incorporate the latest estimates of the size and composition of the UK population. Therefore, data prior to and from July to September 2022 are nit directly comparable. Reweighting does not address the volatility seen in recent periods and caution should be used when interpreting short-term changes.
Source: INAC01 SA: Economic inactivity by reason seasonally adjusted)
Absolute low-income rate, after housing costs, for individuals in families where someone is disabled
In 2022 to 2023, 20% of all individuals in a family where someone is disabled in the UK, or 5 million people, were in households with absolute low-income after housing costs. This represents a decrease of 7 percentage points, or 100,000 people, since 2013 to 2014.
Absolute low-income rate, after housing costs, individual families where someone is disabled
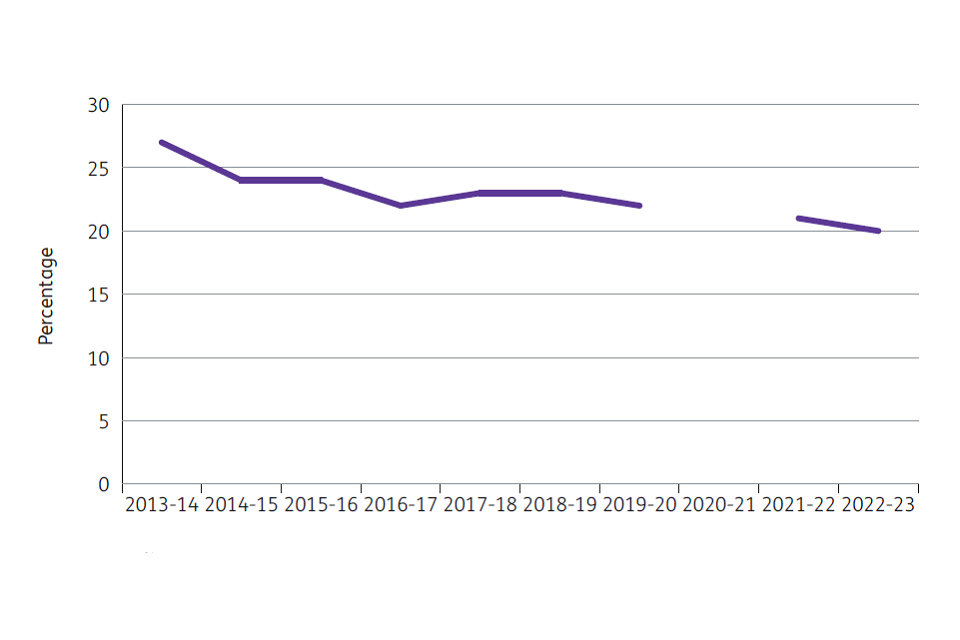
Source: Households below average income (HBAI) statistics – GOV.UK (www.gov.uk)
Data is not available for 2020 to 2021 due to data quality concerns affecting many of the HBAI estimates calculated below UK (headline) level for that year.
Strategic Outcome 4: Support financial resilience in later life
Introduction
DWP remains committed to supporting people to build their financial resilience at all stages of their life. As part of this commitment, the Department has ensured that State Pensions continue to provide a sustainable foundation to support people’s financial wellbeing in retirement, as well as providing additional support for those on low incomes through Pension Credit. DWP continues to ensure that people are encouraged to save for their retirement through automatic enrolment and to build confidence in a well-run private pension market. Working with DWP public bodies, the Department wants to ensure people’s workplace pensions work effectively and efficiently for them.
This section details how the Department has ensured pensioners receive the financial support they need to enable a secure retirement throughout 2023 to 2024.
Ensuring State Pensions provide a foundation for financial resilience
From April 2024, the new and basic State Pensions increased by 8.5%, with the full rate of the new State Pension now exceeding £11,000 a year.
During 2023 to 2024 DWP has continued to transform services through system improvements, such as enabling some changes of circumstances to be reported online to Get Your State Pension.
Ensuring pensioners receive the financial support they need
In 2023 to 2024, DWP continued to promote Pension Credit through a comprehensive awareness campaign, which included TV, radio and newspaper advertising and online marketing on various platforms. The sustained high volumes of applications for Pension Credit, over 250,000 in 2023 to 2024, helped to ensure that pensioners who needed it most not only received Pension Credit but received additional support from Cost of Living Payments.
Enabling a secure retirement
The Department has worked to ensure that people in the UK are able to save for retirement through the private pensions market. Automatic enrolment has normalised workplace pension saving for many workers in the UK. This section outlines some of the other ways DWP has been working to make sure people’s pensions work effectively and efficiently for them.
Automatic enrolment
By April 2024, over 11 million people had been automatically enrolled. Pension participation continues to hold up following the roll-out of automatic enrolment, despite the challenges of COVID-19 and cost of living pressures. The latest statistics show that 88% of eligible employees are participating in a pension and that the proportion of savers stopping saving remains at around 1%[footnote 9].
The Pensions (Extension of Automatic Enrolment) Act 2023 provides the powers to automatically enrol workers into a pension from age 18 (reduced from age 22) and expand saving levels. These measures which were proposed in the 2017 Review of Automatic Enrolment are estimated to have an impact on 3 million private sector employees. The 2017 Review report committed to implementing these changes in the mid-2020s, consistent with the 2017 Review of Automatic Enrolment, alongside exploring ways to make it easier for self-employed people to save for retirement.
Pensions dashboards
DWP continued to support the delivery of pensions dashboards. These allow savers to find and view their pensions information in one place online. The reset of the Pensions Dashboards Programme, announced in March 2023, has allowed more time to ensure dashboards can be delivered safely and securely. Ahead of testing connections from August 2024, the Programme has also been implementing a revised delivery plan. To support with industry’s preparations forpensions dashboards, in March 2024 DWP published guidance which sets out a connection timetable for all pension schemes and providers in scope in advance of the legislative connection deadline of 31 October 2026.
Master Trust sector
DWP published detailed findings and recommendations from a review into the Master Trust market and the rules that govern it. The report makes a series of proposals for the Pensions Regulator to take forward. Evolving the regulatory approach to master trusts – GOV.UK (www.gov.uk)
The Department also published key trends in the Trust-based private pensions market and what this means the market may look like in 2030, alongside this report.
Defined benefit schemes
DWP is looking at ways in which assets held by defined benefit schemes can be used to deliver for savers, and support investment in the UK economy. The Department has already committed to introducing a regulatory regime for commercial defined benefit consolidators (Superfunds). DWP’s response to the defined benefit call for evidence, published at Autumn Statement, included the commitment to bring forward changes to make surplus extraction easier and to introduce a public sector consolidator, operated by the Pension Protection Fund.
On 23 February 2024, DWP launched a public consultation to seek views on these proposals as well as appropriate protections for member benefits.
In March 2024, the Department introduced requirements to support trustees and sponsoring employers of defined benefit pension schemes to plan and manage their scheme funding over the long-term, to manage risks with the aim of protecting member benefits. The Occupational Pension Schemes (Funding and Investment Strategy and Amendment) Regulations 2024 – (legislation.gov.uk)
DWP performance
The following section provides the latest position on key metrics used to assess performance against this outcome.
Absolute low-income rate, after housing costs, for pensioners
In 2022 to 2023, 12% of all pensioners in the UK, or 1.4 million, were in households with absolute low-income after housing costs. This represents a decrease of 2 percentage points, or 300,000 people, since 2013 to 2014.
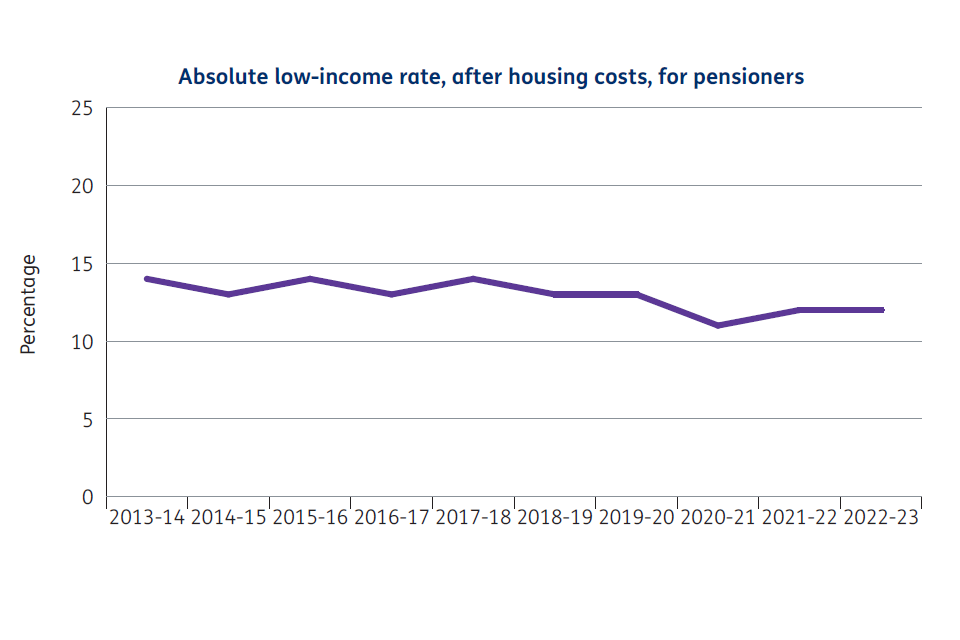
Source: Households below average income (HBAI) statistics – GOV.UK (www.gov.uk)
Delivery Objectives
Delivery Objective: Deliver high quality services, modernising our services and improving our customers’ experience
Deliver high quality services
Introduction
The increased volumes the Department experienced during 2022 to 2023 have remained a feature throughout this financial year. Cost of living pressures, increased media attention and publicity campaigns such as Help for Households and Pension Credit take up activity, continued to drive high demand for DWP’s services. The majority of the Department’s service lines saw higher intakes of claims and changes compared to two years ago, alongside increased telephony demand, with calls to State Pension and Pension Credit in particular increasing as a result of the publicity campaigns mentioned above.
As the Department forecasted a significant gap between the demand for its services and its ability to meet that demand in 2023 to 2024, the focus for this year has been on maintaining performance against these pressures. The Department has strived to do this by delivering improvements in productivity, streamlining its recruitment processes and using existing contracts to increase the capacity from its external partners. DWP continued its service modernisation activity to make it easier for customers (who are able to) to self-serve, reducing demand on the Department’s operational teams and enabling colleagues to provide additional support to customers with more complex needs.
Balancing increased demand for DWP services
The increased demand is reflected in the charts below which show the impact on Child Maintenance Service (CMS) and Universal Credit (UC) compared to previous years. UC intakes in 2023 to 2024 were 31% higher than in 2021 to 2022. CMS average quarterly intake in 2023 to 2024 so far is 80% higher than the quarterly average seen in 2021 to 2022.
- CMS new application intake in Quarter 3 of 2023 to 2024 increased to 28,600, compared to 27,200 for the same period in 2022 to 2023. UC intakes increased to 328,344 in March 2024 from 176,875 in March 2023.
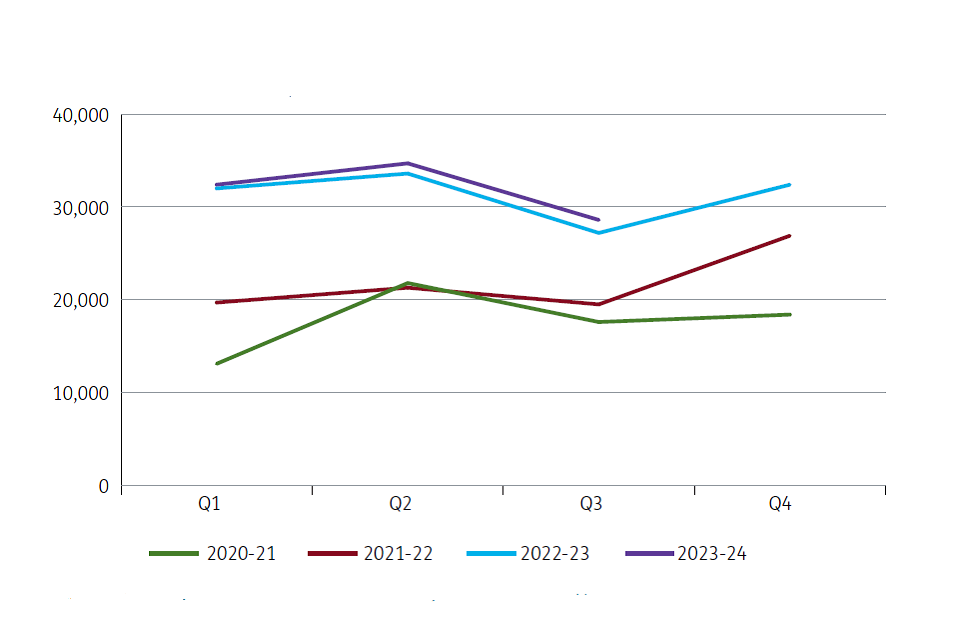
Source: Child Maintenance Service statistics – GOV.UK (www.gov.uk)
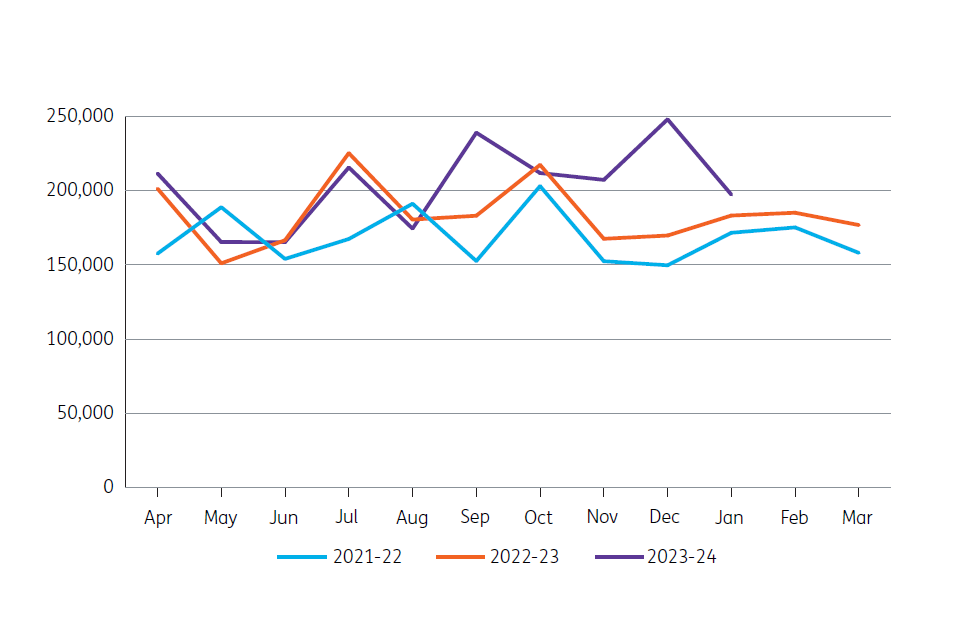
Source: Universal Credit statistics – GOV.UK (www.gov.uk)
To address the workforce supply and service demand gap, DWP has adopted a mix of approaches. Primarily, the Department has sought to increase its workforce throughout 2023 to 2024 through extensive recruitment activity, both internally and externally. DWP has also maximised the capacity of its existing agreement with the Department for Communities in Northern Ireland where it has increased resources by almost 60%, as well as expanding the capacity of the Department’s external delivery partners by up to 50%.
Modernising our services
The Department has continued its work to replace outdated legacy systems with new, digitally-enabled ways of working, supporting productivity improvements and helping to deal with increased demand for DWP services. For example, in State Pension, where the Department sees a large proportion of its new claims, the vast majority of claims are made and processed online by the Get your State Pension (GYSP) service. DWP has made progress over the year with achievements including:
Conversational Platform
An improvement to the Department’s telephony service, Conversational Platform (CP) went live in November 2023 for a small percentage of calls in Universal Credit.
Instead of customers pressing a number on their phone keypad to indicate which option they need, the new voice led solution responds to the words the customer speaks and acts as a virtual agent. CP either provides the information the customer wants or directs them to the right place.
Access to Work
The new online Claim portal went live in June 2023, enabling customers to submit and manage claims, view previous claims and track the balance of their grant(s).
This was followed with a new online Apply journey in October 2023, shortening the customer journey, making better use of data and reducing the need for customers to chase progress.
Maternity Allowance
The Maternity Allowance Modernisation Team developed and introduced a calculator that uses Real Time Information (RTI) earnings data from HMRC. This was introduced in two phases in July and November 2023 following ministerial approval.
The calculator will remove the need for all employed customers to submit copies of wage slips and simplifies a complex entitlement process for circa 60% of Maternity Allowance claims.
Child Maintenance Service
The Child Maintenance Service have developed their online services, so that customers can now start their journey online through Get Help Arranging Child Maintenance and Apply for Child Maintenance which includes the Respond to a Child Maintenance.
Application service. A large proportion of interactions can be done online once the case is up and running through my Child Maintenance Case. In addition, CMS has also improved the use of email and SMS to keep customers informed as well as use of WebChat to support customers using online services.
DWP performance
This section covers the Department’s 2023 to 2024 performance including the processing of new claims, telephony performance, progress in clearing backlogs and improving quality.
New claims processed within planned timescales
In 2023 to 2024, 72.2% of new claims for Universal Credit (UC), Jobseeker’s Allowance (JSA), Employment and Support Allowance (ESA), State Pension (SP), Pension Credit (PC), Disability Living Allowance (DLA), Personal Independence Payment (PIP) and Child Maintenance (CMG) were processed within planned timescales.
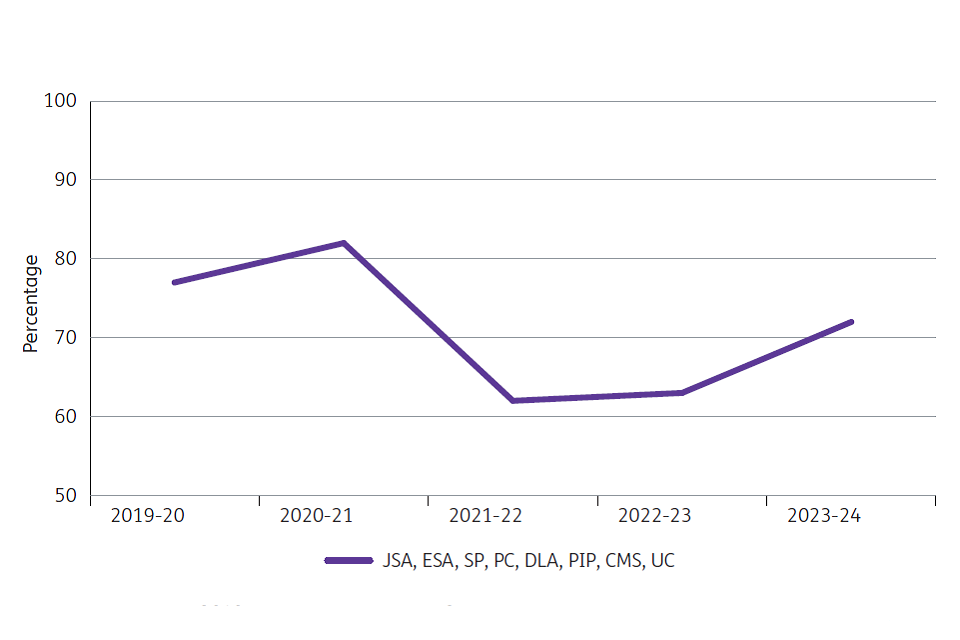
*Data changed from 2019 to 2020 to remove Income Support (IS) and add Universal Credit (UC) alongside new claims for Jobseeker’s Allowance (JSA), Employment and Support Allowance (ESA), State Pension (SP), Pension Credit (PC), Personal Independence Payment (PIP), Disability Living Allowance for Children (DLAc), and Child Maintenance (CMG) and reflects the current view of expected timescales for all products.
Source: internal DWP MI data
A breakdown of performance by service line is provided below.
| Service | 2019 to 2020 | 2020 to 2021 | 2021 to 2022 | 2022 to 2023 | 2023 to 2024 |
|---|---|---|---|---|---|
| Jobseeker’s Allowance | 53.1% | 82.5% | 87.1% | 67.8% | 58.7% |
| Employment and Support Allowance | 96.1% | 70.9% | 42.5% | 47.4% | 39.5% |
| State Pension | 86.7% | 76.2% | 45.6% | 72.0% | 96.2% |
| Pension Credit | 44.8% | 88.2% | 74.3% | 45.7% | 77.7% |
| Disability Living Allowance for children | 91.3% | 92.1% | 35.6% | 4.6% | 3.5% |
| Personal Independence Payment | 40.4% | 23.0% | 6.8% | 38.4% | 51.7% |
| Child Maintenance Service | 91.6% | 84.3% | 84.3% | 79.4% | 79.6% |
| Universal Credit | 85.2% | 90.9% | 85.7% | 84.4% | 83.6% |
| Overall | 76.7% | 82.3% | 61.8% | 62.7% | 72.2% |
The ongoing overall improvement in claims processed within planned timescales has been driven by improvement activities across Operational Delivery, as well as the ongoing impact from the introduction of digital services. This includes service lines such as State Pension, where the majority of new claims are now made online and processed automatically, leading to a significant improvement in new claims processing times. Across UC, timeliness performance has remained broadly stable despite a rising caseload.
Although DWP has seen improvements in processing times across many service lines during 2023 to 2024, continued high demand has meant that the Department’s ability to process claims consistently in a timely manner across all its services has come under considerable pressure, with performance remaining below standard in some areas including in Child DLA where demand has increased in recent years and is significantly higher than pre-pandemic volumes. During 2020 to 2021 DWP deferred reviewing existing cases to focus on processing new claims. Since then, the high volumes of both new claims and the deferred renewal work has resulted in longer processing times. Additional resources have been deployed and cases are being cleared in date order to ensure fair customer service.
ESA processing times are also below standard. New Style ESA was launched in April 2020 and introduced a new way of processing claims which impacted the reporting of performance. As a result, performance was lower in 2020 to 2021 than in 2019 to 2020 and was also affected by decisions made to support customers during the COVID-19 pandemic. Performance in 2023 to 2024 was impacted as resources were pivoted to meet high demand and to support the movement of cases to UC.
As demand is forecast to remain high during 2024 to 2025, the Department’s focus remains on increasing productivity, maximising resources, and continuing its modernisation activity to increase automation and reduce failure demand.
Telephony
Timeliness performance has varied across DWP’s telephony services where the number of calls answered within standards by some areas, such as CMS, has been consistently good throughout the year. Employment and Support Allowance (ESA) has experienced significant resourcing pressures, making it harder to answer all customers’ calls in a time that met their expectations. As the year progressed, actions to recover the position in ESA - including bringing in new recruits, building telephony capability with existing colleagues and rebalancing service lines - began to deliver improvements in performance.
Backlogs in service delivery
Backlogs initially arising as a result of the pandemic followed by cost of living pressures, have been a regular feature over the last few years, leading to longer processing times to deal with customer claims and changes. The Department entered this financial year with a number of existing backlogs. While the Department has worked hard to clear 41% of its backlogs - including many ahead of schedule, such as Attendance Allowance (AA) claims and changes, and CMS and Personal Independence Payment (PIP) Appeals - the continuing high demand the Department has experienced during 2023 to 2024 has seen backlogs re-emerge, primarily in CMS and the Dispute Resolution Service (DRS). New backlogs have also been created, such as in Child Maintenance Enforcement.
Quality
The Department has maintained its focus on continuous improvements as part of its back-to-basics plan. The latest ‘Fraud and Error in the Benefit System’ publication highlights a number of improvements over 2023 to 2024 including:
- The total rate of benefit expenditure underpaid reduced from 0.5% in 2023 to 0.4% in 2024
- The overpayment rate in UC reduced from 12.7% in 2023 to 12.4% in 2024
- The underpayment rate in UC reduced from 0.6% in 2023 to 0.3% in 2024
- The overpayment rate in PIP reduced from 1.1% in 2023 to the lowest level ever recorded, at 0.4% in 2024
As these improvements are not statistically significant, they do not yet confirm that the Department’s plans are making a difference. The Department is aware that further work is required in order to provide a consistent quality service across all service lines. DWP continues to apply organisational learning to build the skills of the Department’s people, challenge policy and develop automated processes, where appropriate. DWP has improvement plans in place across all benefit delivery areas. Examples of improvement activities include:
- bite-sized learning products to build colleagues’ capability and understanding when determining entitlement to additional premiums
- introduction of check lists in Pension Credit to ensure that entitlement to premiums is considered and paid, reducing risk of underpayments
- a multi-disciplinary team to build understanding of the criticality of good quality claimant commitments, ensuring that work and health customers receive the right support to move into work
- operational business areas have their own improvement plans to ensure there is a clear focus and commitment on improving performance. These are closely tracked by the Quality Senior Steering Group and the Quality Governance Board. This will help to consolidate plans and progress, share best practice and highlight emerging blockers to support ongoing improvements.
Customer satisfaction and feedback
Customer satisfaction has remained relatively stable. However, customer complaints have risen. This section sets out the Department’s performance in handling complaints, and complaints escalated to the Independent Case Examiner and the Parliamentary and Health Service Ombudsman.
The latest Customer Experience Survey measures the percentage of customers who were either fairly or very satisfied with the overall service they received across UC, PIP, ESA, Disability Living Allowance for children, Attendance Allowance, Carer’s Allowance, State Pension and Pension Credit. It showed an increase of two percentage points in 2023 to 2024, with a score of 85% for the first three quarters of the year (April to December 2023). Although this is not a statistically significant change, it means that overall satisfaction has reached DWP’s “Good” customer satisfaction performance benchmark of 85%.
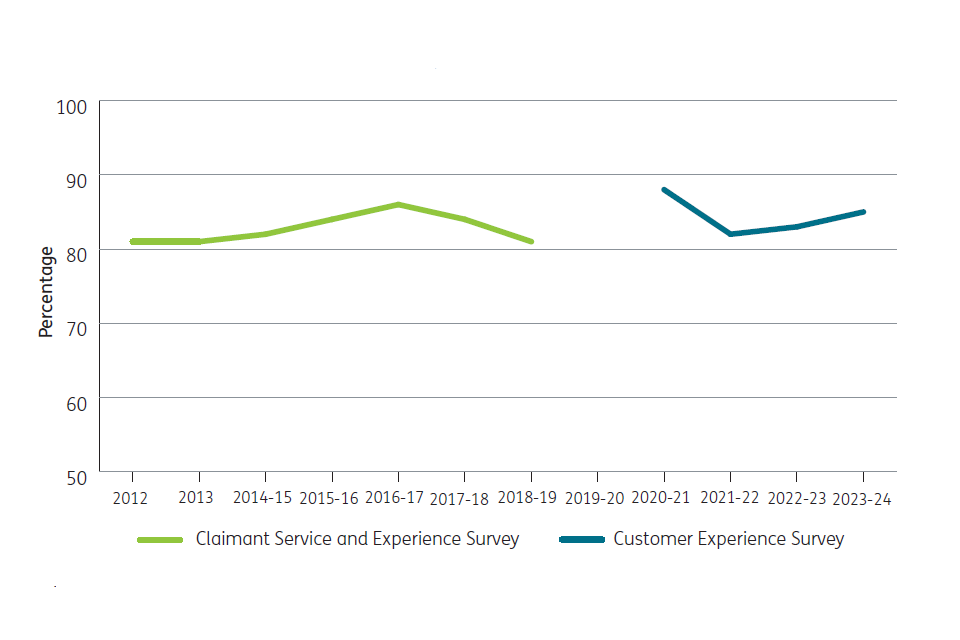
This graph shows annual data for all years except 2023 to 2024, where data for the full year is not yet available. The 2023 to 2024 score is based on the first three quarters of the year only (April to December 2023).
Satisfaction between benefit lines varies, with higher scores among Retirement Service (RS) benefits and lower scores from PIP and ESA customers. This reflects specific challenges where these areas continue to deal with increased demand and clearance of existing backlogs.
Customer complaints
DWP has seen a 7% rise in complaints during 2023 to 2024 compared to 2022 to 2023, although this increase remains low against a backdrop of rising demand for the Department’s frontline services.
In DWP’s commitment to increased transparency, it has updated its complaints publication to include a breakdown of complaints by product on service
Below, is the number of complaints every quarter to the end of 2023 to 2024, for each of DWP’s business areas, including CMS which is included in the CMS quarterly Official Statistics
| Quarter | Retirement Services | Universal Credit (UC) | Working Age (excluding UC) | Disability Services | Child Maintenance Service | Counter Fraud, Compliance and Debt |
|---|---|---|---|---|---|---|
| Apr to Jun 2021 | 405 | 1165 | 395 | 510 | 1710 | 265 |
| Jul to Sep 2021 | 945 | 1395 | 430 | 710 | 1545 | 305 |
| Oct to Dec 2021 | 960 | 1505 | 425 | 760 | 1505 | 335 |
| Jan to Mar 2022 | 760 | 1560 | 295 | 710 | 1570 | 450 |
| Apr to Jun 2022 | 950 | 1575 | 175 | 585 | 1455 | 270 |
| Jul to Sep 2022 | 1190 | 1735 | 220 | 525 | 1450 | 280 |
| Oct to Dec 2022 | 1115 | 1955 | 235 | 570 | 1380 | 230 |
| Jan to Mar 2023 | 1330 | 2050 | 390 | 650 | 1420 | 320 |
| Apr to Jun 2023 | 1340 | 2000 | 340 | 830 | 1285 | 320 |
| Jul to Sep 2023 | 1055 | 1845 | 385 | 780 | 1385 | 325 |
| Oct to Dec 2023 | 925 | 2085 | 260 | 695 | 1260 | 340 |
| Jan to Mar 2024 | 1045 | 2250 | 270 | 845 | 1435 | 380 |
*DWP introduced a single tier complaints service on 9 July 2020. Any complaints received or closed prior to this date were handled under its previous two-tier complaints process. Historical complaints data has been revised back to 2021 to 2022 to account for retrospection, where additional or updated information has been incorporated. Figures prior to 2021 to 2022 are not comparable as in 2020 the Department moved to recording complaints under the single tier complaints service.
During 2023 to 2024, DWP has focused on improving customer experience, using insight from complaints to improve its services.
The Department implemented a quality framework to improve the handling of complaints into its service delivery areas and wider complaint teams throughout 2023. The framework aligns closely to Cross Government Complaints Standards published by the Parliamentary and Health Service Ombudsman (PHSO) in October 2022, and has provided DWP with the opportunity to create a consistent quality focus across its entire complaints service.
Learning from complaints is an integral part of what the Department does every day. In 2023 DWP strengthened its processes by sharing detailed insight with senior leaders and service delivery teams across the Department, enabling it to make improvements to processes, guidance and services, and improving customer experience.
Independent Case Examiner
Customers who have completed DWP’s complaint process and remain dissatisfied can ask the Independent Case Examiner (ICE) to investigate their complaint. In 2023 to 2024, ICE received 5,634 complaints and cleared 2,533. ICE continued to experience high intake volumes, and cleared 51% more DWP complaints in 2023 to 2024 than the previous year.
| Complaints about DWP[footnote 10] | 2021 to 2022 | 2022 to 2023 | 2023 to 2024 |
|---|---|---|---|
| Received by ICE | 4,740 | 4,732 | 5,634 |
| Accepted for examination by ICE | 1,642 | 1,630 | 1,756 |
| Cleared by ICE | 1,195[footnote 11] | 1,683 | 2,533 |
| ICE partially/fully upheld | 578 | 578 | 754 |
| PHSO partially/fully upheld DWP complaints | 0 | 0 | 0 |
In 2023 to 2024, ICE cleared 2,533 DWP complaints. Of these:
- 62 were withdrawn by the complainant
- 1,031 were resolved or settled with the complainant’s agreement
- 754 were upheld, fully or partially, by the ICE
- 685 were not upheld by the ICE
- 1 case where the ICE was unable to reach a finding
ICE also investigates complaints relating to DWP contracted providers, the Department for Communities, and the Child Maintenance Service – Northern Ireland.
| All complaints including DWP, contracted providers, NISSA and NI CMS | 2021 to 2022 | 2022 to 2023 | 2023 to 2024 |
|---|---|---|---|
| Received by ICE | 4,916 | 4,911 | 5,824 |
| Accepted for examination by ICE | 1,709 | 1,711 | 1,861 |
| Cleared by ICE | 1,407 | 1,783 | 2,658 |
| ICE partially/fully upheld | 602 | 584 | 765 |
| PHSO partially/fully upheld all complaints | 0 | 0 | 0 |
In addition to investigating case-specific complaints of maladministration, ICE also identifies wider Service Improvement Observations (SIOs) which, if addressed, will limit the scope for future service failures and improve the service provided to customers. In 2023 to 2024 ICE highlighted 12 SIOs to DWP.
For example, ICE recently highlighted a gap in DWP’s Debt Management processes, where an inability to prevent system-generated letters from being automatically sent meant that customers who requested contact by phone (because of an accessibility need or additional support need) were receiving letters in error. When alerted to the issue, the Department quickly updated its digital systems and guidance to stop this happening again. DWP’s fast action and a collaborative approach ensured that customers with vulnerabilities or accessibility needs received contact from the Department in the format they required.
Complaints investigated by the Parliamentary and Health Service Ombudsman (PHSO)
If customers remain dissatisfied with the outcome of ICE’s intervention, they may pursue their case with the PHSO. The PHSO publishes its figures a year behind other data, but in recent years the number of upheld complaints has been very low in comparison with ICE investigation findings.
| Complaints Investigated by the PHSO | 2021 to 2022 | 2022 to 2023 |
|---|---|---|
| Number of complaints investigated | 14 | 21 |
| Number not upheld | 3 | 10 |
| Number partly upheld | 7 | 7 |
| Number upheld | 2 | 4 |
| Number other outcomes | 2 | 0 |
| % not upheld | 22% | 48% |
| % partly upheld | 50% | 33% |
| % upheld | 14% | 19% |
| % other outcomes | 14% | 0% |
*Due to PHSO publication dates the 2023 to 2024 data is not available for inclusion.
Complaints to the Parliamentary Ombudsman in 2022 to 2023
| Organisation | Complaints Received | Complaints Resolved by mediation | Decided following primary investigation. (This figure does not include complaints resolved by mediation) | Resolved with agreement of the complainant at Initial checks or Primary Investigation (This figure does not include complaints resolved by mediation) | Complaints accepted for Detailed Investigation |
|---|---|---|---|---|---|
| Total DWP[footnote 12] | 1235 | 0 | 189 | 6 | 21 |
Complaints about State Pension age changes
The PHSO investigated six sample complaints around maladministration in the Department’s communication of State Pension changes affecting 1950s-born women. The Ombudsman’s investigation concluded in March 2024, and details of the investigation can be found on the Ombudsman’s website.
The PHSO found that maladministration in communication of State Pension age resulted in the sample complainants losing some opportunities to make informed decisions or do certain things differently and that diminished their sense of personal autonomy and financial control. The PHSO did not find it resulted in them suffering direct financial loss but suggested redress between £1,000 and £2,950 for the impacts identified.
The PHSO has laid its report before Parliament, bringing the matter of redress to the attention of the House. The Department is giving the report full and proper consideration and will update DWP’s ‘Complaints Procedures’ website on GOV.UK when there is further information to share.
Customer redress
In 2023 to 2024, DWP made 10,567 ex-gratia payments totalling £1.3 million[footnote 13] (£1.2 million in 2022 to 2023) for maladministration[footnote 14].
Ministerial Correspondence
The Ministerial Correspondence Team (MCT) is responsible for drafting responses from ministers to policy-related correspondence from elected officials and members of the public. Not all correspondence received by MCT will require a response.
As last year, the majority of correspondence related to cost of living and the timeline and value of Cost of Living Payments. The Department has also received correspondence on benefits and pensions uprating, child maintenance calculations, debt recovery, pensions, the Triple Lock and fraud.
Over the course of the year, DWP received correspondence related to campaigns on the Work Capability Assessment consultation, increasing the rate of Local Housing Allowance, as well as campaigns from Organise, Trussell Trust, the MS Society and Royal British Legion.
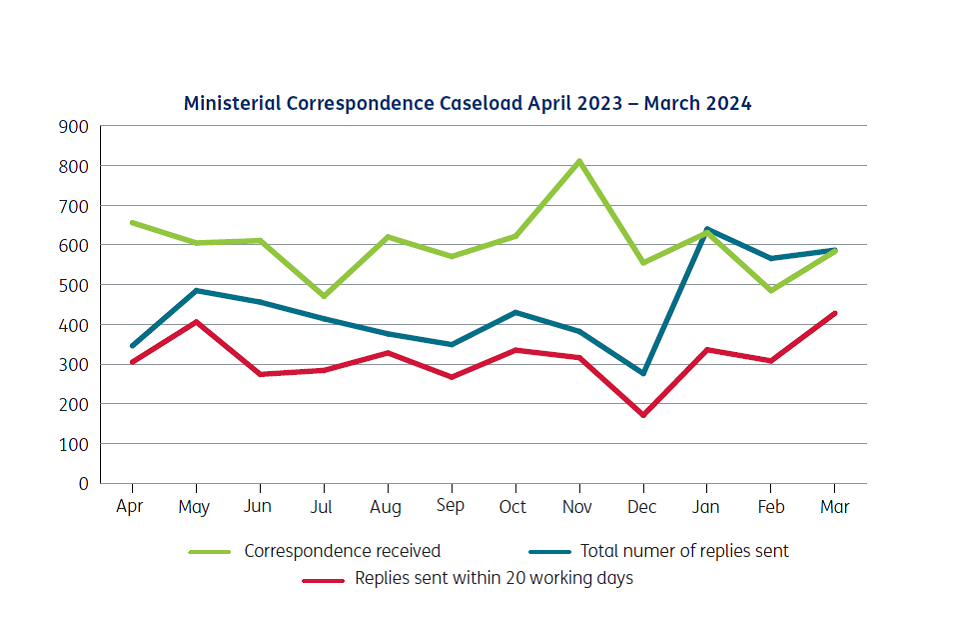
December 2023 saw a dip in replies sent within 20 working days. This was in response to ministerial changes in the Department and its response rate has since increased again.
Real Time Information Disputes
Real Time Information (RTI) is the HM Revenue and Customs database that holds Pay As You Earn information. RTI information for UC claimants who are in employment is sent to DWP and held in the Real Time Earnings database.
RTI is supplied by employers. The calculation of a claimant’s earned income for an assessment period is therefore based on the actual dates and amounts reported by the employer. RTI is an efficient and accurate method of calculating UC payments. The table below shows the RTI disputes data for 2023 to 2024.
Financial year 2023 to 2024 (1 April 2023 to 31 March 2024)
| Real Time Information | Totals |
|---|---|
| Earnings retrieved from RTI[footnote 15] | 78,200,000 |
| RTI disputes raised[footnote 16] | 371,000 |
| RTI disputes raised as a proportion of RTI earnings retrieved | 0.5% |
| RTI disputes processed[footnote 17] | 329,000 |
| RTI disputes processed and dispute upheld by agent | 65,600 |
| RTI disputes processed and dispute not upheld by agent | 190,200 |
| RTI disputes processed and dispute outcome unknown[footnote 18] | 73,400 |
| RTI disputes processed and known to be upheld as a proportion of Total RTI earnings retrieved | 0.08% |
| RTI disputes processed with dispute outcome unknown as a proportion of Total RTI earnings retrieved[footnote 18] | 0.09% |
Human rights
DWP strives to ensure that decisions it makes regarding individuals who use its services are compliant with the UK’s obligations under the European Convention on Human Rights. DWP supports the implementation across its remit of the UN Convention on the Rights of Persons with Disabilities and works across government to implement and deliver it.
The Department’s policies on welfare reform and pensions impact a significant percentage of the UK population. DWP works hard to understand the impact of proposed changes to existing policies and new policies that it intends to introduce, to ensure that final policies are proportionate and have minimised the risk of unintended consequences. One way that the Department does this is by consulting members of the public, trade bodies and other interested parties through its public consultation process prior to introducing or amending existing policies. Feedback received through DWP’s public consultation process is taken into consideration ahead of making final policy decisions.
During 2023 to 2024 DWP ran public consultations providing members of the public and other interested parties a chance to share their views on the likely impact of proposed changes, including impacts on protected groups and vulnerable individuals. In addition, departmental lawyers give close consideration to questions of whether any potential infringements of Human Rights are legally justified. An example is the consideration given to the compatibility of the Data Protection and Digital Information Bill with Convention rights such as the right to private and family life. The lawyers also regularly consider the merits of human rights challenges to DWP policies and decisions in litigation cases.
Prior to introducing policy changes the Department conducts equality impact assessments to test whether its proposed approach is proportionate. Equality impact assessments aim to understand the effect that policies, services and procedures have on people from protected groups.
Through the UK judicial review system individuals and affected organisations can examine the legality of departmental decisions.
On the 22 May 2024, the Equality and Human Rights Commission (EHRC) launched an investigation into whether the department has failed to make reasonable adjustments in the health assessment journey for certain benefits, in particular, for disabled customers with mental impairments. They will also consider if, in developing and implementing related policy guidance, the department complied with the Public Sector Equality Duty. The Department is cooperating with the investigation and will fully consider the EHRC’s report when it is published. The investigation remains confidential.
Improving customers’ experiences
This section sets out what the Department has done to improve the experience of its customers when accessing DWP services. It includes how DWP is improving accessibility and the support it provides to vulnerable customers, as well as how it continues to apply learning from Internal Process Reviews and Serious Case Panel to make further improvements to the customer experience.
Introduction
DWP’s ambition is to ensure it is supporting all of its customers; the Department’s operational colleagues are trained to support vulnerable customers with advanced customer support and specialist help for the most complex cases. DWP aims to learn from experience, becoming a learning organisation by utilising insight from its customers’ experience as shown below.
Learning from experience
We use insight to improve what we do and this informs design and delivery
Advanced Customer Support
Specialist help is also available if and when it is needed by customers
DWP Frontline Operations
All DWP collegues are trained to help support the most vulnerable customers
In 2023 to 2024 the Department has:
- created a new team to lead on accessibility across DWP to provide assurance, share good practice and identify where it can make improvements
- published the Additional Support for DWP Customers document that pulls into one place the important work of the Department in responding to customers’ additional needs
- aligned the central Quality Assurance team into Customer Experience Directorate, to improve the understanding of how errors made impact customers
- started to build a Customer Journey Mapping function to help colleagues understand how customers experience DWP’s current services and identify opportunities for improvements
- started testing the use of Artificial Intelligence to identify customers requiring additional help through their written correspondence to the Department, cutting down the time to identify these customers from weeks to a day.
Customer accessibility
The Department is committed to providing inclusive and accessible services. Learning lessons from a Judicial Review in 2023, DWP is developing an Accessibility Assurance Framework which will place equality and accessibility at the heart of customer journeys by setting clear accessibility standards and mechanisms for monitoring and identifying improvements. In addition, the Department has implemented several improvements across its services: It relaunched an internal Customer Accessibility Hub in September 2023. This brings together training, toolkits, and information on disabilities and how to support DWP’s customers in one place.
Since January 2024, Personal Independence Payment (PIP) customers who require email as a reasonable adjustment can access some letters via the GOV.UK Notify online portal. 398 letters have been downloaded through this route in the first 2 months.
The Department also has in place a wide range of reasonable adjustments for customers, including alternative formats to ensure the information is presented in an accessible way. Over the last year several refinements have been made to internal guidance and processes to improve delivery of alternative format provision particularly for PIP and Employment and Support Allowance. These include:
- increased end to end handling within dedicated teams to improve timeliness and reduce handoffs
- improved guidance on Optical Character Recognition (OCR) conversion and enhanced quality checks for accuracy
Supporting DWP’s most vulnerable customers
Through the national DWP Visiting Service the Department provides additional face-to-face support across all service lines to customers who cannot access DWP services in any other way. A visit can be arranged for a customer if they need extra help to claim benefits, for example because they have complex needs, are disabled, are a vulnerable young person making a claim for the first time, have nobody else to support them or cannot claim benefits in any other way.
Across 2023 to 2024, DWP Visiting Service received 189,054 referrals. The table below shows the number of referrals made in each month across 2023 to 2024.
| Apr 2023 | May 2023 | Jun 2023 | Jul 2023 | Aug 2023 | Sep 2023 | Oct 2023 | Nov 2023 | Dec 2023 | Jan 2024 | Feb 2024 | Mar 2024 | |
|---|---|---|---|---|---|---|---|---|---|---|---|---|
| Visiting Referrals Received – Internal | 10,576 | 11,912 | 12,407 | 12,578 | 15,892 | 13,379 | 14,559 | 15,436 | 10,912 | 15,559 | 15,253 | 15,416 |
| Visiting Referrals Received – External | 1,806 | 2,269 | 2,239 | 2,171 | 2,398 | 2,317 | 2,230 | 2,247 | 1,514 | 1,994 | 2,091 | 1,899 |
| Total | 12,382 | 14,181 | 14,646 | 14,749 | 18,290 | 15,696 | 16,789 | 17,683 | 12,426 | 17,553 | 17,344 | 17,315 |
Note: External sources include, charitable organisations, NHS and local authorities registered as DWP trusted Partners
The Department provides another layer of additional support through national network of Advanced Customer Support Senior Leaders (ACSSLs), who, with their teams coach and engage colleagues across DWP services to help support the most vulnerable customers.
The network of ACSSLs is assisted by a dedicated delivery team who provide direct support to the ACSSL Community. ACSSLs also line manage the Visiting Officers within their geographic area, enabling the Department to deliver effective support at a local level.
Across 2023 to 2024, ACSSLs and their support teams assisted 10,830 customer cases. The table below shows the number of referrals made to ACSSLs in each month across 2023 to 2024 and whether these referrals were made internally (by DWP colleagues) or externally (from agencies and organisations such as local authorities, Social Services, etc).
| Apr 2023 | May 2023 | Jun 2023 | Jul 2023 | Aug 2023 | Sep 2023 | Oct 2023 | Nov 2023 | Dec 2023 | Jan 2024 | Feb 2024 | Mar 2024 | |
|---|---|---|---|---|---|---|---|---|---|---|---|---|
| ACSSL Referrals Received | 788 | 862 | 961 | 994 | 865 | 765 | 889 | 981 | 789 | 1,051 | 967 | 918 |
| Of which from External Sources such as, local authority, Social Services, etc. | 18 | 322 | 407 | 388 | 379 | 362 | 392 | 452 | 346 | 439 | 333 | 341 |
Internal Process Reviews
Internal Process Reviews (IPRs) are an opportunity for the Department to understand customers’ experiences and to ensure DWP’s people have followed the correct processes. Where this is not the case, they seek to understand why, to inform future learning activity to improve services.
IPRs do not look to investigate a customer’s death, the responsibility for investigating and concluding the cause of death of citizens sits with doctors or sometimes coroners, and DWP has an established channel for coroners to liaise with the Department if required.
An IPR will be conducted in all cases where:
- there is a suggestion or allegation that the Department’s actions or omissions may have negatively contributed to the customer’s circumstances, AND a customer has suffered serious harm, has died (including by suicide), or where it has reason to believe there has been an attempted suicide.
Or
- the Department is asked to participate in a Safeguarding Adults Review (SAR), a Significant Case Review (SCR, Scotland only), a Domestic Homicide Review (DHR), or is named as an Interested Party at an Inquest. An IPR will be conducted regardless of whether there is an allegation against the Department.
IPRs can only be referred internally, but colleagues with external interactions (such as ACSSLs and complaints teams) act on information received from outside the Department, for example from MPs, Local Authorities, and customers’ families.
Any colleague within DWP can refer a case to be considered for an IPR, and these will be conducted in all cases where the criteria is met.
Across 2023 to 2024, 75 IPR referrals were received, of which 53 met the criteria and were accepted for an IPR. The table below shows the number of IPR referrals made in each month across 2023 to 2024 and whether these referrals met the criteria.
| Apr 2023 | May 2023 | Jun 2023 | Jul 2023 | Aug 2023 | Sep 2023 | Oct 2023 | Nov 2023 | Dec 2023 | Jan 2024 | Feb 2024 | Mar 2024 | |
|---|---|---|---|---|---|---|---|---|---|---|---|---|
| IPRs received in month | 6 | 12 | 7 | 5 | 4 | 6 | 11 | 4 | 5 | 2 | 5 | 8 |
| IPRs meeting criteria in month | 2 | 9 | 6 | 4 | 3 | 2 | 8 | 3 | 4 | 1 | 3 | 8 |
Where a case referred for an IPR does not meet the criteria, there is a process in place to encourage learning, to raise awareness, improve clarity and the effectiveness of existing and new processes and guidance. Where the criteria are not met, DWP offers support to the referrer to learn from the case, including signposting to other available routes to share the learning they may have identified, for example via an ACSSL.
IPRs may be carried out where either a customer has died or where there has been customer harm. The table below shows the number of IPRs referrals accepted in each of the last 12 months and whether these have been recorded as customer death or customer harm.
| IPR Accepted | Apr 2023 | May 2023 | Jun 2023 | Jul 2023 | Aug 2023 | Sep 2023 | Oct 2023 | Nov 2023 | Dec 2023 | Jan 2024 | Feb 2024 | Mar 2024 |
|---|---|---|---|---|---|---|---|---|---|---|---|---|
| Customer Death | 2 | 7 | 3 | 4 | 3 | 1 | 5 | 2 | 4 | 0 | 3 | 6 |
| Customer Harm | 0 | 2 | 3 | 0 | 0 | 1 | 3 | 1 | 0 | 1 | 0 | 2 |
Cases received for IPRs can cover more than one DWP service line as customers may have more than one benefit in payment, meaning the customer can have more than one primary service line recorded for the IPR. Additional information is published separately.
Accepted IPRs by Primary Service Line 2023 to 2024
Alongside reporting on the number of cases referred and accepted for an IPR in 2023 to 2024, DWP also report the number of IPRs where the review has been completed.
Across 2023 to 2024 there were 87 IPRs completed. This differs from the number of IPRs accepted (53) due to the time required to review the case. There were 162 key findings identified from the IPRs completed, with each of these key findings being discussed with the relevant service line(s). These discussions started the process of improvement activity through collaboration across DWP. These improvements included strengthening processes, tools and guidance within individual service lines or cross-cutting changes across DWP services.
Key findings from IPRs are routinely shared to support the development of large programmes of work such as the Health Transformation Programme. In addition to learning from the individual IPR cases, these key findings also provide insight and evidence to develop themes that are taken forward through appropriate governance channels, including DWP’s Serious Case Panel.
Serious Case Panel
The Serious Case Panel (The Panel), set up in 2019, meets quarterly to consider themes and issues that have arisen across the Department’s service lines, to agree changes and improvements. In line with the Terms of Reference (reviewed in January 2024) it does not investigate individual cases but considers themes arising from a range of sources, including IPRs, frontline feedback and Independent Case Examiner reports.
The Panel is made up of the Department’s most senior leaders, including the Permanent Secretary and all Directors-General. It is chaired by a non-executive Director, includes the Independent Case Examiner, and the Department’s Chief Medical Advisor who joined the panel in 2023.
Action currently being taken on themes that have been discussed at Serious Case Panel include:
- the roll-out of Mental Health Awareness training with 63,478 colleagues trained by 31 March 2024 and with all colleagues receiving the training by March 2025. The training includes modules on appropriate actions to take to support customers with vulnerabilities including mental health issues and covers support for colleagues when they are interacting with a customer who is at risk of harm.
- improving the experience of customers who use the Payment Exception Service. Guidance for colleagues has been strengthened and improved across the Department. This campaign to raise colleague awareness enables them to better support customers and move them into banking where this is appropriate.
- improving how DWP communicates with customers who have been overpaid, ensuring the department takes vulnerability into consideration at every opportunity.
- enhancing the Department’s quality assurances for vulnerable customers with complex needs through a clear set of DWP Advanced Customer Support Standards. This data helps the Department understand the quality of support it is providing for its most vulnerable customers. This insight will help to inform organisational learning and build the capability of DWP colleagues.
Devolved Administrations
DWP continues to work closely with all three devolved administrations. At ministerial level, bilateral Interministerial Groups (IMGs) have been established with the Welsh Government (the inaugural meeting was held in November 2023) and agreed with the Scottish Government. The Department is in discussion with the Department for Communities in Northern Ireland in light of the re-establishment of a functioning Assembly and Executive. These IMGs provide a forum for ministers to discuss matters of mutual interest in relation to the Department’s portfolio, as part of the three-tier structure of intergovernmental relations introduced in January 2022.
Scotland
The Scotland Act 2016 devolved significant social security powers and additional employment support powers to the Scottish Parliament. DWP continues to provide extensive support to the Scottish Government in implementing these devolved powers, notably through a dedicated Scottish Devolution Programme for changes in social security, and through interactions between Jobcentre Plus and devolved employment support provision.
DWP continued to deliver Attendance Allowance, Carer’s Allowance, Disability Living Allowance, Industrial Injuries Disablement Benefit and Personal Independence Payment on behalf of Scottish ministers under Agency Agreements while the Scottish Government builds its capacity to deliver replacements for them. It has also maintained Severe Disablement Allowance cases under an Agency Agreement.
In summer 2023, DWP completed the case transfer for existing recipients of Disability Living Allowance for children (DLAc) in Scotland to Social Security Scotland. In July 2023, regulations and operational processes were put in place to support cross-border moves for those in receipt of DLAc, to minimise potential disruption to payments where a claimant changes permanent address and moves from England or Wales to Scotland.
In November 2023, the Scottish Government launched Carer Support Payment to replace Carer’s Allowance, starting with new claims in three local authority areas. The case transfer for 120,000 existing Carer’s Allowance recipients in Scotland to Social Security Scotland began in February 2024.
The case transfer for existing Personal Independence Payment recipients in Scotland is also well underway, with 164,000 (of 325,000) cases transferred to Social Security Scotland by spring 2024.
Northern Ireland
All matters covered by the Department are transferred in Northern Ireland. DWP continues to work closely with the Department for Communities (DfC) there in view of the parity principle between the pensions, social security and child maintenance systems. DWP legislated for and paid Cost of Living Payments to people in receipt of means-tested and additional-needs disability benefits in Northern Ireland, at the request of the DfC Permanent Secretary, given the lack of a functioning Northern Ireland Assembly at the time. This ensured that people in Northern Ireland received these payments at the same time as those in the rest of the United Kingdom.
Wales
Most matters covered by the Department are reserved in Wales, but related areas such as skills, training, health, education, childcare, and social care are devolved. DWP works closely with the Welsh Government to ensure devolved and reserved provision work effectively together. For example, the Department and the Welsh Government have worked extensively together on youth employment and skills, ensuring that both governments’ strategies align on supporting young people with workplace skills.
Delivery Objective: Enabling the delivery of our services
Introduction
Enabling functions support delivery of the Strategic Outcomes by building DWP’s capacity and capability, including its workforce, estate, and digital. The strategic enablers also supported DWP in contributing to the Declaration on Government Reform, which sets out how the Civil Service and ministers will reform government to deliver better outcomes for citizens.
Workforce and skills
DWP has filled approximately 20,000 vacancies across operations and corporate functions in the Department, generating growth of around 6,000 full-time equivalent (FTE) to deliver Labour Market plans and bolster resources in Universal Credit Case Review and Counter Fraud Compliance and Debt. The Department’s permanent turnover rates have continued to reduce, and were 7.3% for 2023 to 2024.
Launch of 675 recruitment campaigns for 1,668 roles across Corporate Functions with a further 19,600 offers in Service Delivery.
Digital recruitment hires increased by 26%, success rates increased to 64%, candidate withdrawals down to 1.3% and external hires increased to 47%.
The Department has focused on the design and delivery of a DWP employer brand in 2023 to 2024, including guidance to support candidate attraction across DWP, and shared new content on DWP’s locations, sustainability, and professions. DWP has created alternative recruitment entry routes into the Department, such as internships and the care leaver’s scheme. The Department also tailored support in onboarding to support a flexible and diverse workforce and to give people with otherwise more limited life chances the opportunity to secure work.
DWP’s Disability Confident Leader status has been re-validated, along with renewed Visibly Confident employer status with Royal National Institute of Blind People (RNIB) which demonstrates to colleagues and future potential colleagues DWP’s commitment to being an inclusive employer.
DWP has used existing employees to showcase available careers, and the Departments recruitment is geared towards a wide candidate pool to increase knowledge and talent. The Department has worked to employ the most vulnerable in society via Direct Temporary Recruitment (DTR), a scheme offering opportunities to people on the Universal Credit Jobseeker’s register. This enables DWP to tap into a new talent pool of people that would not ordinarily have applied for roles in the Civil Service.
Following the launch of DWP’s Apprenticeship strategy in April 2023, the Department has consistently achieved against the Civil Service-wide measures for ‘Levelling Up’ and ‘Diversity and Inclusion’. At least 39% of the Department’s apprentices come from a lower socio-economic background and study across the UK. Additionally, DWP has a Social Mobility Apprenticeship programme, which has contributed to DWP as a whole achieving a Top 10 ranking on the Social Mobility Index for 2023.
DWP continues to be recognised within the top 1% of apprenticeship employers achieving 9th in the Top 100 Apprenticeship Employers ranking for 2023.
In September 2023, the Department welcomed its first school leavers onto its Social Mobility Apprenticeships programme.
The Life Chances Team has brought together Going Forward into Employment schemes (prison leavers, veterans, veteran spouses, care leavers, carers and homelessness) and Youth Employability Programmes (Movement to Work and Diversity Internship Programmes, including Care Leavers, Summer Internships, Autism Exchange, Early Diversity and Supported Internships). The Department has used Movement to Work placements to support as many young people as possible on their journey to find employment.
From January to December 2023, 1921 young people started a Movement to Workplace placement within DWP, with 37 districts participating – this exceeded DWP’s annual target by 75%.
In 2023 DWP supported 24 Autism Exchange Interns, an increase of 66% from the previous year.
Over the 2023 financial year, DWP recruited 22 candidates through Going Forward into Employment schemes; this consisted of 15 prison leavers, 4 care leavers and 3 carers.
Developing DWP’s leadership and people
There has been an increase in DWP teams taking up Leadership Essentials learning as part of their leadership development activity. Over 8,000 colleagues have attended at least one leadership webinar from DWP’s comprehensive offer, and the Department has made more than 480 face-to-face or virtual sessions available. DWP has delivered Leadership Foundations learning across 55 virtual sessions to over 2,200 colleagues.
This year DWP has further developed its learning offer to build colleagues’ digital confidence and capability, embed sustainability and encourage social and self-directed learning. This was supported by a national network of 901 Digital Workplace Champions.
DWP’s short bite-sized learning videos and recorded sessions have been accessed over 77,000 times
DWP took a leading role in the implementation of One Big Thing 2023, a Civil Service-wide learning initiative focused on data. DWP influenced the design and roll-out of the learning, and saw the highest engagement levels across government. As a result, 50,000 colleagues now better understand the importance of data, and how the Department uses it to make informed decisions, modernise and adapt its services, achieve efficiencies, and deliver excellent digital services.
DWP’s technical learning, especially learning for work coaches and case review officers, has supported ministerial priorities set out in the Spring Budget and the Autumn Budget. To meet this activity, the Department onboarded and upskilled over 100 new learning professionals, ensuring that large numbers of new entrants to DWP, particularly work coaches and case managers, received effective learning to start them on their careers and provide vital welfare service to UK citizens.
For the year to 31 March 2024, DWP delivered 289,904 facilitated delegate days of technical learning.
Anti-bribery and corruption
DWP has a zero-tolerance approach to fraud, bribery, and corruption. The Department ensures there are structures in place, as well as readily accessible policies and commercial agreements with suppliers and providers to detect and respond to the threat of fraud.
The Department promotes a counter fraud culture via fraud, error, and debt learning at induction and mandatory annual learning for all colleagues, ongoing fraud awareness activities and annual themed learning events. All colleagues must also complete the annual DWP Security and Data Protection learning.
Working with other agencies and learning from fraud, bribery, and corruption are key elements of DWP’s counter fraud response. The Government Internal Audit Agency (GIAA) provides specialist counter fraud services to DWP, which include the investigation, and where appropriate, support with fraud, bribery, and corruption prosecutions. GIAA also assists DWP with continuously improving its counter fraud response, including regular senior leader engagement and collaboration with internal stakeholders to understand the Department’s exposure to fraud, bribery, and corruption and ensure an effective response is implemented. For more information, see the Fraud, Error and Debt Report.
Location
DWP employs 16% of the Civil Service (as of December 2023) and makes up 20% of the government’s civil estate. In 2023 to 2024 DWP has continued to support the Government Property Strategy to deliver a smaller, better, greener estate. The Department has moved out of poorer quality buildings and invested in improving those it keeps, moving us closer to DWP’s ambition of making its offices a great place for people to work, and in the case of jobcentres, a better environment for customers to visit.
In 2023 to 2024 the Department has:
- exited a further seven of its back-office buildings (where DWP provided virtual services and did not need to see customers face-to-face). The Department used lease breaks to exit poorer quality buildings and remove underused space, delivering value for taxpayers by only paying for the space it needs. DWP has retained, retrained, or redeployed the 2,850 people affected by these changes to the back-office estate.
- exited a further four jobcentres, taking advantage of lease breaks to move to better premises
- continued work to return the jobcentre network to its pre-pandemic size by decommissioning the temporary jobcentres. In 2023 to 2024 104 sites have been closed to the public, with 58 having been handed back to the landlord.
- continued to make improvements at sites that have been retained. In 2023 to 2024 the Department has made improvements at 43 sites, creating better environments for DWP’s customers and colleagues. DWP has also decommissioned underused space at 10 of its back-office buildings.
Workplace Transformation and essential works
Once the Department has exited a site, a process begins where they are handed back to landlords and lease arrangements and legal commitments to the site cease (with the exception of dilapidations, which may be resolved at a significantly later date). The timeframe for each site to go through this process will be based on the individual lease arrangements, meaning that in some circumstances DWP retain sites which are vacant for a period. The table below shows the number of sites where DWP has a live legal interest. There is not always an alignment between people and services exit numbers and lease numbers as DWP has a very mixed-use estate, whereby multiple business areas can be present in the same or combination of sites.
Status at end of Fiscal (March in each year)
| Type of building | 2019 | 2020 | 2021 | 2022 | 2023 | 2024 |
|---|---|---|---|---|---|---|
| Hub[footnote 19] | 7 | 7 | 7 | 10 | 10 | 10 |
| Back-office | 83 | 78 | 76 | 73 | 52 | 48 |
| Back-office site with Jobcentre colleagues also represented | 43 | 43 | 43 | 45 | 43 | 29 |
| Jobcentre | 606 | 608 | 603 | 605 | 597 | 616 |
| Temporary Jobcentre | – | – | 29 | 178 | 176 | 106 |
| Assessment Centre | 50 | 52 | 49 | 51 | 54 | 55 |
| Nino Hub | 2 | 2 | 2 | 2 | 1 | 1 |
| Other | 13 | 13 | 12 | 15 | 14 | 14 |
| Vacant | 3 | 4 | 4 | 3 | 2 | 2 |
| Total | 807 | 807 | 825 | 982 | 949 | 881 |
Through the Workplace Transformation Programme (WTP), net cashflow savings of an estimated £37.9 million have been delivered in 2023 to 2024, with further net cashflow savings of £38.8 million forecast in 2024 to 2025. Net cashflow savings are based on the latest version of the Programme Business Case.
For more information on Workplace Transformation, see the Sustainability Report.
Alongside the Workplace Transformation Programme, there is also a structured programme of essential works to ensure that the Department’s ageing buildings remain open, safe and fit for purpose for both customers and colleagues, delivered through DWP’s Estates function. The following programmes have contributed to this in 2023 to 2024.
The Department’s ongoing preventative Lifecycle Works programme mitigates the effects of DWP’s aging estate within the constraints of the Department’s limited budget. DWP continues to invest in replacing the core assets in its estate to ensure it meets its statutory requirements and enable its buildings to remain resilient and open, ensuring customers have access to the services they require. The focus of replacement this year has included fire safety-related issues, poorer quality boilers, roofs and lifts.
Estates’ Critical Security Infrastructure (CSI) programme continues to deliver on its ambitions to provide best-in-class technology to keep colleagues and customers safe in our buildings. In 2023 to 2024 the Department upgraded security cameras, door entry systems, entrance monitors and intruder alarms in 200 sites.
DWP’s Workplace Services Programme is supporting the Department’s ambition for more cost-effective delivery of services provided by our supply chain. As part of this programme, the Estates function is currently re-procuring key facilities management (FM) and security services.
DWP’s Jobcentre Design Guide provides the standards for future properties and major refurbishments of existing sites. With rising numbers of customers with a health condition or disability, the inclusive design of jobcentre environments becomes ever more important and needs to cater for a range of accessibility requirements, including neurodiversity and mental health conditions.
Places for Growth
DWP has continued to make progress in the last 12 months against the Department’s Places for Growth targets.
Target 1: DWP has continued to increase the percentage of Senior Civil Service (SCS) roles outside of London, supporting the Department’s target of having over 50% of all SCS roles outside London and the South-East by 2025.
In March 2023, 57% of DWP SCS roles are based out of London and the South-East.
In the last 12 months, 77% of new SCS appointments have been outside of London.
Target 2: DWP achieved its target to reduce SCS in functional areas based in London to 40% by December 2022. The Department continues to monitor its progress in this area and to build communities in all hub locations.
In March 2024, 37% of functional SCS are based in Caxton House, London.
Target 3: In 2021, the Department achieved its target to announce a headquarters location outside of London - by designating Leeds as DWP’s second headquarters. The Department is continuing to embed this within its working practices.
Target 4: DWP has committed to the movement of 400 roles out of London and the South-East by 31 March 2025. In March 2024, Money and Pensions Service (MaPS), one of the Department’s arm’s length bodies, had relocated 247 roles from its Holborn office to Bedford. In addition, up to March 2024, the Department relocated 668 roles out of London.
89% of total DWP Workforce is based outside of London.
DWP has continued to tap into talent pools and enable career progression in the regions, through the use of DWP hubs in Glasgow, Treforest, Birmingham, Leeds, Sheffield, Newcastle, Manchester and Blackpool.
This further supports delivery of Places for Growth
Innovation and technology
The Department made progress in how it uses innovation and technology throughout the year. DWP continued to deliver the modern digital services which enhance productivity and efficiency, alongside running existing core services. The Department continued its migration to cloud hosting environment to reduce its reliance on outdated legacy technology, and ensured that security is considered from the outset of IT projects through the implementation of a new Digital Security Risk Management strategy. Coupled with routinely patching systems to the latest software versions to address security vulnerabilities, this ensures the end-to-end security of the customers and data the Department is entrusted with.
0.07% 320,000 User Hours Lost from 433 million available
Digital improvements and Artificial Intelligence (AI)
The Department helped reduce fraud and error through design and delivery of modern digital services, creating further opportunities to increase automation and straight-through processing.
DWP continued to identify opportunities to use automation to solve problems across the department (such as correspondence management), automating administrative tasks to free up colleagues to spend more time directly supporting customers. The Department has rapidly and successfully tested multiple generative AI proofs of concept, through multi-disciplinary teams. DWP’s proofs of concept (such as Aigent and a-cubed) have explored the potential for AI to support a wide range of business areas, such as supporting work coaches and frontline colleagues, updating legacy digital infrastructure, and supporting the productivity of policy colleagues. The Department has done this with a strong focus on the safe, ethical, and value-led adoption of AI.
Whitemail
Scans documents and quickly identifies vulnerable customers, allowing DWP to fast track and intervene.
Aigent
Uses AI to assist PIP agents e.g. by summarising evidence for inclusion in decision letters.
A-cubed
Provides work coaches with quick access to advice to help to support customers move closer to the labour market.
A new Digital Board has brought fresh transparency to how technology and DWP’s digital teams support departmental outcomes.
DWP has introduced technology that quickly triages the high volumes of correspondence it receives. Every day, 22,000 documents are processed in real time in what previously used to take weeks.
To date, DWP has processed 2.2 million documents using generative Artificial Intelligence (AI) to read, understand and summarise correspondence. The full information is then shared with colleagues for decision making.
It also uses capability to flag potentially vulnerable citizens and expedite their correspondence to the relevant colleague who can help them.
The Department continued to modernise how data is stored, shared and accessed. In line with cross-government data standards, DWP self-assessed a single area of the Department’s data maturity.
Over 900 data shares a year
45 System interfaces helping security connect data sharing across government and Partner Organisation
Delivery, Evaluation and Collaboration
DWP has continued to work across the Department to enable delivery and performance against the Strategic Outcomes and have strengthened strategic performance and planning conversations across the business.
To support decision-making and provide assurance, DWP has provided quarterly progress reports to the Departmental Board on performance against the Strategic Outcomes and Delivery Objectives.
DWP has also regularly assessed the deliverability of the departmental Plan to identify challenges to delivery and consider options to mitigate them.
DWP regularly evaluates programmes and pilots that the Department runs to learn lessons and apply best practice to future work. See Strategic Outcome 1 for more details on Restart, or visit The Evaluation of the Restart Scheme – GOV.UK (www.gov.uk)
DWP recognises the importance of working in partnership with other government departments and arm’s length bodies. These partnerships enable the Department to share knowledge and best practice, supporting delivery of DWP’s objectives and creation of solutions to shared issues.
DWP continued to collaborate with other government departments, including HM Treasury, Department for Education, Department for Levelling Up, Housing and Communities and Department for Health and Social Care. This partnership working supported the Department’s cross-cutting strategic objective to maximise employment, tackle issues on workforce participation and support in-work progression.
Sustainability
DWP is committed to operating and delivering its services in a sustainable way. The Department continued to manage its estate and operations, purchase goods and services and make policy in accordance with its sustainability obligations. Across the Department, DWP has made further progress in understanding its emissions, developing its governance, engaging with colleagues and improving digital sustainability performance.
DWP has continued to work to improve the energy performance of buildings. In 2023 to 2024 DWP increased the number of buildings which meet the top two Energy Performance Criteria from 3% to 8%.
Delivered a number of greener projects, including delivering a large recycling exercise with nearly 6,000, items of furniture being repurposed across the department saving over £580,000 in purchase costs.
For information on DWP’s mandatory reporting requirements relating to sustainability, see the Sustainability Report.
Delivery Objective: tackle fraud and drive efficiencies
Fraud Error and Debt Report
Introduction
DWP is committed to tackling fraud and error in the benefits system and to the recovery of debts. Part 1 of the Fraud, Error and Debt Report outlines what DWP has done to tackle overpayments and prevent loss. This section looks at performance against the fraud and error target. This includes the Department’s counter fraud functions, and savings from these activities in addition to upfront controls, and reporting on the 2023 to 2024 Fraud and Error National Statistics. The chapter also outlines where DWP is going further through investment in data analytics and system changes to drive down overpayment levels in key loss areas.
Part 2 of the Report looks at how DWP is correcting underpayments to ensure people are paid their full entitlement.
Finally, when overpayments happen, DWP commits to recover the money for the exchequer at the earliest opportunity. DWP will work with anyone who is struggling with their repayment terms and will always look to negotiate sustainable and affordable repayment plans. Part 3 of the Report sets out the management of debt recovery.
Measuring loss
Fraud and error is made up of overpayments and underpayments[footnote 20] of benefit that fall into one or more of the below three categories. The categories outlined are defined by loss is measured in the Fraud and Error National Statistics.
Fraud relates to claims where all three of the following conditions apply:
- the conditions for receipt of benefit, or the rate of benefit in payment, are not met
- the claimant can reasonably be expected to be aware of the effect on their entitlement
- benefit payment stops or reduces as a result of a review of the claim.
Claimant error overpayments are where claimants have provided inaccurate or incomplete information, or failed to report a change in their circumstances which has led to an overpayment, but there is no evidence of fraudulent intent on the claimant’s part.
Official error is where benefits have been paid incorrectly due to a failure to act, a delay or a mistaken assessment by the Department, a local authority or His Majesty’s Revenue and Customs, to which no one outside of that department has materially contributed, regardless of whether the business unit has processed the information.
There has been a change to the classification of claimant error underpayments, which is now classified as unfulfilled eligibility. It is important that DWP is aware of how much extra money benefit claimants could be getting if they told the Department about their current circumstances correctly. This was previously classified as claimant error underpayments, but upon review of the legal definition of an underpayment, this is now being classified as unfulfilled eligibility. The estimates relating to unfulfilled eligibility in the benefit system are now reported earlier within Strategic Objective 2 of the Performance Report. Later on the reasons behind the reclassification are covered.
The Monetary Value of Fraud and Error (MVFE) is DWP’s headline measure for overpayments and underpayments. It expresses loss in monetary terms (£s) and as a percentage of benefit expenditure. Measurement as a percentage is a better expression of loss, as total benefit expenditure is affected by uprating which is applied each year and varies with demand as the wider economic conditions change. This means monetary loss (£s) can increase even if the percentage of loss falls.
To calculate the level of loss, the following methodology is used:
- benefits which have large expenditures, such as Universal Credit, are measured continuously. This year, the levels of fraud and error, and unfulfilled eligibility were measured in Universal Credit, State Pension, Pension Credit, Housing Benefit, Personal Independence Payment and Disability Living Allowance. DLA was last measured in 2004 to 2005. For Housing Benefit, the passported client group was last measured in 2019 to 2020 and the standard client group was last measured in 2018 to 2019[footnote 21].
- to measure the levels, a sample of cases is selected from each benefit (around 13,300 were sampled for 2023 to 2024). A claimant is then contacted by telephone and asked to provide evidence to support their claim which is compared to the information held on DWP’s computer systems. This process identifies where a claimant may have been overpaid or underpaid, and whether claimants have unfulfilled eligibility.
- once all reviews are complete, an extract of the data is taken and there is a gross-up of the sample data to estimate the levels of fraud and error, and unfulfilled eligibility, in each benefit.
- there are several benefits not measured in this way. Some benefits will have been reviewed before and the previous rate of fraud and error is applied when calculating loss. Other benefits, usually those with a small expenditure, will have a proxy measure applied from a benefit that is administered in a similar way such that it can be reasonably assumed and apply the same rate of fraud and error.
- the Fraud and Error National Statistics should calculate overpayments and underpayments in accordance with what is due under the law.
- all of the overpayment and underpayment amounts for every benefit are added up and divided by the total expenditure to give the percentage overpaid and underpaid.
- this year, the sampling period took place between November 2022 and October 2023 for most of the benefits sampled. The exceptions are for DLA, which took place between February and September 2023, and PIP which took place between October 2022 and August 2023. The review, evidence gathering, and measurement periods of the selected cases can span a wider time frame than the sample period itself, with some reviews and categorisations still being completed up until the end of February 2024. The sample year and the financial year don’t align. This means a proportion of expenditure for benefits reviewed this year cannot be captured by the sampling process.
DWP sets out eligibility criteria to establish whether an individual is entitled to benefit support. Benefit rules target support at individuals that need it most. However, these rules also create the opportunity for fraud and error to enter the system. For example, the limit on the amount of money, savings and investments an individual can hold while claiming benefits introduces opportunity for error in how an individual reports the money they have access to. These errors are presented as a loss to the exchequer.
Levels of fraud and error in the benefit system for 2023 to 2024 are in this report. Fraud is the greatest cause of loss (2.8% of overall expenditure) and UC has the greatest rate of loss (12.4% of UC expenditure). UC accounts for 19% of benefit expenditure but 66% of overpaid expenditure, so UC fraud and error will have a disproportionate impact on overall levels of loss. Although DWP focuses a lot of attention on fraud and on UC, the department is committed to driving down levels of overpayment across the whole of the benefits system.
Table A: Fraud and Error losses by benefit
| Benefit | Loss £ million |
|---|---|
| Universal Credit | £6,460 |
| Housing Benefit | £980 |
| Never reviewed | £570 |
| Pension Credit | £520 |
| Employment and Support Allowance | £430 |
| Carer’s Allowance | £190 |
| State Pension | £170 |
| Attendance Allowance | £150 |
| Other | £110 |
| Personal Independence Payment | £90 |
| Disability Living Allowance | £30 |
Measuring savings in monetary terms
DWP also measures the impact of fraud and error controls and activities in terms of Annually Managed Expenditure (AME) savings – i.e. how much the cost has reduced to the exchequer as a result of interventions. These savings are estimated by adding up both historic overpayments that have been identified (discounted to take account of debt recovery rates) and future overpayments estimated to have been prevented (based on assumptions about how long the overpayment would have continued to exist if it hadn’t been found ). For the purposes of this report, future overpayments prevented are only included that would have happened in the 2023 to 2024 financial year. Interventions this year will also have a further impact in future years. In addition, savings estimated from DWP’s up-front controls are completed by comparing with a counter-factual world where that control doesn’t exist.
Devolution
Following the devolution of social security powers to the Scottish Parliament under the Scotland Act 2016, the Scottish Government is in the process of developing its own fraud solutions. DWP has been working with the Scottish Government to agree a process for tackling overpayments both jointly and individually, and to provide solutions for secure and legal two-way sharing of information between DWP and the Scottish Government, where appropriate. Social security benefits in Wales remain reserved to the Westminster government. Social security policy is ‘transferred’ in Northern Ireland and delivered by the Department for Communities.
1. Tackling Fraud and Error
Management summary – Fraud and Error Landscape
Fraud has been a growing problem across the economy and is now responsible for 37% of all crimes against households in 2023[footnote 22]. DWP’s analysis indicates that the rising trend to commit fraud in the wider economy has also been seen in increased rates of fraud in the welfare system.
DWP’s overpayment rate grew during the pandemic from 2.4% in 2019 to 2020 to 4.0% in 2021 to 2022. The cause of this growth was largely due to the necessary easements put on controls at the height of the pandemic to support the most vulnerable. For example, the removal of the Gainful Self-Employment test and the Minimum Income Floor. Steps were taken to minimise losses, and without this activity, it is estimated fraud and error across all benefit expenditure could have been as high as 5.4%[footnote 23]. With the benefit of hindsight, the evidence suggests that this increasing propensity for fraud in society was present during the pandemic but was likely concealed in the fraud and error statistics by the effects of the easements and was a trend that had begun before the pandemic and has continued after it.
There are various sources available to establish the trends and growth in fraud and wider economic crime. The best comparators for DWP’s circumstances are fraud committed by individuals (or groups of individuals) against organisations, shoplifting, and societal attitudes and tendencies towards fraud. All of these measures indicate a long-term rising trend in fraudulent behaviour.
DWP is delivering against key counter fraud activity, including investing in counter fraud professionals, scaling up the Targeted Case Reviews programme and building data analytical capabilities. As a result of DWP performance and the removal of easements, overpayment rates reduced in 2022 to 2023 from 4% to 3.6% of overall expenditure, and in Universal Credit from 14.7% to 12.8%. In addition, this year DWP has delivered against the £1.3 billion AME savings target as set out within the 2022 to 2023 Annual Report and Accounts.
This chapter starts by setting out the evidence on the increased propensity to commit fraud, as requested by the Public Accounts Committee. The chapter then covers the performance of DWP counter fraud operational activities and preventative controls including:
a. The Controls Framework: the main preventions against fraud and error are through controls such as UC identity verification checks. The framework also includes savings made through dedicated counter fraud resource. In total last year’s controls saved £18 billion. Further details in building on the framework published in the 2022 to 2023 Annual Report and Accounts (ARA).
b. Detect and correct counter fraud and compliance activity and performance against the 2023 to 2024 £1.3 billion AME savings target. This section covers counter fraud and compliance, Targeted Case Reviews and the Verify Earnings and Pensions Service. See ‘Delivery of Counter Fraud and Compliance Activity including performance against the £1.3 billion AME Savings Target’ section for further details on the target and details of key interventions.
c. How DWP is further preventing fraud and error through continuous improvement. This will cover updates relating to data and analytics, UC continuous improvement activity; and activity across other benefits to reduceoverpayments. The National Statistics shows that fraud levels in 2023 to 2024 are at 2.8% compared with 2.7% in 2022 to 2023. Within this section there is detail on the fraud and error Spring Budget 2023 forecast and the revised Spring Budget 2024 forecast.
Fraud in the Economy
Evaluation of the Growing Propensity to Commit Fraud
With benefit spending at £266.1 billion in 2023 to 2024, the welfare system is a deliberate target for both organised crime groups and opportunistic individuals. A range of evidence indicates that there is a long-term rising trend in fraudulent behaviour towards organisations and a softening of attitudes regarding fraud in wider society. While there may be fluctuations in data over time, the overall trends appear to continue upwards. Although direct comparisons to trends outside of the welfare system are difficult and need to be treated with caution, the evidence outlined here is sufficiently comparable to assume that these trends are likely to be mirrored in the benefit system. This increases the scale of the challenge faced in preventing and detecting fraud.
As requested by the Public Accounts Committee the evidence presented by DWP currently shows that:
1. There is a long-term increasing trend in levels of fraud against organisations. Data for fraud offences against businesses referred to the National Fraud Intelligence Bureau by Cifas (who facilitate fraud data-sharing for over 600 large public and private UK organisations) shows a rise in fraud cases against organisations over the past decade. In particular the two most recent available financial years (2021 to 2022 and 2022 to 2023) each show an 11% annual increase, compared to a 5% average increase pre-pandemic[footnote 24].
Table B: Fraud Offences reported by Cifas
| Financial year | Number of reported fraud offences | Cifas % change |
|---|---|---|
| 2013 to 2014 | 214,156 | – |
| 2014 to 2015 | 257,762 | 20 |
| 2015 to 2016 | 298,968 | 16 |
| 2016 to 2017 | 306,195 | 2 |
| 2017 to 2018 | 276,997 | -10 |
| 2018 to 2019 | 313,175 | 13 |
| 2019 to 2020 | 334,297 | 7 |
| 2020 to 2021 | 301,755 | -10 |
| 2021 to 2022 | 335,233 | 11 |
| 2022 to 2023 | 371,340 | 11 |
2. There is a notable uptick in shoplifting, which may suggest an increasing motivation to commit fraud / crime in order to ease financial pressure. According to police-recorded crime data for England and Wales, reported levels of shoplifting have steadily increased since retail reopened after the pandemic. Annual levels of shoplifting have increased by an average of 27% since 2021, and the 2023 level is 11% higher than the pre-pandemic level in 2019. Shoplifting reached a record high in April 2024[footnote 25].
Chart C: Shoplifting – Police Recorded Data
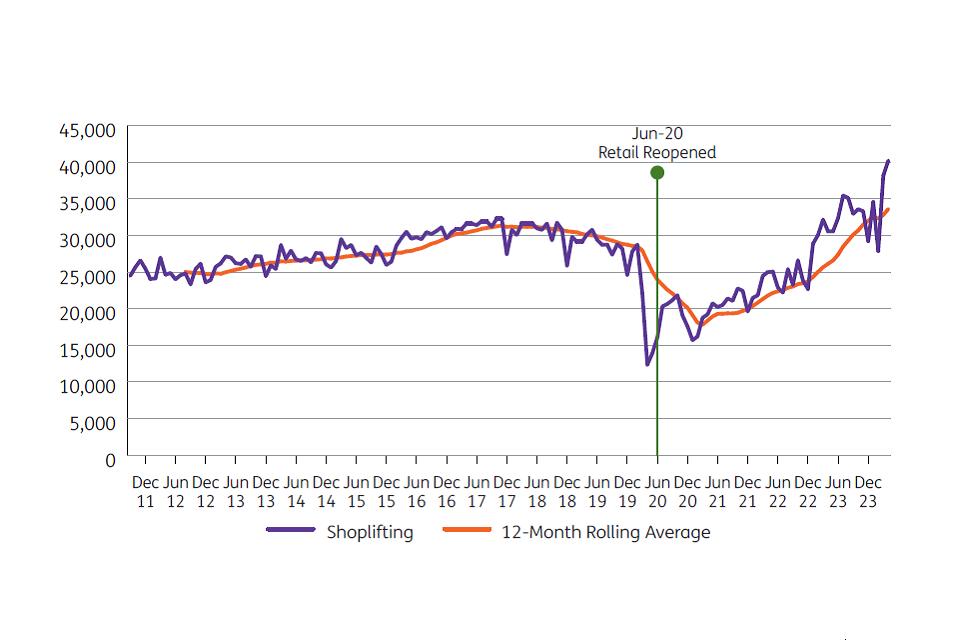
Annual Percentage Change in Total Incidents of Shoplifting, UK Crime Stats, 2023
| Year | % change |
|---|---|
| 2014 | 3 |
| 2015 | 2 |
| 2016 | 8 |
| 2017 | 5 |
| 2018 | -2 |
| 2019 | -6 |
| 2020 | -30 |
| 2021 | -1 |
| 2022 | 19 |
| 2023 | 35 |
Source: UK Crime Stats – Police recorded crimes, England and Wales
3. Attitudes toward benefit fraud have softened. Results from the British Social Attitudes Survey show the proportion of respondents who said it was either ‘Not Wrong’ or only ‘A Bit Wrong’ for an unemployed claimant not to report £3,000 cash from a casual job increased 11 percentage points, from 16% to 27%, between 2016 and 2022[footnote 26].
Chart D: Extract from British Social Attitudes Survey
BSAS Question: “An unemployed person on benefits takes a casual paid job in cash; he does not report it to the benefit office and is £3,000 in pocket. Is this wrong?”
| Response | 2016 | 2017 | 2018 | 2019 | 2022 |
|---|---|---|---|---|---|
| Not wrong/A Bit Wrong | 16% | 16% | 19% | 20% | 27% |
| Wrong/Seriously Wrong | 80% | 81% | 77% | 74% | 66% |
| Don’t Know | 2% | 2% | 3% | 4% | 7% |
| Refusal | 2% | 1% | 1% | 1% | 0% |
| Unweighted bases | 782 | 2,446 | 2,269 | 2,636 | 1,664 |
Another survey conducted by YouGov for the Insurance Fraud Bureau in July 2023 found that 27% of 18 to 24 year olds would “likely” provide false or misleading information on an insurance claim to save money, if struggling financially. This has increased from 21% in the previous year[footnote 27].
Further evidence will shortly be published from a 2023 study conducted by the University of Portsmouth. This study demonstrated how attitudes towards certain ‘deviant acts’ had changed over time. In 2011, the original research found that 85% of respondents thought falsely claiming benefits was never justified. In 2023, the comparable figure was 67%. Falsely claiming benefits was the largest change out of all 15 ‘deviant acts’ studied. The study also calculated ‘Integrity Scores’ for participants based on their responses. Results showed that in 2011, roughly 7% of respondents had a low integrity score, but this increased to over 20% in 2023[footnote 28].
Some surveys have also found more people admitting to having committed fraud. A survey by Cifas shows a growth over time in the number of people admitting to committing fraudulent conduct, rising from 8% of respondents in 2021 to 12% in 2023[footnote 29]. Research conducted for Aviva UK (Dec 2022) found that 33% of motorists said they have changed at least one material detail in their motor insurance application to save money[footnote 30].
The overall conclusion of this analysis is that there is an increasing trend in the underlying propensity towards fraudulent behaviour, which can be expected to place an upwards pressure on fraud in the welfare system. DWP has estimated through the Office for Budget Responsibility (OBR) expenditure forecasts that this long-term behavioural trend creates a headwind that would cause fraud levels to grow at around 5% per year without action to reduce it. Based on the variety of evidence highlighting a long-term sustained increase in fraudulent behaviour, this trend is expected to continue throughout the OBR forecasting period over the next 5 years. Whilst this is an inexact science, the most recent statistics also support the existence of a broad upward force of around 5% per year, which is partially counterbalancing DWP work in stopping and correcting overpayments (see further detail later in the section).
Tackling Fraud and Error
This section is split into two covering:
- the delivery of DWP’s detect and correct counter fraud and compliance activity, focussing on the key interventions undertaken by frontline counter fraud professionals, including the Targeted Case Review teams
- the delivery of DWP’s core controls, for example, up-front checks on claimant entitlement including identity verification.
Delivery of Counter Fraud and Compliance Activity including performance against the £1.3billion AME Savings Target
The 2022 to 2023 Annual Report and Accounts set a 2023 to 2024 AME savings target of at least £1.3 billion. This target included activities delivered though DWP’s Counter Fraud and Compliance function, the Targeted Case Reviews, and verifying earnings in Housing Benefit, Carer’s Allowance and Employment and Support Allowance to detect fraud and error, and correct claims.
In 2023 to 2024, DWP achieved AME savings of £1.35 billion, delivering against the fraud and error savings target.
Table E: AME Savings actuals – broken down by function[footnote 31]
| function | 2023 to 2024 AME Savings Actuals |
|---|---|
| Counter Fraud and Compliance | £1.21 billion |
| Targeted Case Reviews | £0.09 billion |
| Verify Earnings and Pensions | £0.06 billion |
| Totals | £1.35 billion |
Dedicated Counter Fraud Activity
Counter Fraud and Compliance Function
Counter fraud and compliance resources are deployed to emerging and high risks areas, detecting and correcting where needed and pro-actively looking to prevent and disrupt fraud at the earliest opportunity. This approach has seen Counter Fraud and Compliance deliver over £1.2 billion savings for 2023 to 2024.
Counter Fraud and Compliance has different approaches to tackling fraud, depending on the nature and severity. The team deploys a diverse range of expertise, technology, and intelligence to protect the integrity of the benefits system, correcting benefit where appropriate and bringing the most serious cases to justice. (See table below).
Table F: Counter Fraud and Compliance Teams
| Enhanced Review Team (ERT) | Interventions | Compliance | Investigations | Economic Serious Organised Crime (ESOC) | |
|---|---|---|---|---|---|
| Purpose | Tackle incorrectness through pre-payment verification and post-payment disruption activity | Tackle incorrectness through scripted interviews; cases identified by data matching rules and pre-payment staff referrals | Tackle incorrectness through robust and challenging interviews; cases identified by data matching, staff, and public referrals | Tackling fraud by delivering criminal sanctions against the most serious cases, bringing criminals to account, and providing a deterrence impact | Tackling serious and organised crime and exploitation of individuals, creating jeopardy for organised crime gangs |
| Outputs 2023 to 2024 | ERT reviewed 166,062 claims and corrected payments on 39,602. | Interventions reviewed 208,666 claims and corrected payments on 89,487. | Compliance reviewed 269,944 claims and corrected payments on 55,218. | Fraud Investigations teams secured 567 administrative penalties and 655 prosecutions. | ESOC progressed 265 operations into serious and organised crime whilst continuing to feed into ERT to evoke the disrupt to benefit process. |
| Net AME Savings | £536 million | £313 million | £279 million | £46 million | £5 million |
In addition to the savings of £1.179bn shown in the table, Counter Fraud and Compliance (CFC) also saved:
1. £22 million tackling incorrectness where undeclared capital assets have been identified in estates.
2. £4 million tackling Living Together allegations through a nudge-based campaign approach.
3. £1 million prevented by taking fraudulent documents out of circulation.
4. £1 million savings generated within counter fraud testing.
Resource to Risk
Work is targeted towards the highest potential savings, using a mixture of early triage and data driven risk-based scoring, or by prioritising tackling criminality and ensuring there is a robust societal deterrent to fraud. In addition to tackling fraudsters, DWP plays an important role in safeguarding vulnerable customers, for example by tackling human trafficking and modern slavery. DWP continues to shift resources into prevention activities, proactively looking to close down fraud and error at the earliest point.
Enhanced Review Team (ERT)
ERT was created in April 2020 (previously known as the Enhanced Checking Service) to deal with suspicious new applications referred by UC teams to address immediate and serious risks as they arise.
The sources of data for ERT cases are a combination of referrals from across benefit lines and the Integrated Risk and Intelligence Service (IRIS).
ERT is constantly developing its approaches to effectively tackle fraud. It has taken on data-driven work from IRIS and disruption cases associated with ESOC investigations into Organised Criminal Gangs. For example, during 2023 to 2024 DWP experienced a large influx of volumes into an ERT high-fraud risk workstream, which led to the decision to move resource at pace from other counter fraud and compliance functions into ERT, resulting in 40,000 cases being reviewed, and c. 14,000 claims being corrected.
Counter fraud officers engage customers by telephone and in person to verify their claim requesting documentation where required. DWP can remove elements, suspend, or close claims if they cannot be satisfactorily verified. Stopping payment to customers is a critical decision, so there is a strong focus on safeguarding vulnerable customers, developing constructive relationships with partner organisations to address how customers can be better supported , and offering better advice and signposting for those who need it.
For example, through scenarios provided by organisations such as Citizens Advice, training has been improved and by learning from the experiences of Advanced Customer Support leads has allowed teams to highlight the needs of all customers.
This year focus has been on expanding the range of benefits ERT looks at and how DWP resource to risk to prevent and disrupt fraud and error at the earliest opportunity. DWP has worked with stakeholders to provide training and impact process changes rapidly. Collaboration between teams was recognised when one of the trials won the Public Sector Counter Fraud Award – Innovation in Fraud Prevention 2024.
Targeted Case Review
Targeted Case Review (TCR) was established to identify and address incorrectness across UC claims, providing vital intelligence on new and emerging ways to identify fraud and error entering the welfare system. As a long-term initiative, the team is delivering against the OBR scored savings of £6.6 billion by March 2028.
The focus in 2023 to 2024 has been on continuing to scale and stabilise a new operation that began testing in 2022 to 2023. During 2023 to 2024, TCR reviewed over 200,000 claims, finding and correcting almost 50,000 claims to save £89 million.
Following additional investment at Autumn Statement 2022, alternative deliverymodels were examined to support scaling up to 5,930 full time equivalent reviewing agents by the end of March 2025. A decision was taken in May 2023 to move to a hybrid delivery model which led to a reprioritisation of delivery plans: this was essential to ensuring the ability to scale the service safely beyond original expectations. From autumn 2024, TCR agents will be working alongside agents from an external provider.
Progress has been made towards the target of 5,930 reviewing agents by the end of March 2025. At the end of September 2023, the programme surpassed the target of securing 2,000 agents (10 months ahead of the original plan, which was aiming for July 2024) and maintained momentum to increase the scale by the end of March 2024, placing 3,100 agents across 25 sites.
The predicted AME savings for TCR are reliant on several factors, including the number of completed reviews, number of reviewed cases found to be incorrect, and the average value of the incorrectness on each claim.
Table G: TCR Performance Drivers
| Performance drivers | Outturn |
|---|---|
| Productivity: cases reviewed per day, per agent, in March 2024 | 1.05 |
| Hit rate: claims reviewed found to be incorrect, annual average | 24% |
| AME per hit: average savings per incorrect claim, annual average | £4,750 |
| AME: savings achieved in 2023 to 2024 | £89 million |
Whilst overall AME savings were below the original OBR scored savings profile, the programme has achieved improvements in performance particularly in the last quarter of the year. For example, the average AME per hit was higher than expected whilst agent productivity was lower due to the reprioritisation of plans to account for moving to a hybrid delivery model. This is a new initiative and still growing, time has been invested in getting this right now to safeguard the future impact of TCR. DWP expects to meet the OBR savings across the scorecard period as the programme scales and the benefits are fully realised.
Supporting the claimant is at the foremost of claim reviews. The programme have not yet collected any management information specifically on the quality of customer service as the view is that collecting information before the system reaches maturity could present a misleading picture.
An agile approach is being taken to designing the service to ensure teams learn and processes are iterated as the programme continues to scale. TCR teams have adopted the existing customer service quality framework used across the UC service to support continuous improvement. Through this insight, a more tailored quality regime has been developed for TCR which will continue to be refined . This has helped improve service design, enhanced learning and development for TCR and increased correctness of reviews.
A diligent approach has been maintained to ensure the claimant is supported throughout the review process with the expectation that the service would be adapted to address any early signs of failings. The programme have been encouraged by the number of examples of agents able to assist claimants more broadly than checking claim correctness. For example, signposting to wider support, collaborating with other support organisations to provide vital help when needed and identifying claimants not receiving the right level of Universal Credit.
As part of contract management, the same approach would be adopted with an external partner from the autumn. Once the service is stable from April 2025, DWP will examine opportunities to collect information on customer service in line with other service improvement prioritisation.
Finally, as more Universal Credit claims are reviewed there will be a continuation to apply learnings from these reviews to inform changes to policy, systems, and service design to prevent error from entering the welfare system in the first place. This will help provide a fair, high-quality system that ensures customers receive their full entitlement and avoid unnecessary debt.
Delivery of the Department’s Core Controls
Despite the rising trend to commit fraud in the economy, DWP has have saved around £18 billion through preventative activity through frontline controls and detection by counter fraud teams.
Last year this estimate was included for the first time and presented as a new, experimental metric which would continue to be developed and refined. This year, although the overarching approach remains the same and total savings at a similar level as reported last year, the methodology has improved and the assumptions have been updated and improved. Therefore it is not appropriate to make comparisons to previous years’ data. This measure will be developed further in the coming year and so it remains experimental this year.
The table below presents an estimate for how much higher current benefit spend would be against a counterfactual scenario where benefits were paid out on demand. It therefore estimates the value of the work completed to verify eligibility or ensure that entitlement remains correct by processing claimants’ circumstances. The activities and controls that protect the benefit system from overpayments include:
- up-front checks which prevent incorrectness from getting into the system at the claim start, such as verification of claimant-provided information and of basic conditions of entitlement such as identity
- functional assessments which confirm entitlement to disability benefits
- processing of changes of circumstances reported by claimants, whether reported on-time or late, or identified through the automated use of Real Time Earnings information from HM Revenue and Customs
- pro-active counter-fraud and error activities, including Targeted Case Reviews.
Table H: Amount of potential expenditure loss from overpayments saved – broken down by function for 2023 to 2024
| Dedicated counter-fraud and error resource | Amount £ billion |
|---|---|
| CounterFraud and Compliance Directorate | £1.21 |
| Investigations | £0.05 |
| Compliance | £0.28 |
| Interventions | £0.31 |
| Enhanced Review Team | £0.54 |
| Economic Serious Organised Crime team | £0.01 |
| Recovery From Estates | £0.02 |
| Other | £0.01 |
| Verify Earnings and Pensions (VEPs) | £0.06 |
| Targeted Case Reviews | £0.09 |
| Sub Total | £1.35 |
| Of which expected recoveries from debt referrals | £0.54 |
| Of which prevented future overpayments | £0.83 |
| Other downward adjustments to current or past entitlement | Amount £ billion |
|---|---|
| Where an overpayment was identified | £2.21 |
| In advance of an overpayment occurring | £7.35 |
| Sub-total | £9.56 |
| Of which expected recoveries from debt referrals | £0.18 |
| Of which prevented future overpayments | £9.38 |
| Specific upfront checks on claimant entitlement | Amount £ billion |
|---|---|
| Functional health assessments | £5.16 |
| Other disallowances | £2.32 |
| Of which Universal Credit Identity Verification | £0.29 |
Total expenditure saved £18.38 billion
Table footnotes
Functional Health Assessments- these are checks done on conditions of entitlement at the start of a disability benefit claim.
Other disallowances- checks done on conditions of entitlement at the start of a non-disability benefit claim for other benefits, this year UC and Pension Credit have been incorporated.
UC IDV (Identity Verification)- savings associated specifically with the checking of a claimant’s identity at the start of a UC claim.
Notes:
1. Measuring the savings associated with all these processes requires a variety of estimation methodologies and analysis of different data, meaning some elements of the overall estimate are more robust than others. The estimated savings from dedicated fraud and error resource (Counter Fraud Compliance and Debt Directorate; Targeted Case Reviews; Verify Earnings & Pensions programme) are based on established methodologies which are considered more robust than those used to evaluate savings from front-line controls.
2. The scope of the estimate (benefits with smaller, or declining caseloads have been excluded) and the nature of the assumptions t used means that all the figures are more likely to be an underestimate than an overestimate.
3. DWP is not currently able to accurately measure savings achieved from the verification of claimant-provided information such as the amount of capital and household composition. However, this year an estimate of the savings achieved from activity that leads to disallowances of new claims has been incorporated into the measure. This estimate will be refined further in future years.
4. DWP has not attempted to estimate the additional savings that arise from deterring claimants from committing fraud and making mistakes in the first place, as a consequence of the things that DWP has done and the messages that have been promoted.
5. For all of these reasons, the estimate provided here is expected to be an underestimate of the true amount of expenditure that has been saved overall.
6. Totals may not sum due to rounding.
How this relates to the level of overpayments paid out
The published level of overpayments paid out this year was 3.7% of benefit expenditure (£9.7 billion). DWP estimates that a further 6.6% of expenditure has been prevented from being overpaid as a result of counter fraud activities and controls. Without DWP efforts, overpayments would have been at least 10.3% (£27.4 billion).
Chart I: Percentage of expenditure overpaid and the additional percentage of expenditure that was saved through prevented overpayments
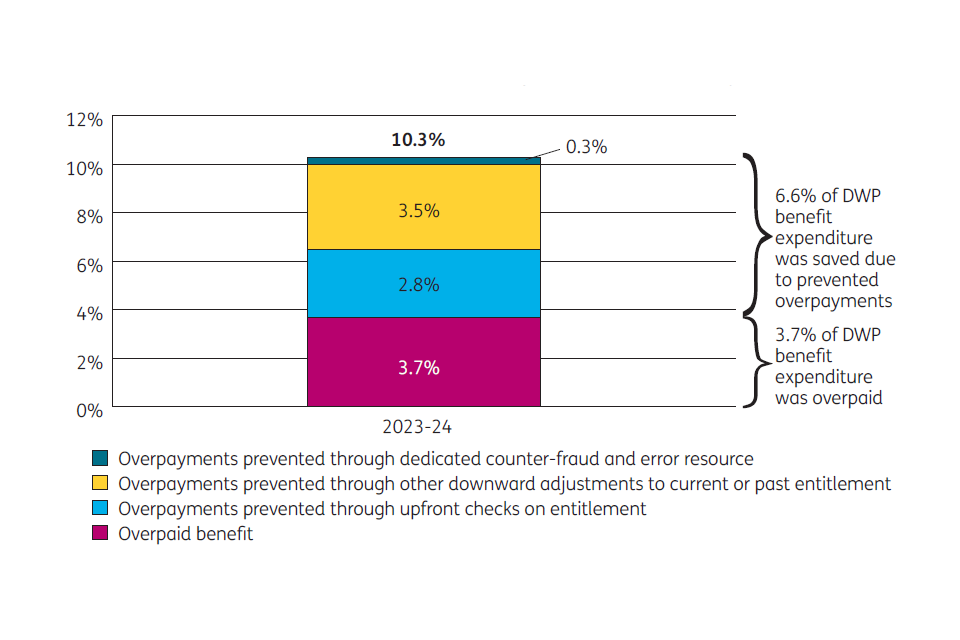
Chart J: Amount of expenditure overpaid and prevented from being overpaid
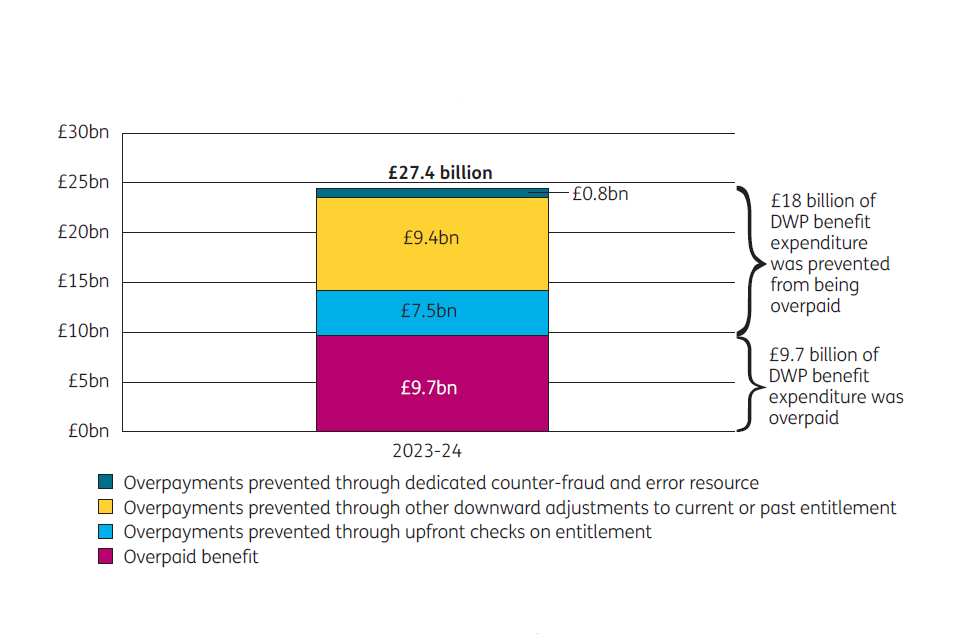
Driving continuous improvement to tackle fraud and error
This section looks further into how DWP is preventing fraud and error from entering the system in the first place through continuous improvement of departmental defences. Over the last 12 months DWP has been focussed on prevention activity. This has centered on data, innovation, and service improvement to reduce overpayments.
Data is Key
Better use of data and analytics to prevent, detect and correct fraud
Effective use of data can help identify potential fraud and error with effective data verification processes DWP can significantly reduce or even potentially eradicate over- and under- payments. For example, DWP has seen this through collection of real-time information on earnings data shared by HM Revenue and Customs.
DWP continuously explores the additional data needed and working with external partners support to bring in data where possible within existing legislative frameworks.
DWP is also working with Accelerated Capability Environment (ACE), a partnership between government and the private sector that provides government Departments with access to a pool of external expertise to explore new practices and technologies to address front-line challenges.
Between 2022 to 2023 and 2024 to 2025, DWP has invested £70 million in advanced analytics to tackle fraud and error and expect this will help to generate savings of around £1.6 billion by 2030 to 2031.
Using Advanced Analytics
IRIS uses advanced analytics to increase the identification of fraud and error, including developing the use of machine learning, a form of AI to assist in the prevention and detection of fraud activities, through the development of machine learning models. DWP continues to develop new capability, including through the Transaction Risking (TxR) programme, to improve the ability to assess levels of fraud and error in transactions on a risk basis. This assesses levels of fraud and error in transactions across the welfare system at the point of application, prepayment and throughout the lifecycle of a claim, to combat fraud and error risks. This use of data and analytics helps identify benefit claims that may need additional consideration.
This new capability is helping to prevent fraud and error entering the benefit system from the outset. By using this technology to identify claims that are at higher risk of incorrectness using predictive models, action can be taken to intervene before an incorrect payment is made.
Safeguards
DWP is always careful when developing, testing and deploying risk models. The use of this technology does not replace human judgement or deny a payment to a claimant. Caseworkers always look at all available information to make a decision.
DWP ensures the right assurances and governance are in place for data and analytics functions in relation to fraud and error. Comprehensive safeguards are deployed and aligned with government best practice, standards, codes and working principles, alongside internal digital and legal review and approval processes. Examples of safeguards include no automated decision making on benefit claims identified that could be at a high risk of fraud and error; completion and regular review of Data Protection Impact Assessments and Equality Impact Assessments; digital and process design to minimise impact on legitimate customers; testing and evaluating data analytics tools prior to deploying into live service; regular fairness analysis of machine learning models. The safeguards which have been implemented are aligned to the 6 principles DWP adheres to in its AI governance to ensure responsible use of AI.
DWP always handles personal data in line with the Personal Information Charter[footnote 32] and data protection law. DWP is careful to process data with the Public Sector Equality Duty in mind ensuring that there is meaningful human input and safeguards for the protection of individuals. This gives the public and supervisory bodies the confidence that DWP is operating in the most ethical, legal, proportionate and responsible way.
Fairness Impact Assessment of Machine Learning
Models
Machine learning models are a key part of DWP’s approach to prevent fraud and error and, in turn, prevent overpayments and customer debt. To maintain public confidence in this approach, DWP must ensure machine learning is used in a lawful, proportionate, and safe way. As requested by the Public Accounts Committee this section presents an assessment of machine learning models.
The UC Advances model is the first machine learning model deployed into live service. It is designed to risk assess Advances requests and refer those assessed as high-risk to a colleague for a fraud-prevention intervention.
Throughout all stages of design, build, test, and deployment of the model legal obligations have been adhered to. Robust safeguards have been implemented to ensure and monitor the proportionality, safety, and fairness of this model.
In early 2024, a fairness analysis of the Advances model was carried out using best practice analytical methodologies.
DWP’s assessment of the results of the fairness analysis do not present any immediate concerns of discrimination, unfair treatment or detrimental impact on customers. Analysis confirms payment timeliness of legitimate Advances requests is not disproportionately affected by the model. The model does not impact payment of the associated UC claim.
DWP is committed to continue iterating the fairness analysis method and improving the data available for future analyses. Fairness analysis will be completed at regular intervals, the results of which will continue to inform regular decisions on the continued operation and improvement of the model as a reasonable and proportionate fraud prevention control.
DWP has considered the benefits and risks of publishing the results of fairness analyses. DWP has concluded it is not in the public interest to do so because it will undermine the effectiveness of the model as a fraud prevention control and therefore erode the ability to protect the public purse.
DWP will continue to report to Parliament annually through the Annual Report and Accounts.
Tackling Key Loss Areas
Universal Credit
The key loss areas in Universal Credit are overpayments caused by undeclared earnings (particularly self-employed earnings), undeclared capital, undeclared partner (‘living together’), household composition and incorrect housing costs. There were decreases in most of the key loss areas in 2023 to 2024.
Chart K: Percentage of Universal Credit expenditure overpaid by the key loss area
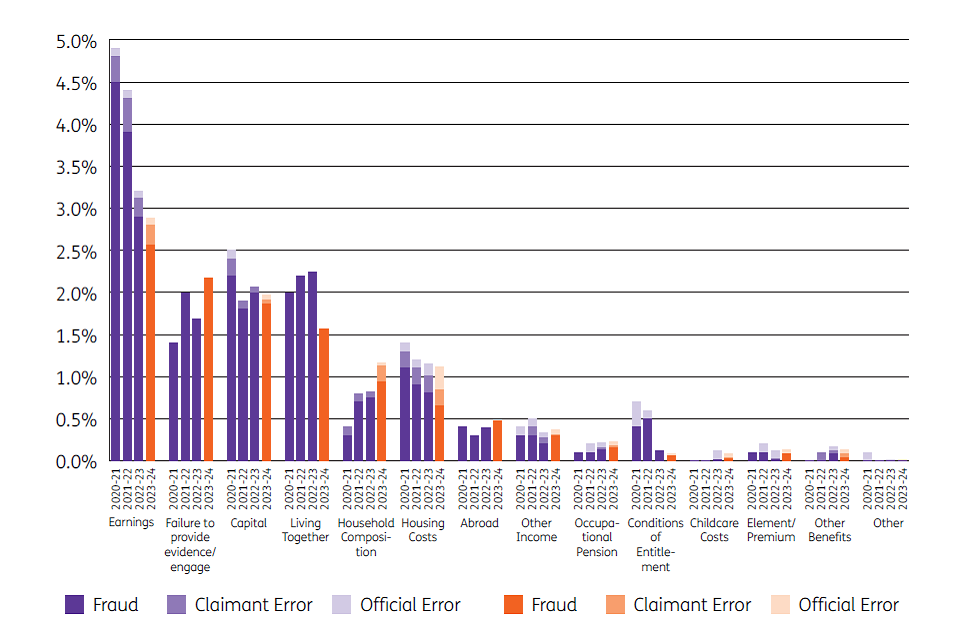
DWP’s approach to tackling fraud and error in UC brings together multi-disciplinary teams from across UC, Counter Fraud and Compliance, Work and Health, IRIS and Digital to focus on activity to reduce the levels of loss.
There is a team for each loss area responsible for understanding key insight and learning from key activities such as Targeted Case Reviews to identify the root causes of fraud and error that need resolving to prevent future losses.
Table L: Continuous improvement initiatives in Universal Credit
| Risk Area | UC Continuous Improvement activity underway[footnote 33] |
|---|---|
| Earnings causes overpayments of 2.9% of expenditure | DWP has: improved the UC service to assist self-employed customers to accurately report expenses – – introduced changes to better account for multiple sources of income to ensure more accurate payments – – updated online guidance to support customers reporting income and expenses and what it means for their UC. |
| Capital causes overpayments of 2.0% of expenditure | DWP has: introduced additional checks to verify an individual’s money, savings and investments (capital) before a payment is made – – improved communications to customers regarding their capital and encouraging them to report any changes. The has been done by asking customers specific questions about the types of savings and investments they may hold. |
| Living Together causes overpayments of 1.6% of expenditure | DWP: is reviewing high-risk claims where there could be an incorrect Living Together declaration – – continues to test and improve on-screen advice for Living Together to help claimants provide their relationship status and prevent incorrect payments. |
| Housing Costs causes overpayments of 1.1% of expenditure | DWP: are improving the way claims are identified where housing costs have changed, focusing on the private rental sector – – has completed annual verification checks for housing costs in the Social Rented Sector for 100% of cases. |
| Household composition causes overpayments of 1.2% of expenditure | DWP: is reviewing claims where data flags that there could be a change in household composition. For example, in August 2023, an action was raised for claimants to confirm for every child on a claim between 16 and 18 years of age, whether the child remained in education or training. Claims were impacted with clear guidance in place for the customer. Where the request was not completed the child element was removed from the claim. As a result, DWP has saved an estimate of around £300 million in overpayments – – has improved the UC service to request information relating to children in the household when a customer makes an update to their relationship status. This includes a reminder to report any other changes in their circumstances such as information relating to housing costs. |
| Abroad overpayments were 0.5% of expenditure | DWP: has updated online guidance to ensure customers understand that going abroad is a change of circumstances that must be reported – – has improved the UC service to enable customers to report when they go abroad to accurately record their circumstances – – is reviewing claims where data highlights a high risk of abroad fraud |
Other Benefits
For benefits other than Universal Credit, many of the key loss areas are specific to each benefit. However, some loss areas are common across multiple benefits, with incorrect capital an important example. As the chart below shows, in addition to being one of the key causes of overpayments in Universal Credit, incorrect capital is now the biggest source of overpayments in the other means-tested benefits, Housing Benefit and Pension Credit. Capital overpayments increased in both of those benefits in 2023 to 2024.
Chart M: Percentage of Housing Benefit and Pension Credit expenditure overpaid by the key loss area
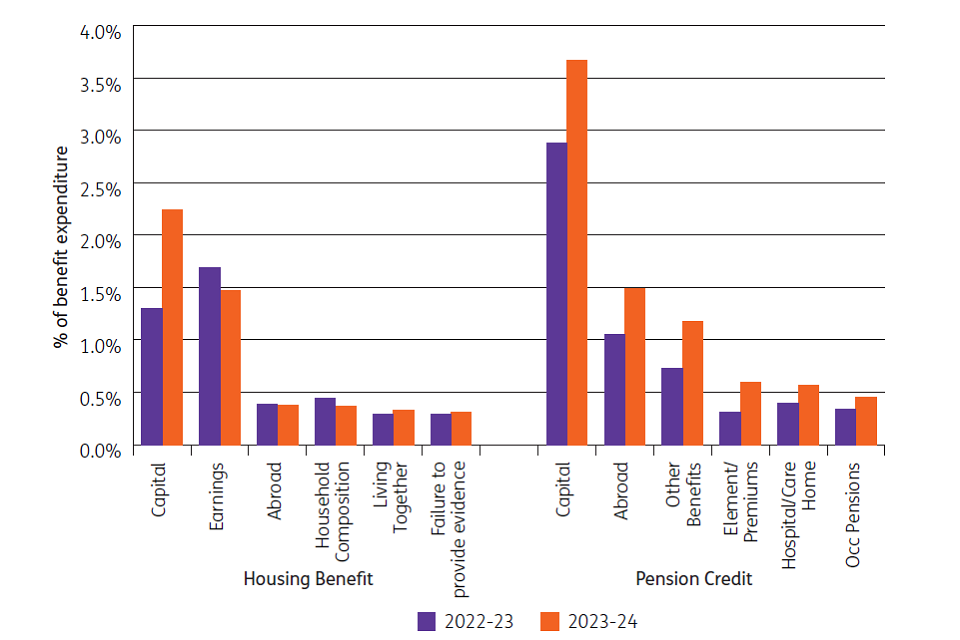
As in UC, across other benefits there are multi-disciplinary teams set up to work together to drive fraud and error reduction activity. Below are some of the key activities and initiatives being progressed.
DWP is:
- developing the use of data, data-sharing agreements and service automation opportunities, working across benefits and with wider government, public sector and private partners to help drive out fraud and error. This includes using cross-government data to identify abroad fraud, improving the use of alerts and other data from HM Revenue and Customs to verify and check benefit eligibility, and working to obtain real time care home data from local authorities to prevent errors in residency.
- driving continuous improvements in communications to ensure that customers know when and how to report changes of circumstance. In Carer’s Allowance an enhanced notification strategy is being progressed as part of existing commitments to improve customer engagement, building on existing communications with customers. As part of this approach, DWP is reviewing all forms of targeted contact to find the most effective and efficient solution, such as exploring the use of targeted text messages or emails to alert claimants and encourage them to make contact when DWP is made aware of a potential overpayment. This approach will help claimants understand when they may have received an earnings-related overpayment or are at risk of doing so and will encourage claimants to make contact to meet their obligation to report changes in their income and other relevant circumstances. This will reduce the risk of those customers being overpaid.
- continuing to utilise notifications received on changes to earnings and pensions across other benefits including Housing Benefit and Pension Credit exploring how to go further to tackle fraud and error challenges.
- simplifying the service and guidance to help customers to get things right and make it clear what is required. Investing in the development of colleagues to ensure they are equipped to support customers.
- continuing to deliver Housing Benefit Award Accuracy (HBAA) to help local authorities target full case reviews and change of circumstances and are providing local authorities with support around the largest area of loss to help keep claims right and tackle fraud and error.
Outcomes: 2023 to 2024 National Fraud & Error Statistics and Forecast
Fraud and Error Statistics – All Measured Benefits
In May 2024, DWP published estimates of the levels of fraud and error in 2023 to 2024. They showed that the overall level of overpayments across all DWP benefit expenditure was 3.7% (£9.7 billion) of benefit expenditure.
The continued focus on reducing fraud and error ensured that, despite evidence of a sustained increase in the underlying propensity to commit fraud the overpayment rate in Universal Credit for 2023 to 2024 is 12.4% of Universal Credit expenditure, compared to the 12.7% seen in 2022 to 2023[footnote 34].
Chart N: Overpayments and Underpayments by benefit group
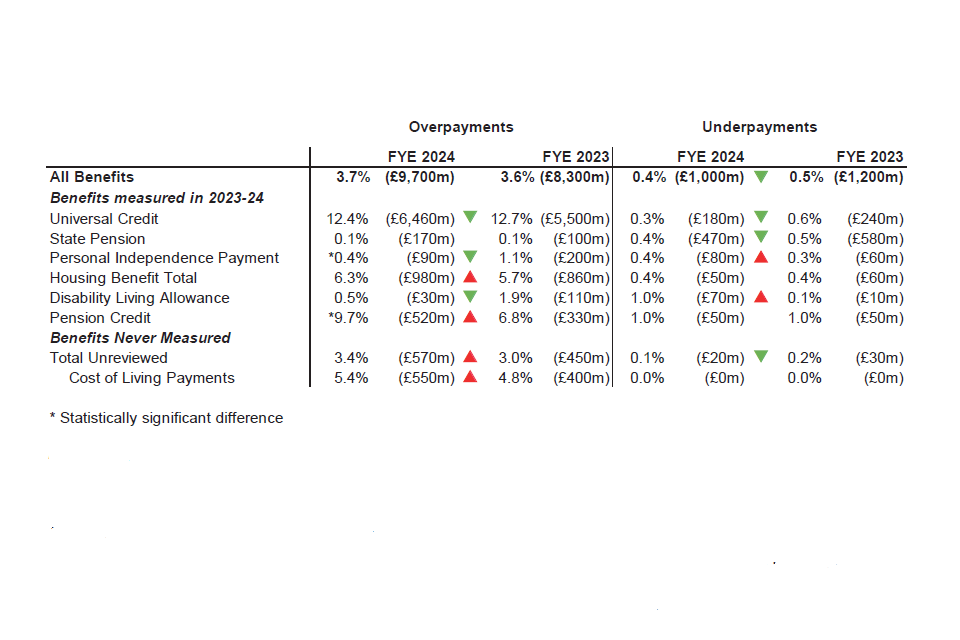
(Many of the changes are not statistically significant given the size of the confidence intervals around the central estimates)
The overall level of overpayments across all of DWP expenditure changed from the 3.6% seen in 2022 to 2023 to 3.7% in 2023 to 2024 (this is not a statistically significant change).
Chart O: Percentage of departmental expenditure overpaid each year, broken down by benefit
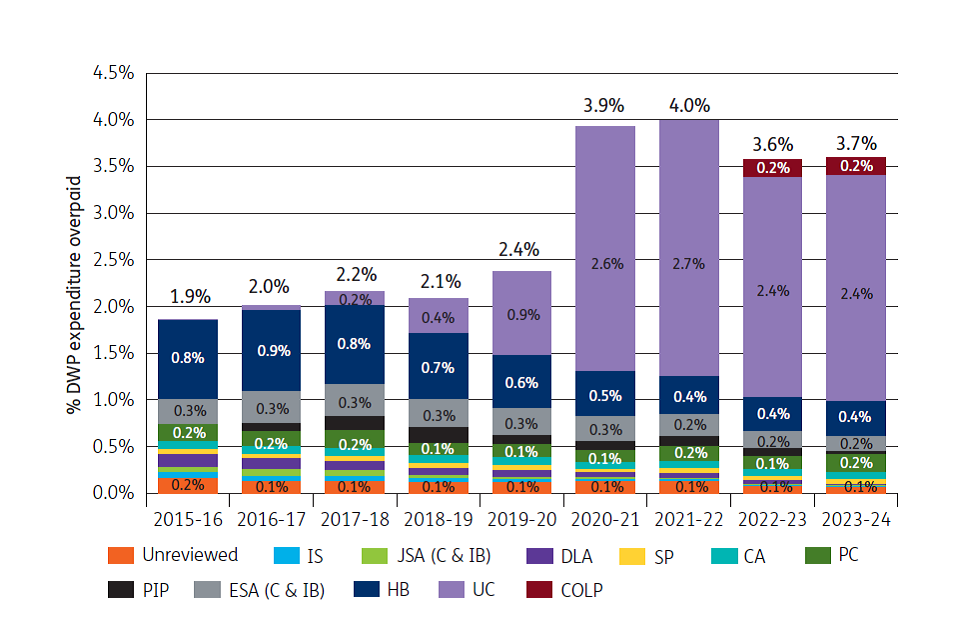
The chart below shows that this was primarily due to rising Universal Credit expenditure, meaning that Universal Credit represents a larger proportion of overall expenditure than previously, which pushes up the overall rate of overpayments because Universal Credit has a higher than average rate of overpayments.
Chart P: Factors contributing to the change in the global overpayments level
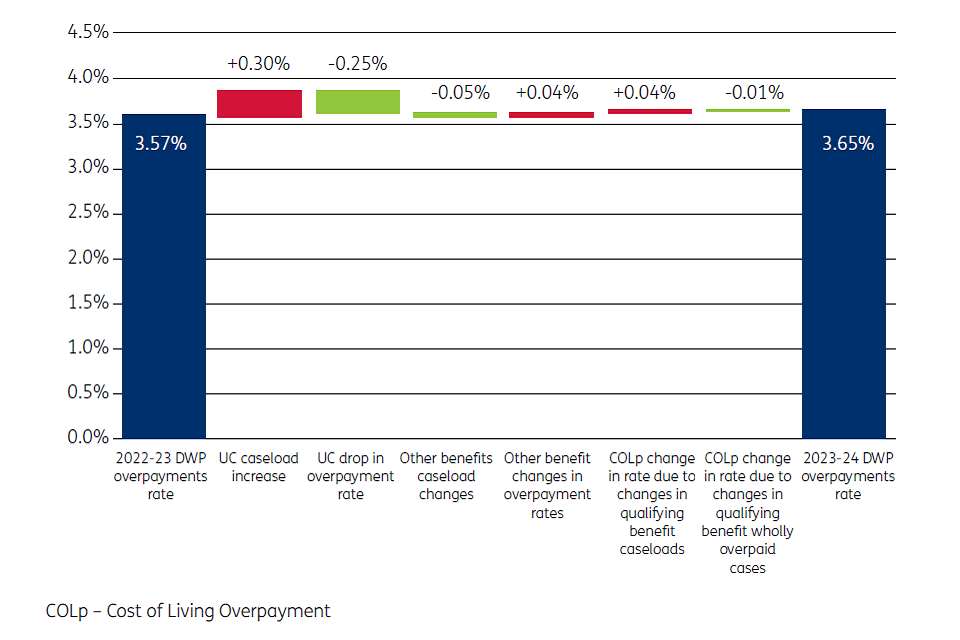
The level of overpayments in Universal Credit in the 2023 to 2024 statistics were higher than the level of 10.4% that had been forecasted in Spring Budget 2023, as published by the National Audit Office in last year’s Report on Accounts. The chart below explains the reasons for that difference. Where increases have been seen DWPas clear plans in place to tackle the levels of fraud and error in Universal Credit. For example, the household composition increase links to the declaration of children in education between the ages of 16 and 18, and DWP has worked with customers to verify or declare a change based on the dataheld. The table outlines the actions taken linked to the increases seen through Universal Credit continuous improvement activity.
Chart Q: Factors contributing to the change in the central estimate of the level of UC expenditure overpaid in 2023 to 2024 between Spring Budget 2023 forecast and the published out-turn
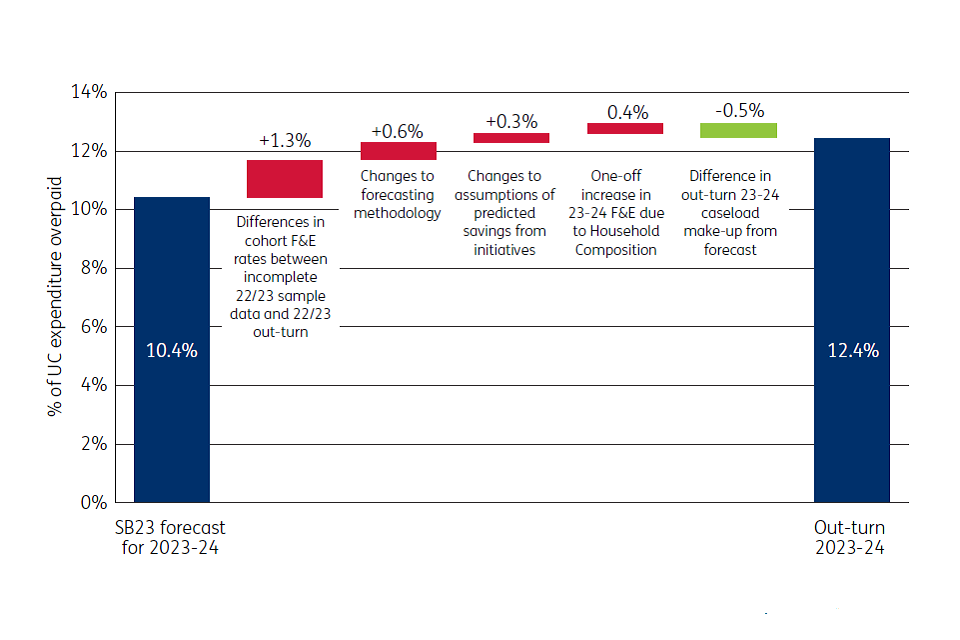
Comparison against Spring Budget 2024 forecast for Universal Credit overpayments
This section focuses on the comparison between the Spring Budget 2024 forecast and the final position for UC overpayments as published in the Fraud and Error National Statistics. In comparison to other metrics, fraud is uncertain because by nature DWP is aiming to forecast what is hidden and secret. Looking ahead, consideration needs to be given to external factors that affect the forecast, including the growing propensity to commit fraud, in addition to accounting for DWP’s work to tackle fraud.
In Spring Budget 2024, the Office for Budget Responsibility agreed the forecast for the rate of overpayments in Universal Credit out to 2028 to 2029. The central estimate of the forecast incorporates an assumption that the underlying propensity for fraud in Universal Credit is increasing by 5% each year. DWP produced confidence intervals around the multi-year forecast, with the lower bound assuming that there will be no increase in the underlying propensity for fraud; the upper bound assuming that it will increase by 10% each year[footnote 35].
Chart R: Spring Budget 2024 UC overpayments forecast showing the upper and lower bounds
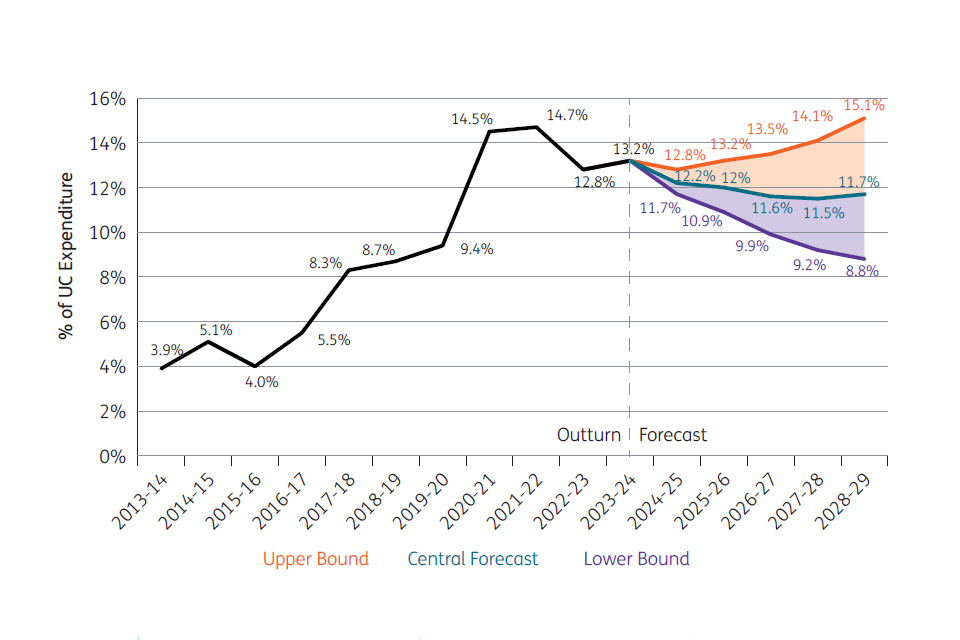
The Spring Budget 2024 multi-year forecast is based on the assumption that the likelihood of overpayments occurring in Universal Credit is different for each work-related conditionality group: some groups tend to have fewer changes in their circumstances than others and hence face a lower risk of overpayments occurring. The baseline level of overpayments will therefore change as the make-up of the Universal Credit caseload is forecast to change over time. The forecast also takes into account the effects of expanding the Targeted Case Reviews team and planned continuous improvements to the design of Universal Credit.
Consequently, the forecast predicts that the long-term trend for overpayments in Universal Credit will likely be downwards, though it is heavily dependent on DWP assumptions around the trend in increasing underlying propensity for fraud.
At the time of the 2024 Spring Budget, the level of overpayments in Universal Credit for 2023 to 2024 was forecast to be 13.2% of Universal Credit expenditure. The estimate for that first year of the multi-year forecast was based purely on early results observed three-quarters of the way through the sampling exercise which informs the annual published National Fraud and Error Statistics - and not based on the modelling that informed the subsequent years of the forecast period.
DWP now knows that those early results were not indicative of the final out-turn position of overpayments for 2023 to 2024, which is 12.4% of Universal Credit expenditure. This is because the sampling at that early stage is not necessarily fully representative of the caseload as a whole and because not all of the cases that had been sampled at that point had yet to have their measurement review completed. DWP was aware of those limitations and tried to take them into account in the Spring Budget prediction of 13.2%, but as the effects are difficult to predict the level was over-estimated.
If DWP had instead taken the 2022 to 2023 position as the starting point and predicted the 2023 to 2024 position based on the forecasting model used to predict all the subsequent years of the multi-year forecast (rather than relying on the early results of the 2023 to 2024 sampling exercise) a level of 11.8% for 2023 to 2024 would have been predicted, were DWP to assume no annual increasing propensity for fraud. If instead it was assumed a 5% increasing in propensity to fraud, as seen in the central estimate of the multi-year forecast, DWP would have predicted a level of 12.3% for 2023 to 2024. This is very close to the final out-turn position of 12.4% of Universal Credit expenditure and supports the assumption that the underlying level of propensity to fraud in Universal Credit is increasing by around 5% a year.
DWP undertook a similar exercise for the previous year too. Had the current forecasting methodology been applied but taken the 2021 to 2022 position (14.7%) as the starting point of the forecast, DWP would have predicted the 2022 to 2023 position to be 12.3% were the assumption to not include annual increasing propensity for fraud, and 12.8% if it was to assume a 5% increase in underlying propensity to fraud - consistent with the out-turn for 2022 to 2023.
DWP ise therefore confident that the latest forecasting methodology is reasonable and that there is justification in assuming a 5% annual increase in the underlying propensity to fraud in Universal Credit each year.
Methodological Change – Unfulfilled Eligibility
DWP carried out a review of the Fraud and Error in the Benefit System Statistics that was referred to in the publication strategy when the 2022 to 2023 statistics were published in May 2023.
One of the changes resulting from this review was to remove claimant error underpayments from the Fraud and Error Statistics publication and reclassify and report this information in a new ‘Unfulfilled eligibility in the benefit system’ publication. This was published on 16 May 2024, alongside the Fraud and Error Statistics.
It is important that the statistics reflect benefits legislation and DWP has made this change to better align these statistics with what constitutes an underpayment and how legislation defines eligibility to benefit payments.
To access benefits, people need to meet certain eligibility criteria and the amount of money they receive depends on their circumstances. DWP requires specific information from claimants to verify and calculate their eligibility. The cases that are being reclassified occur where a claimant is receiving benefits but could have received more if they had provided DWP with accurate, up to date information. This had previously been classified as an underpayment resulting from a claimant error. However, in the benefits legislation it is clear that DWP cannot pay the claimant the higher amount until the correct information has been reported. Therefore, there is no underpayment in these cases. Instead, DWP s reclassifying these cases as cases where there has been unfulfilled eligibility - where the claimant could have received more benefit had they provided the correct information. Further information about this change and these statistics can be found in the financial report section: Unfulfilled Eligibility Statistics.
Monitoring performance and understanding the effectiveness of DWP controls
Setting a New Fraud and Error Target
Consistent with the approach taken by the Department last year in the Annual Report and Accounts, DWP has set an operational target to achieve savings of at least £1.7 billion from dedicated counter fraud and error resource for the financial year 2024 to 2025.
Reviewing the Strategic Controls Framework
Tackling fraud, error and debt is a system-wide challenge which ultimately requires a full-system response. The control measures currently in place are key defences designed to prevent fraud and error entering the benefit system. These controls ensure that DWP pays everyone their correct entitlement.
Earlier within this chapter, it was reported that DWP total controls and counter fraud resource saved the exchequer an estimated £18 billion of losses in 2023 to 2024. In order to build on this impact and further reduce fraud and error, a programme of work is being taken forward to review and improve the DWP controls framework by assessing the adequacy and effectiveness of the control environment, ensuring that it is as robust as possible in light of increasing fraud propensity.
This review will look at the control measures currently in place and test whether they are performing to the highest standards expected and where applicable, to drive improvements. This information will be used to ensure that DWP is delivering existing controls as effectively and efficiently as possible. The review will also identify if DWP could further improve or increase the already high level of controls to respond to the higher risk of fraud.
2. Underpayments
Overview
DWP always looks to address any underpayments at the earliest opportunity. This section (Part 2) of the report describes how this is being done for a number of Legal Entitlements Administrative Practice (LEAP) exercises.
This section covers in more detail the work being done to correct State Pension awards where underpayments have occurred as well as those within disability benefits and means-tested benefits (means-tested benefits can be claimed where customers can demonstrate that their benefit unit’s income and capital fall below a defined financial level.)
The overall rate of underpayments in 2023 to 2024 is 0.4% (£1.1 billion), compared with 0.5% (£1.2 billion) in 2022 to 2023. In UC, the underpayment rate in 2023 to 2024 is 0.3% compared with 0.6% in 2022 to 2023. Housing costs remained one of the largest sources of underpayments in UC. There was a statistically significant decrease seen in the proportion of UC claims underpaid, decreasing from 2 in 100 to 1 in 100.
The overall rate of underpayments for PIP was 0.4% in 2023 to 2024 compared with 0.3% in 2022 to 2023. For DLA the underpayment rate was 1% in 2023 to 2024. Underpayments were predominantly caused by the Department’s own errors when determining the appropriate award levels. The proportion of PIP claims underpaid remains at 1 in 100.
Underpayments are treated seriously and DWP will always look to ensure that individuals receive the correct level of payment.
Official error underpayments
Legal Entitlements and Administrative Practice (LEAP)
Background
A LEAP exercise is relevant when there is an error on the part of a government department, and the error could have deprived a number of individuals of legal rights. From time to time DWP becomes aware of situations where customers have not received what they are entitled to or where DWP has not followed statutory processes. This situation may occur when:
- the Upper Tribunal or a higher court makes a ruling which widens access to benefits for groups of customers
- or there is an error in the implementation of guidance or procedures which has resulted in groups of customers being underpaid.
DWP is required to correct these issues, as soon as is reasonably possible, and the process for doing so is called LEAP.
When a LEAP exercise needs to be undertaken, it is managed by:
- changing the approach so claimants receive the correct entitlement going forward.
- agreeing procedures and instructions for carrying out the LEAP exercise
- conducting an exercise to ensure those who have been underpaid receive what they are entitled to.
Progress continues to be made against each of the LEAPs outlined below and there is ongoing activity to find, review and correct cases where there are errors that have resulted in a customer underpayment. Up to 31 March 2024, DWP paid arrears of £1.12 million with administrative costs of £94.8 million since the commencement of the exercises below.
Corrective action to address (i) State Pension underpayments and (ii) historic recording of Home Responsibilities Protection (HRP) have progressed during 2023 to 2024 and costs are outlined in the table below.
Details relating to the action to address the legacy ESA SDP Premia exercise and explanation relating to publicised figures can be found in this report.
Table S: Live LEAP Exercises
| Name of LEAP Exercise | Nature of the Error | Estimated No. Records to be Reviewed over course of LEAP Exercise | No. of Records Reviewed to 31/3/24 | Total Arrears of Benefit Paid to 31/3/24 |
|---|---|---|---|---|
| PIP Daily Living Activity 9 (MM) | Concerns the definition of ‘social support’ in activity 9 of the PIP regulations, and how far in advance that social support can be provided. | *632,286 | 219,080 | £142 million |
| State Pension Underpayments | Some married individuals, widows/widowers and people who have reached age 80 are being underpaid State Pension because their current payment does not include additional entitlement | 860,271 | 731,717 | £594 million |
| Home Responsibilities Protection (HRP) | Issues identified with cases of State Pension awards which appear to have arisen from historic recording of Home Responsibilities Protection (HRP) (administered by HM Revenue and Customs) on claimants’ National Insurance records. HRP was a scheme to help protect parents’ and carers’ State Pensions, reducing the number of qualifying years needed for the full basic State Pension | Estimate 194,000 | 419 | £2.2 million |
| Disallowed export of non-contributory cash sickness benefits | Whether customers whose benefits were stopped solely because they were moving / had moved their residence to the EEA/Switzerland. | 900 | 408 | £1.5 million |
| Legacy ESA SDP Premia | Errors identified through national statistics in both under and overpayment of Severe Disability Premia payments for ESA claimants. | 172,000 | 141,000 | £379 million |
| Irregular Award of IS | After the introduction of ESA, new claims for IS on the ground of disability were to be treated as claims for ESA save for a number of exceptions. A misunderstanding of the exceptions resulted in some claimants being awarded IS on the ground of disability instead of ESA. As a result, some claimants may have been underpaid. | **35 | 35 | £0.1 million |
| Inherited Pensions | Inherited pensions were not disregarded when claimants made a claim for NSJSA during the Covid pandemic due to easements in processes. | 23,000 | 5,000 | £0.01 million |
To note: The naming convention for LEAP exercises is to use the benefit in question or where the issue has arisen through a legal decision the initials of the individual that brought about the judicial review are also included.
*DWP has identified that 325,867 reviews need to be conducted for claimants who may be affected by the definition of “social support”. There is another group of claimants who might benefit on just the timing part of the judgement (support in advance of the activity). DWP has identified 26,516 terminally ill and deceased claims in this group that need to be reviewed and will contact 279,903 claimants in this group, inviting them to report if they think they are affected by this part of the MM judgement only and want their claim to be reviewed.
**This number excludes dormant and closed cases which the Department is unable to currently estimate.
Table T: Completed LEAP Exercises during 2023 to 2024
| Name of LEAP Exercise | Issue | Customer Records Reviewed | Total Arrears of Benefit Paid |
|---|---|---|---|
| PIP: Daily Living Activity 3 (LB) | Whether medication and monitoring could constitute ‘therapy’ and whether claimants who need additional help with a prescribed diet are eligible for the higher scoring ‘therapy’ descriptors | 203,723 | £0.16 million |
State Pension
Background
State Pension makes up 47% of benefit expenditure. The vast majority of payments are correct, but some people have received less than they should.
The State Pension underpayments most often identified fall into the following broad categories:
- cases covered by the State Pensions Underpayments (LEAP) exercise, where State Pension underpayments may have occurred across certain customer groups.
- Home Responsibilities Protection (HRP) cases, where HRP has not been recorded accurately on National Insurance records - meaning some people have missed out on additional qualifying years of National Insurance towards their State Pension.
This section explains how historic State Pension underpayments are being addressed, before going on to talk more about HRP and National Insurance Credits.
State Pension Underpayment LEAP exercise.
The State Pension LEAP exercise has been established to identify where State Pension underpayments may have occurred in respect of the following customer groups:
- Category BL (Cat BL) – people who are married or in a civil partnership who reached State Pension age before 6 April 2016 and should be entitled to a Category BL uplift based on their partner’s National Insurance contributions.
- Missed conversions – people who have been widowed and their State Pension was not increased to include any amounts they are entitled to inherit from their late husband, wife or civil partner.
- Category D (Cat D) – people who reach age 80 and who are getting some basic State Pension but less than £101.55 (in 2024 to 2025) and may therefore, subject to satisfying the appropriate residency conditions, be entitled to Cat D State Pension of £101.55 a week.
The 2020 to 2021, 2021 to 2022 and 2022 to 2023 Annual Report and Accounts contain details on the scope of the exercise, progress to date and plans to address outstanding work. DWP has regularly published management information on the exercise: State Pension underpayments: progress on cases – GOV.UK (www.gov.uk)
DWP has completed two of the three customer groups: the Cat BL and Cat D cases. Those remaining are cases where DWP is awaiting further information from a customer or a third party, and these will be cleared on receipt. The expectation is for the exercise to be completedor the third group, missed conversions, by the end of 2024.
Customers have up to two years to return information , so there may continue to be a small number of Cat BL and Cat D cases through to 2025 and missed conversions to 2026.
Between 11 January 2021 and the end of March 2024, the checking process has identified 99,558 underpayments, with a total of £594 million owed. The table below shows progress by category.
Table U: State Pension Underpayment LEAP – progress to date
| Category | Cases reviewed (note 1 and 2) | Underpayments identified (note 3) | Average arrears payment (note 4) | Total amount repaid |
|---|---|---|---|---|
| Married (Cat BL) | 318,693 | 43,825 | £5,693 | £245,535,772 |
| Widowed | 323,075 | 22,964 | £12,423 | £281,796,561 |
| Over 80 | 89,949 | 32,769 | £2,196 | £66,693,817 |
Notes to table
1. Cases may be checked for more than one potential cause of error; therefore, an individual State Pension claim may be counted in more than one category.
2. Cases reviewed includes cases which have been deemed out of scope of the LEAP exercise through an automated process.
3. These are cases for which a current or historical underpayment of State Pension has been identified. This may include cases for which a corresponding overpayment of another benefit (for example, Pension Credit) has occurred as a result, meaning that there was no net underpayment to the individual as well as some cases where the customer is deceased, and DWP has so far been unable to identify an estate to which to pay the arrears due.
4. This average includes cases where the arrears amount owed is £0 due to offset of another benefit already paid such as Pension Credit.
Current estimates of the total arrears due is £970 million to 133,000 pensioners and recognised a provision of £369 million, reflecting the outstanding amounts it still expects to repay. Last year it was estimated that DWP underpaid £1.17 billion to 170,000 pensioners. The final total value of the underpayments will only be confirmed by the completion of the exercise.
Home Responsibilities Protection LEAP exercise
Home Responsibilities Protection (HRP) was available between 1978 and 2010 for people in receipt of Child Benefit and those caring for sick and disabled people. For people reaching State Pension age before 6 April 2010, HRP reduced the number of qualifying years needed for a basic State Pension.
Since 2010, HRP has been replaced by National Insurance Credits for Parents and Carers. For people reaching State Pension age after 6 April 2010, all previous years of HRP have been converted into years of National Insurance Credits.
DWP identified some State Pension errors which arose from administrative discrepancies in the recording of some women’s HRP on their National Insurance records. A previous correction exercise between 2009 and 2011 had rectified some errors in this area, however further errors were identified in 2021 to 2022. Most people received HRP automatically where there was a claim for Child Benefit, however, in some cases this has not happened. State Pension eligibility is calculated based on National Insurance records, so this issue has led to underpayments of State Pension.
As it is not possible to identify individuals affected or to correct their records automatically, people who may be affected are identified by HM Revenue and Customs via a scan of their systems, and then invited to make an application to HM Revenue and Customs for any missing HRP years. There is a tool on GOV.UK under ‘Home Responsibilities Protection’ to help people check whether they need to claim. Alongside this, the government is running a communications campaign to increase public awareness to encourage those who receive a letter to take action, and to reach customers who it is not possible to identify through the HM Revenue and Customs scans. This includes messaging on GOV.UK and departmental products, working with third parties, raising the profile via external groups and organisations, and a publicity campaign which includes social media engagement.
Because customers need to apply for missing periods of HRP to be investigated, there is significant uncertainty in the forecasting of the outcomes from the LEAP exercise, including how long it will take. This is because customers may choose not to apply, for example, because they are satisfied with their current position or did not have Child Benefit for a period. As the exercise progresses and more information is gathered, DWP will be able to test assumptions and refine them accordingly. The final value of underpayments will only be confirmed once the exercise has been completed.
It is estimated that DWP underpaid between £520 million and £1,220 million of State Pension because of errors with the recording of HRP. The HRP LEAP exercise is still in its early stages and has not yet generated sufficient or representative data to guide DWP estimates. AME costs are therefore still uncertain and based on indicative data. The sensitivity range around the central estimate is now narrower due to the refinement of using Monte Carlo simulation, considered to be the most appropriate technique given the overall uncertainty inherent across the HRP exercise.
DWP estimates that the number of people impacted by missing HRP State Pension arrears is around 194,000, once adjusted for assumed take-up.
Correction
HM Revenue and Customs started correction activity in Autumn 2023. HM Revenue and Customs contact people who may potentially be affected and invite them to claim for the missing HRP periods. In addition, a communications strategy raises awareness with people who can apply directly to HM Revenue and Customs.
Following the resulting claims being assessed by HM Revenue and Customs, the National Insurance record is updated. DWP is then notified and recalculate State Pension entitlement arising from the updated National Insurance record. This may result in payments of arrears and increase ongoing State Pension payments.
The amount of time it will take to correct records is uncertain. HM Revenue and Customs is taking a proactive approach to correcting records, and DWP will pay any resulting arrears as quickly as possible, taking into account the vulnerability of the customers impacted. The DWP operational plan assumes that correction activity will continue until 2027 to 2028.
Between 8 January 2024 and the end of March 2024, HM Revenue and Customs has corrected records which has led to the identification of 274 underpayments, with payments made totalling around £2.2 million.
Further joint working with HM Revenue and Customs on National Insurance records
DWP and HM Revenue and Customs are working together to review how National Insurance (NI) records and NI credits data is processed between the Departments, focusing on the integrity and transfer of data, plus the processing and accuracy of interactions.
The Joint Oversight Board was created in July 2023, co-chaired by the Department’s Director of Retirement Services, and HM Revenue and Customs’ Director of Operational Excellence. It supports internal assurance across the Departments, taking accountability for the delivery of several cross departmental activities affecting NI records and NI credits. Further details on the remit of the board are included within the Governance statement.
The initial focus has been on clerical and digital interactions between the Departments, reviewing processes, assessing quality, and identifying areas for improvement. Most clerical and digital system interactions between the Departments have been mapped and clerical processes are being reviewed including service level agreements, how DWP can better prioritise, and making data exchanges more streamlined. Digital and clerical interactions with the NI records are also being reviewed, including an end-to-end review of instructions, guidance, and training.
HM Revenue and Customs has provided the Department with a letter of assurance containing detail of its capacity to handle risk and highlighting any significant issues that may impact their control and management of the NI Fund and related activities.
Legacy ESA SDP Premia
Employment and Support Allowance was introduced in 2008 and has two strands, income-related and contributory. Income-related ESA is paid at different rates depending on an individual’s household circumstances and stage of the claim process. Flat rate premiums may be paid for groups in receipt of income-related ESA who are recognised as having additional needs - for example, carers, severely disabled people and people over State Pension age. These premiums should be paid without being claimed once entitlement has been confirmed. But to enable this, customers are required to provide up-to-date information to on their individual circumstances for example, the number of non-dependents living in their household.
In practice although in some cases the information required can be found on DWP systems, there is often a requirement for further information from customers on their current circumstances to confirm their entitlement. As a result, these customers have missed out on additional premiums alongside their benefit award.
DWP will be undertaking this activity alongside Move to UC planning to ensure that it is aligned and to ensure no inter-dependencies manifest themselves.
DWP is working to both correct existing errors and to prevent errors in new premia cases. Current estimates show that there are 31,000 referrals to be cleared. The total arrears paid to customers as part of this exercise is £379 million and DWP intends to finish work to correct these errors by 2025.
Universal Credit National Insurance Credits
Some people who received Universal Credit may not have had their National Insurance Credits correctly attributed to their National Insurance record held by HM Revenue and Customs, which could affect their State Pension. Between 2017 to 2018 and 2022 to 2023 information about Universal Credit entitlements could not be processed by the National Insurance Recording System.
With the issues now resolved between DWP’s and HM Revenue and Customs’ systems, claims data relating to the affected years are being successfully processed by HM Revenue and Customs. When these records are updated, information will be sent to DWP, and then any State Pension awards that are affected will be corrected. DWP experts to complete this activity by the end of 2024. In future Universal Credit claim data will be transferred as part of a business as usual process.
Table V: Universal Credit National Insurance Credit Cases
| Number of UC Customer Records Reviewed (up to 31/3/2024) | Total Arrears of Benefit Paid (up to 31/3/2024) |
|---|---|
| 13,788 | £4.5 million |
3. Debt Recovery
Overview
This section looks at how DWP’s Debt Management Unit recovers money.
The Debt Management Unit continues to recover debt when it is identified, including benefit overpayments, Tax Credit debt and Social Fund loans. The Debt Management Unit also continues to recover money from insurance companies (where people have received compensation for an accident, injury or disease having already claimed benefits) and on behalf of the NHS (where ambulance or hospital costs have been incurred in connection with an accident).
Recovery totals
DWP recover significant sums of money for the exchequer responsibly and sustainably.
Debt Management Unit’s total recovery in 2023 to 2024 amounted to £2.81 billion (excluding Housing Benefit recovered by local authorities but including £46 million Housing Benefit debt recovered by DWP).
This figure is up from £2.74 billion in 2021 to 2022 and £2.68 billion in 2022 to 2023.
DWP’s overall approach to recovery continues to demonstrate a balance between the need to protect public funds by maintaining recovery levels, while providing a compassionate service to all customers regardless of their circumstances.
2023 to 2024 recovery
The table below sets out total recoveries for 2023 to 2024 and shows the breakdown between benefit overpayments and other debt types. 78% of recoveries are via deductions from benefit, where there are maximum deduction limits in place – for example, in Universal Credit deductions are limited to 25% of the Standard Allowance.
Table W: Debt Management Recovery 2023 to 2024
| Debt Type | Definition | 2021 to 2022 Value (£ million) | 2022 to 2023 Value (£ million) | 2023 to 2024 Value (£ million) |
|---|---|---|---|---|
| Advances | Recovery of Universal Credit Advances – including Budgeting Advances, New Claim Advances and Benefit Transfer Advances | 882 | 851 | 934 |
| Overpayments | Benefit overpayments including Universal Credit and non-Universal Credit | 610 | 692 | 769 |
| Tax Credit | Recovery of Tax Credit debt that has migrated from HM Revenue and Customs | 520 | 428 | 390 |
| Social Fund | Recovery of Crisis and Budgeting Loans, including Funeral Payments | 367 | 342 | 310 |
| Compensation Recovery | Recoveries from insurance companies for compensation claims made by benefit recipients | 295 | 303 | 324 |
| Housing Benefit | Housing Benefit Overpayments | 48 | 44 | 46 |
| Recoverable Hardship Payments | Repayment of loans associated with sanction activity | 6 | 18 | 26 |
| Other | Includes administrative and civil penalties. Also includes sums held in suspense awaiting allocation at the time the data was collected | 7 | 6 | 15 |
| Total | 2,736 | 2,683 | 2,814 |
Note: Totals may not sum due to rounding.
Supporting customers with outstanding debts
DWP supports customers who may be in hardship and struggling with repayments.
DWP continues to directly support customers by working with them to agree lower and affordable repayment terms. DWP policy is that repayment plans should be affordable and sustainable. When a customer makes contact because they are experiencing financial hardship, the rate of repayment can be reduced or, depending on the customer’s financial circumstances, a temporary suspension of repayment can be agreed. People are not pressured to pay more than they can afford.
DWP has updated notifications to make sure customers are aware that they can request a reduction in their terms. Calls into Debt Management’s service to discuss terms can be lengthy: colleagues support customers to review their financial circumstances, often going through their income and expenditure in detail to find the right rate of repayment for them. Negotiations are based on the individual circumstances and not the amount owed. There is no minimum rate of repayment a customer is required to pay (although in fraud cases, repayments can only be reduced in exceptional circumstances, or where there are children in the household). In exceptional circumstances, and in line with legislation and policy, consideration can be given to waiving a debt – with each case considered on its individual merits.
DWP has maintained a review period of two years for customers with a negotiated affordable repayment rate (this was increased from six months in June 2022); however, customers may contact the Department at any time to re-negotiate affordable repayment terms.
DWP does not capture data on exactly why people seek a lower rate of repayment: it is a question of their individual circumstances. Typically, a person will simply say that they cannot afford the suggested rate.
DWP seeks to ensure that everyone is aware of their options and can make an informed decision on whether they ask for a reduction in their repayment terms; in some cases, the amount deducted to repay an overpayment may have reduced as a result of other, higher priority, deductions and a person may be comfortable with the lower rate of the overpayment deduction resulting from this.
Supporting the most vulnerable
Safeguards are in place to help protect vulnerable customers.
DWP has a network of Advanced Customer Support Senior Leaders who work with the Debt Management Advanced Customer Support team to provide additional support to the most vulnerable customers, together with a process by which colleagues can refer customers directly through the Severe Financial Hardship routeway.
In addition, Debt Management works in partnership with the Money Adviser Network (MAN), which offers free professional independent and impartial money and debt advice. Indebted customers are routinely offered a referral to this service.
Recent independent research has indicated that MAN continues to serve an important function, providing customers with access to invaluable advice and support that may otherwise be beyond their reach. DWP remains committed to HM Treasury’s Breathing Space policy.
DWP involvement with Customer Service Excellence is a longstanding commitment. This is an assessment against the specified criteria of the standard by an independent certification body. DWP had been accredited for 13 continuous years in 2023, and continue to use the Standard as a continuous improvement tool. DWP continues to deal with the financial challenges that may be faced by customers. This year’s feedback commended the Department’s positivity, listening, caring, understanding, empathy and outstanding compassion, particularly in relation to vulnerable customers.
It was recognised that Debt Management have a number of key and supportive processes and structures in place that have contributed to providing customers with the best possible experience.
Means of recovery
Recovery from benefit is the most efficient means of recovery.
Last year, 78% of total recoveries were made through deductions from benefit, up from 75% in 2022 to 2023. The overall amount DWP can recover by deduction from benefit is set by regulations, and priority is given to a number of other deductions above those for overpayment recovery. Deductions from benefit remains the main source of recovery.
Out of a total of 5.2 million accounts held by Debt Management, the number of customers currently in active recovery is 3.9 million (75.3%) compared to 3.7million (75.4%) last year.
Table X: Recovery breakdown
| Recoveries by Method | 2021 to 2022 Value (£ million) | 2022 to 2023 Value (£ million) | 2023 to 2024 Value (£ million) |
|---|---|---|---|
| Deductions from Universal Credit | 1,492 | 1,385 | 1,520 |
| Deductions from Other Benefits | 173 | 185 | 205 |
| Direct Earnings Attachments (deduction from earnings) | 116 | 137 | 112 |
| Private Sector Suppliers | 3 | 15 | 3 |
| Voluntary Repayments | 357 | 378 | 383 |
| Social Fund Repayments (primarily deductions from legacy benefits) | 301 | 279 | 267 |
| Recovery from Awards of Compensation | 295 | 303 | 324 |
| Total | 2,736 | 2,683 | 2,814 |
Note: Totals may not sum due to rounding.
Debt stock
The debt stock will increase as a result of continued focus on high-risk fraud and error, Targeted Case Reviews and an increase in Tax Credit debt transferred across as people claim Universal Credit.
During 2023 to 2024 the total debt stock has increased by £0.5 billion (this is actual money recorded as outstanding for collection, as opposed to the estimated figures itemised in the fraud and error publication). The amount recorded by Debt Management differs significantly from the estimated overpayment figures published. This is because recovery can only be attempted where a specific overpayment is detected and referred to Debt Management, and not all overpayments are detected. There has been £3.0 billion of detected overpayments added to the debt stock in 2023 to 2024.
The debt stock currently includes £2.4 billion of Tax Credit debt as at the end of 2023 to 2024, a decrease from £2.5 billion at the end of 2022 to 2023.
Under an agreement with HM Revenue and Customs, any outstanding debt held by an individual is transferred to DWP should that person claim Universal Credit. From April 2016 to March 2024, £3.9 billion of Universal Credit-related Tax Credit Debt has been transferred to DWP for recovery. In 2023 to 2024 DWP recovered £390 million of Tax Credit debt, down from £428 million in 2022 to 2023.
This was largely due to a return to normal levels of referrals from HM Revenue and Customs following the inflated number received during 2021 to 2022 as a result of the pandemic. It is also due to the ending (in May 2022) of the formal agreement announced by the then Secretary of State in February 2017 to refer debtors who are not in receipt of Universal Credit to the Department for recovery through Direct Earnings Attachment.
Current forecasts indicate that by the time Universal Credit rollout ends approximately £4.4 billion of Tax Credit debt will have transferred to Debt Management for recovery.
At the end of 2023 to 2024 there were 5.2 million accounts held by Debt Management with a balance totalling £9.4 billion (this includes outstanding Universal Credit Advances of £1.7 billion) and 0.3 million accounts on the Social Fund system with a balance of £0.1 billion.
Table Y: Summary of debts referred to Debt Management
New Debts Referred
| Financial Year | Debts 2021 to 2022 | Values 2021 to 2022 | Debts 2022 to 2023 | Values 2022 to 2023 | Debts 2023 to 2024 | Values 2023 to 2024 |
|---|---|---|---|---|---|---|
| Debt Mgt. Core Recovery | 5.5 million | £3.8 billion | 4.7 million | £3.2 billion | 5.0 million | £3.0 billion |
| Social Fund | 0.2 million | £0.03 billion | 0.1 million | £0.02 billion | 0.4 million | £0.06 billion |
| Total | 5.7 million | £3.8 billion | 4.8 million | £3.2 billion | 5.5 million | £3.1 billion |
Notes: Totals may not sum due to rounding.
The figures have been derived from debts when they are referred to Debt Management and will not match with the debt figures shown in the Statement of Financial Position, which include data not captured in the table above, such as certain types of write offs, small overpayments and other non-recoverable debts which are written off at source.
Table Z: Summary of debt stock
Debt Stock
| Date | Debtors March 2022 | Values March 2022 | Debtors March 2023 | Values March 2023 | Debtors March 2024 | Values March 2024 |
|---|---|---|---|---|---|---|
| Debt Mgt. Core Recovery | 4.9 million | £8.1 billion | 4.9 million | £8.9 billion | 5.2 million | £9.4 billion |
| Social Fund | 0.4 million | £0.1 billion | 0.3 million | £0.1 billion | 0.3 million | £0.1 billion |
| Total | 5.3 million | £8.2 billion | 5.2 million | £9.0 billion | 5.4 million | £9.4 billion |
Notes: The figures provided are a snapshot as at the end of March in each of the years shown. Totals may not sum due to rounding.
Table AA: Debt stock breakdown
Debt Stock Breakdown
| Debt Type | March 2022 Value (£ billion) | March 2023 (£ billion) | March 2024 (£ billion) |
|---|---|---|---|
| Overpayments | £3.6 billion | £4.4 billion | £4.9 billion |
| Advances and Hardship | £1.3 billion | £1.5 billion | £1.7 billion |
| Tax Credit | £2.7 billion | £2.5 billion | £2.4 billion |
| Housing Benefit | £0.3 billion | £0.3 billion | £0.3 billion |
| Social Fund (DM) | £0.2 billion | £0.1 billion | £0.1 billion |
| Social Fund (SFCS) | £0.1 billion | £0.1 billion | £0.1 billion |
| Total | £8.2 billion | £9.0 billion | £9.4 billion |
Notes: The figures provided are a snapshot as at the end of March in each of the years shown.
Totals may not sum due to rounding. Data Source: AID BO Reports and SF Dashboard Excludes DfC/N Ireland Data is up to the end of March 2024. Individuals may be on both Debt Management and Social Fund systems, meaning that the total number of debtors is an over-estimate.
Efficiency
The Debt Programme continues to develop a self-service channel (Repay and Manage Benefit Money You Owe), which is a new customer-facing service allowing debtors to manage their debt online. The service is currently available to debtors at the point that they leave benefit and includes functionality that allows people to view their debt, set up repayment plans, and manage their repayments based on what they can afford without needing to make contact. Self-service support is also being offered to a growing number of people who are in receipt of DWP benefits. To date, over 2.1 million customers have been given the opportunity to access the service with recoveries totalling £148 million.
Developing a better understanding of the effectiveness of DWP debt recovery processes, policies and legislative powers led to the development of a Debt Enforcement Function. This targets debtors who are not in receipt of benefit, and not making repayments, who can repay but decline all requests to do so. The service was set up in February 2022: to date, 43,770 customers have been contacted and 8,479 plans have subsequently been set up, with recoveries worth £2.6 million.
Sustainability Report
The sustainability report provides a summary of DWP sustainability performance over 2023 to 2024.
Embedding sustainability
The Department recruited a dedicated Sustainability Engagement Manager to encourage action from colleagues across the Department to reduce consumption and improve sustainability, increase discussion and events, and enhance communication between sites and sustainability teams.
The number of Sustainability Champions has almost doubled. Research has been carried out into colleague attitudes around sustainability which is used to help understand the culture of and to continue embedding sustainability at DWP. This will support the Department in meeting Greening Government Commitments targets.
Net Zero carbon
DWP Estates has continued its delivery of decarbonisation and energy efficiency projects over the year, including:
- LED lighting replacement at 40 sites
- Upgrade and centralisation of building management systems at 65 sites and optimisation of building controls at a further 27 sites to ensure more efficient settings, improving comfort for building users and reducing energy use
- Low carbon surveys at 20 sites to prepare for decarbonisation grant funding bids and to identify projects for incorporation into DWP’s lifecycle works programme
- Heat decarbonisation at 30 sites: 14 as part of the grant-funded Public Sector Decarbonisation Scheme delivered over 2 years, and 16 additional sites via lifecycle works
- Continued collaboration with the Government Property Agency (GPA) on a range of energy efficiency measures across 11 DWP sites as part of its Net Zero Programme.
Additionally, an estates-specific Net Zero Roadmap has been developed to provide a detailed plan for decarbonisation of the estate up to 2050, which will guide future interventions and funding bids.
Ultra Low Emission Vehicles
The strategy for meeting the December 2027 target of 100% of central government cars and vans to be fully zero emission continues to be reviewed . Despite challenges with EV infrastructure, at the end of December 2023 67% of DWP fleet vehicles were ultra low emission, including those on order. This includes zero emission vehicles, which make up 18% of the Department’s fleet.
Workplace Transformation
The Workplace Transformation strategy continues to help reshape how services are delivered as the Department transitions to an estate that is smaller, greener, and better. Initiatives delivered this year include:
- investing to improve the environment at 17 office sites, including the installation of LED lighting
- feasibility continued on 28 sites to determine improvements required
- installation of 160 Electric Vehicle charging points at 82 sites
- divestment and consolidation of a range of different sites.
Reducing water use on DWP estates
Water efficiency surveys were undertaken at 30 of the highest consuming sites: combined, these represent approximately 30% of total estate water use. Subsequently, water saving devices were installed such as low flow taps, new shower heads and waterless urinals to reduce water use.
Waste management
Several initiatives minimised waste and promoted resource efficiency this year, including:
- replacement of paper hand towels with energy efficient hand dryers in washrooms at 43 sites
- a food waste bin trial at 3 sites to assess the volume of food waste collected, and associated impacts of introducing additional bins before rolling out to further sites
- updated internal and external bin provision in DWP’s Welsh sites to align with changes to waste legislation effective from 6 April 2024.
Consumer single use plastics
Low numbers of single use plastic items were maintained following a significant reduction last year and the Department continued a number of initiatives to reduce these:
- roll-out of a reusable cup scheme at all catered sites following the successful trial in 2022 to 2023, which is estimated to remove approximately 240,000 single use plastic cups annually - the second most used single use plastic item
- the internal ‘DWP Swap Shop’ scheme which continues to be used to share surplus equipment (primarily stationery) between colleagues to avoid waste and unnecessary cost.
Sustainable procurement
In 2023, revisions began of the DWP Subject Matter Experts Action Plan for publication in 2024 with updates including reporting progress on previous commitments and setting out new activities. (2023 to 2024 data will not be available until 2024 to 2025).
DWP commercial Policy Group works with counterparts across government and with Cabinet Office to develop and implement new commercial policies. Activities during 2023 to 2024 include developing new environmental ‘Carbon in Contracts’ clauses which will offer modernised emissions targets and prepare for the introduction of Transforming Public Procurement (TPP, formerly known as Reform). This, expected to go live in autumn 2024, is aimed at simplifying commercial processes, embedding transparency, and opening up more procurements to new entrants, such as small businesses and social enterprises.
The Department’s Commercial Directorate (CD) continues to exclude suppliers from bidding in a procurement over £5 million if they fail to provide standard carbon reduction plans supporting Carbon Net Zero by 2050.
The Department continued to include social value criteria in new procurements. This means delivering added value through its contracts which benefit citizens and communities. In 2023 to 2024, DWP implemented a new approach which prioritises criteria which deliver ‘Tackling Economic Inequality’ and ‘Equal Opportunity’ outcomes. These secure extra supplier commitment to providing added social value under the contract, such as jobs or skills to deprived groups, opening opportunities to small businesses in the supply chain, or helping tackling employment barriers to disabled citizens.
In line with the DWP modern slavery statement, the Department conducts upfront risk assessments to determine whether extra evaluation criteria are required in a procurement and require suppliers to complete a self-assessment tool.
Nature recovery
DWP has a predominantly urban estate with limited leased land holdings. However, it has been implementing recommendations from the biodiversity review and nature recovery plan (based on a natural capital approach) that was completed in 2022 to 2023. This has included:
- working with the facilities management supplier to improve ground maintenance activities to better conserve and enhance biodiversity
- design and installation of sensory gardens at 2 sites to provide benefit to both nature and colleague wellbeing
- the installation and maintenance of bat and bird boxes at sites and no mow May where appropriate.
Climate change adaptation
The Department has continued to implement the actions highlighted in its climate change action plan and flood risk review and to embed actions into the Riskonnect system which is available for all sites as part of their business continuity plans. DWP also feed this information into national power outage reports and planning.
Examples include:
- completion of 41 flood plans at sites most at risk of flooding, delivered over 2 years
- creation of an automated report for DWP sites based on Environment Agency alerts, which shows the impact of flood alerts on the number of sites, number of staff affected at each site, flood data and if there is a trigger for a power outage. This enables better planning for flood risk events.
- ensuring that DWP is signed up to the relevant warning systems available for flooding, and hot and cold weather.
DWP attends Defra’s Climate Change Integrated Review Implementation Group (IRIG) – Adaptation Subgroup. This supports the response of government departments to the climate change risks identified within the UK’s 3rd Climate Change Risk Assessment (CCRA3).
Digital
DWP worked with Defra and other government departments to:
- baseline and report emissions from DWP’s ICT infrastructure via Defra’s Sustainable Technology Assurance and Reporting (STAR) group, covering hardware, hosting, networking, and hardware lifecycles
- assist the Government Digital Sustainability Alliance (GDSA) on Planetary Impacts and Scope 3 reporting
- develop methodology for emissions measurement and reporting at service level
The Department also:
- worked closely with major suppliers to improve the quarterly review process of social value deliverables. The Department worked with many of its large suppliers to agree sustainability opportunities such as expert-led talks, training opportunities and reporting improvements
- introduced a Power BI dashboard for printing volume at local offices to support print reduction campaigns
- began developing a sustainability technology radar and learning pathways for digital roles
- continued working with DWP’s ALBs to gather data for STAR
- supported sustainability aspects in the Contact Centre Modernisation Programme (CCMP) and Synergy programme through advisory and bid evaluation roles.
Policy
At the end of 2023, the Department implemented a new environmental legal duty that requires ministers to have due regard to an environmental principles policy statement when making policy.
DWP is also undertaking a post-implementation review of the regulations, introduced in 2021 to 2022, which ensured pension schemes both meet climate change governance requirements and report on how they have done so. Along with The Pensions Regulator, DWP continue to monitor schemes’ compliance with the regulations, including the recent requirement to report a pension scheme’s portfolio alignment with the Paris Agreement goal of limiting global warming to 1.5 degrees.
DWP has continued to play a key role as part of the cross-government and industry Green Jobs Delivery Group (GJDG), particularly in the development of the Green Jobs Plan and an industry charter due for publication in the first half of 2024.
The Department continually aims to identify where it can adapt and enhance support for jobseekers, workers and employers to remove barriers to a green jobs transition. Part of this includes:
- work coach interventions to support identification of green job opportunities
- targeted provision such as Sector-based Work Academy Programmes
- referring people to Skills Bootcamps and Apprenticeships
- ensuring the right skills and wider employment support are in place.
DWP’s Train and Progress (TaP) provides access to work-focused training and skills programmes. The core purpose of TaP is to enable Universal Credit claimants across Great Britain to take part in full-time work-related training opportunities available for up to 16 weeks, from an initial 8 weeks. Opportunities include Department of Education funded Bootcamps, and free courses for Level 3 jobs and equivalent delivered by the Scottish and Welsh governments.
The DWP National Employer and Partnership Team (NEPT) has used employer and partner expertise to create digital resources for work coaches and employer advisors, so they are aware of the green job opportunities available to claimants. NEPT is also refreshing the Department’s knowledge pages, so its people have access to the most up to date information and links to provide a greater understanding of the sector.
DWP continues to be committed to exploring how it can better consider Net Zero and environmental goals when designing future labour market policies and interventions.
Rural proofing
The employer and partnership teams continue to work closely with customers, employers and partners to help fill vacancies from large scale employers to micro businesses in rural areas.
To combat poor transport links, DWP continues to work closely with local councils and teams to identify and provide local minibus services to customers living in rural areas, as well as launching outreach services to young individuals affected by poor transport links.
Local jobcentres have the flexibility to work alongside national or local organisations to help meet the needs of their communities, and have the opportunity to select the most appropriate channel through which to engage with customers. For example, the use of video appointments is an option for customers living in rural areas.
Sustainable construction
All construction and refurbishment works must comply with DWP Design Standards, which include a dedicated section on sustainability. All new build projects are required to achieve Building Research Establishment Environmental Assessment Methodology (BREEAM) Excellent, a score that indicates how sustainable the build is. All major refurbishments are required to achieve BREEAM Very Good.
This year the Department has implemented a new Design Standards Compliance Form to check that projects are meeting the required standards, and have undertaken training for project management teams and supplier partners to ensure greater understanding of the sustainability requirements in design and construction.
Taskforce on Climate-Related Financial Disclosures (TCFD) Compliance Statement
DWP has reported on climate-related financial disclosures consistent with HM Treasury’s TCFD-aligned disclosure application guidance which interprets and adapts the framework for the UK public sector.
The Department has complied with the TCFD recommendations and recommended disclosures around:
- governance (all recommended disclosures – see Taskforce on Climate-Related Financial Disclosures (TCFD) Disclosure of Governance Arrangements)
- metrics and targets (disclosures (b) – see Greening Government Commitments)
This is in line with HM Treasury’s TCFD-aligned disclosure implementation timetable.
DWP plans to make disclosures for strategy, risk management, and metrics and targets disclosures (a) and (c) in future reporting periods in line with the HM Treasury implementation timetable.
Taskforce on Climate-Related Financial Disclosures (TCFD) Disclosure of Governance Arrangements
DWP governance arrangements on sustainability and climate are as follows:
- chaired by the Sustainability Senior Responsible Officer and with the Sustainability Strategy Team as secretariat, DWP’s Senior Civil Servant-level Sustainability Leadership Forum, and its working group, is convened on a quarterly basis. In these meetings, key focuses are sustainability and climate strategy, performance and risk.
- there are dedicated sustainability teams, who have active roles in managing sustainability and climate-related issues, within the Department’s Corporate Transformation and Digital groups
- since June 2023, sustainability and climate risk is reported on monthly by the Sustainability Strategy Team as a ‘keep in view’ risk to the DWP Risk Assurance Board
- the Sustainability Strategy Team reports to the Executive Team (ET) on sustainability and climate on an ad hoc basis, when for example a decision from ET is required. Two such meetings were held in 2023 to 2024.
- at Departmental Board level, there is a Sustainability, Net Zero and Climate non-executive Director
- information from various sources is used, including the Cabinet Office National Security Risk Assessment and Cabinet Office Briefing Rooms Unit 6-monthly Forward Look, to assess the risks of relevant climate and environmental UK risks that could have direct or secondary impact on DWP’s priorities. This intelligence is used to develop and review resilience and response planning for risks such as flooding, storms, snow and ice, heatwaves and droughts.
- DWP also work with lead government departments to collectively review risks and complete commissions, assessing impacts and mitigation planning, based on loss of people, premises, providers and processes.
Arm’s length bodies
In 2022 to 2023, the DWP Sustainability Strategy team established the DWP Arm’s Length Body (ALB) Sustainability Working group, which is convened on a quarterly basis to ensure that the Department continues to engage with DWP ALBs on reporting processes, and work collaboratively to share knowledge and ensure best practice.
The ALBs have shown increasing ambition on sustainability and contribute to carbon reductions reported by the Department via the Greening Government Commitments.
Procurement of food and catering
DWP has 10 catered sites. All food and catering services are provided through the facilities management contract and comply with the Government Buying Standards for Food and Catering. DWP’s catering supplier is a signatory of the ‘Step up to the Plate’ pledge, UK Food Waste Roadmap and WRAP Courtauld Commitment 2025.
UN Sustainable Development Goals
The Strategic Outcomes and Delivery Objectives summary tables in the Performance Overview provide more information.
Greening Government Commitments (GGC): assessing DWP’s progress
DWP continued to support the government’s commitment to reduce its impact on the environment. The table below gives a summary of progress since 2017 to 2018 and reports against the government targets published in 2021. Note that this data excludes ALBs and is for DWP only. The Department’s full GGC return to Defra includes both DWP and ALBs.
Table 1 – DWP Performance against Greening Government Commitments[footnote 36]
Reduce Overall Greenhouse Gas Emissions by 45% and Direct Greenhouse Gas Emissions from Estate and Operations by 17% from a 2017-18 Baseline by 2024 to 2025.
| 2017 to 2018 Baseline | 2021 to 2022 Performance | 2022 to 2023 Performance | 2023 to 2024 Performance | Reduction against baseline year | |
|---|---|---|---|---|---|
| Total Greenhouse Gas Emissions TCO2e | 108,167 | 78,543 | 74,852 | 63,203 | -42% |
| Scope 1 Carbon Emissions – Direct Emissions from Owned or Controlled Source TCO2e | 41,345 | 44,631 | 40,072 | 31,926 | -23% |
| Gas Consumption kWh | 196,603,589 | 239,458,080 | 210,262,556 | 163,743,017 | – |
| Oil Consumption kWh | 4,579,998 | 2,542,519 | 2,617,387 | 2,253,006 | |
| Scope 2 Carbon Emissions – Indirect Emissions from the Generation of Purchased Electricity Consumed TCO2e | 50,839 | 29,757 | 28,154 | 23,950 | – |
| Electricity Consumption kWh | 144,511,209 | 139,594,282 | 145,586,579 | 114,780,963 | – |
| Purchased Heat via District Heat Networks kWh | 246,141 | 3,224,085 | 5,405,999 | 5,066,079 | – |
| Scope 3 Carbon Emissions – Other Indirect Emissions that Occur in DWP’s Value Chain TCO2e (GGCs cover Scope 3 business travel + electricity transmission and distribution only) | 15,983 | 4,156 | 6,627 | 7,327 | – |
| Distance Travelled by Domestic Business Flights (km) | 2,142,833 | 164,998 | 803,050 | 1,292,246 | – |
| Emissions from Domestic Flights (tonnes) | 303 | 21 | 104 | 208 | -31% |
| Total Number of Domestic Business Flights | – | – | – | 1,982 | – |
| Distance Travelled by International Business Flights (km) | 817,234 | 44,861 | 716,558 | 810,978 | -1% |
| Distance Travelled by International Business Flights (short haul, km) | 265,159 | 22,598 | 100,684 | 262,679 | -1% |
| Distance Travelled by International Business flights (long haul, km) | 552,075 | 22,263 | 615,874 | 548.298 | -1% |
Meet the Government Fleet Commitment for 25% of the Government Car Fleet to be Ultra-Low Emission Vehicles (ULEV) by 31 December 2022, and for 100% of the Government Car and Van Fleet to be Fully Zero Emissions at the Tailpipe by 31 December 2027.
| 2017 to 2018 Baseline | 2021 to 2022 Performance | 2022 to 2023 Performance | 2023 to 2024 Performance | Reduction against baseline year | |
|---|---|---|---|---|---|
| Fleet Percentage Categorised as Ultra-Low Emission Vehicles (includes vehicles on order) | 0% | 0% | 33% This data is as at 31 December 2022 | 67% | |
| Fleet Percentage Categorised as Zero Emission Vehicle (includes vehicles on order) | 0% | 0% | 9% This data is as at 31 December 2022 | 18% |
Reduce the amount of waste DWP generates by 15% from a 2017 to 2018 Baseline by 2024 to 2025.
| 2017 to 2018 Baseline | 2021 to 2022 Performance | 2022 to 2023 Performance | 2023 to 2024 Performance | Reduction against baseline year | |
|---|---|---|---|---|---|
| Total Waste Arising (tonnes) | 10,121 | 5,872 | 6,995 | 7,595 | -25% |
| Total Waste Recycled (tonnes) | 6,774 | 3,300 | 4,310 | 5,090 | |
| Total ICT Waste Recycled, Reused and Recovered Externally (tonnes)[footnote 37] | No data | No data | 49 | 52 | |
| Total Waste Composted / Food Waste (tonnes) | No data | 12 | 10 | 14 | |
| Total Waste Incinerated for Energy Recovery (tonnes) | No data | 2,505 | 2,417 | 2,317 | |
| Total Waste Incinerated without Energy Recovery (tonnes) | No data | 0 | 0 | 0 | |
| Total Waste to Landfill (tonnes) | 3,347 | 67 | 268 | 189 | |
| Percentage of Total Waste Recycled | 67% | 56% | 62% | 67% |
Reduce the amount of paper used by 50% from a 2017 to 2018 Baseline by 2024 to 2025.
| 2017 to 2018 Baseline | 2021 to 2022 Performance | 2022 to 2023 Performance | 2023 to 2024 Performance | Reduction against baseline year | |
|---|---|---|---|---|---|
| A4 (Reams)[footnote 38] | 600,101 | 147,360 | 167,864 | 167,667 | -72% |
| A3 (Reams)46[footnote 39] | 2,165 | 555 | 1,245 | 892 | -59% |
Reduce Water Consumption by at least 8% from a 2017 to 2018 Baseline by 2024 to 2025.
| 2017 to 2018 Baseline | 2021 to 2022 Performance | 2022 to 2023 Performance | 2023 to 2024 Performance | Reduction against baseline year | |
|---|---|---|---|---|---|
| Total Water Consumption (m3) | 676,727 | 562,911 | 550,323 | 410,926 | -39% |
Table 2 – DWP Sustainability related Financial Disclosures
| Financial information | 2021 to 2022 Performance | 2022 to 2023 Performance | 2023 to 2024 Performance |
|---|---|---|---|
| Gross expenditure on the purchase of energy | £28,804,079 | £40,800,265 | 36,585,285 |
| Reported Areas of Energy Gas | £6,869,380 | £13,243,435 | £7,584,354 |
| Reported Areas of Energy Oil | £195,982 | £291,568 | £200,438 |
| Reported Areas of Energy Electricity | £21,464,200 | £26,954,889 | £28,414,786 |
| Reported Areas of Energy Heat | £274,517 | £310,373 | £385,706 |
| Expenditure on accredited offset purchases | £0 | £0 | £0 |
| Total Expenditure on Official Business Travel | £6,233,777 | £13,111,999 | £21,246,432 |
| Total Expenditure on Waste | £1,697,080 | £1,885,630 | £1,712,460 |
| Total Expenditure on Waste Recycled | £1,000,751 | £986,934 | £922,929 |
| Total Expenditure on Waste Sent to Landfill | £78,111 | £69,628 | £53,678 |
| Total Expenditure on Composted / Food Waste | No data | £3,573 | £3,367 |
| Total Expenditure on Waste Incinerated | £614,561 | £807,581 | £727,649 |
| Total Expenditure on ICT Waste Recycled, Reused and Recovered (externally)[footnote 39] | No data | £198,980 | £208,954 |
| Paper Costs (inc. VAT) | £362,429 | £543,376 | £666,141 |
| Total Water Cost (inc. Water and Sewerage Costs) | £2,750,275 | £2,375,458 | £2,203,265 |
Sir Peter Schofield KCB
Permanent Secretary
Accountabilty report 2023 to 2024
The Accountability report sets out how DWP meets the key requirements to Parliament. It is broken down into three areas:
- the Corporate Governance Report which provides an overview of the Department’s leadership and risk management approach
- remuneration and staff report which details remuneration and staff expenses and policies
- Parliamentary accountability which contains the Statement of Outturn against Parliamentary Supply, associated notes, and audit certificate
Corporate Governance Report
The purpose of the Corporate Governance Report is to explain the composition and organisation of the Department’s governance structures and show they support the achievement of the Department’s objectives.
Lead non-executive member’s report
In January 2024, I was officially appointed the Department’s Lead non-executive Director, having held the position on an interim basis for the previous 16 months. I am delighted to continue helping the Secretary of State and the Permanent Secretary.
I would like to welcome Gina Radford, Charlie Steel and Arabel Bailey as new non-executives for the Department. Each of them brings valuable external expertise to provide supportive challenge and advice to ministers and the Executive Team. Their positive impact has been felt within the Department and they have already become trusted advisors amongst senior executives and ministers.
During the last year, the Departmental Board and non-executive directors have had a determined focus on guiding the Department to reach its strategic outcomes. We pivoted the focus of the board to better support and advise on strategic issues linked to the development and implementation of the government’s objectives.
To support the board, we have aligned certain non-executives with the Department’s four strategic outcomes, creating a collaborative and purposeful triangle of ministers, executives and non-executives. Valerie Hughes-D’Aeth, with her extensive human resource experience, is paired with the outcomes relating to Labour Market and Standards of Living. Gina Radford, with her long career in public health, is supporting Health and Disability outcome. David Bennett, with his vast practice in financial services, is paired with Later Life outcome. The wider work of the non-executives can be seen through the governance meetings they chair. You can read more about these later in the governance statement.
We will continue to evolve the functioning of the board to reflect the feedback from ministers and civil servants about how it best adds value, but I am pleased that the consistent message during this year was that the board and its members were progressively more helpful and impactful in supporting the Department’s running. The Department conducted an internal board effectiveness review in early 2024 which particularly highlighted that the shift towards outcomes has been positive. Given the size and scale of the Department, I consider it to be healthy to review our senior governance model. I am committed to this as part of an external board effectiveness review over the next year.
I am grateful to have worked as part of a strong team to guide the Department through another challenging year.
Ashley Machin
Lead non-executive Director
Directors’ report
DWP ministers
Ministers at 31 March 2024
Rt. Hon Mel Stride MP
Secretary of State for Work and Pensions (from 25 October 2022)
Portfolio:
- overall responsibility for the business of the Department, including the departmental Strategy, planning and performance, reporting and governance requirements
- direct responsibility for departmental expenditure
Jo Churchill MP
Minister of State (Minister for Employment) (from 13 November 2023)
Portfolio:
- labour market, addressing inactivity to improve labour supply and economic growth
- in-work progression
- skills
- conditionality and sanctions
- uprating and Benefit Cap
- overall management and delivery of Universal Credit and legacy benefits
- Jobcentre Plus
- international
- National Insurance Numbers
- Occupational health and statutory pay
- Childcare
- Poverty and cost of living
Mims Davies MP
Parliamentary Under Secretary of State (Minister for Disabled People, Health and Work) (from 14 December 2023)
Portfolio:
- disability policy and cross-government responsibility for disabled people
- oversight of the Disability Unit, and convenor of disability champions
- Work and Health strategy, including sponsorship of the joint DWP/Department for Health and Social Care Work and Health Unit
- disability benefit reform
- Disability Employment, and disability employment programmes
- financial support for those at risk of falling out of work, and disabled claimants including, Disability Living Allowance, Personal Independence Payment, Employment and Support Allowance and Carer’s Allowance
- support for disadvantaged groups
- Youth Offer
- Government Equalities Office lead, women and the menopause
- Military Covenant
- Housing Benefit strategy and delivery, including Support for Mortgage Interest and supported accommodation
Public body responsibility: Industrial Injuries Advisory Council.
Paul Maynard MP
Parliamentary Under Secretary of State (Minister for Pensions) (from 13 November 2023)
Portfolio:
- pensioner benefits, including new State Pension, Winter Fuel Payments, Pension Credit and Attendance Allowance
- private and occupational pensions, including regulatory powers and the National Employment Savings Trust
- social Fund (Cold Weather Payments, Sure Start Maternity grants and Funeral Expenses Payment Scheme)
- methods of payment, including Post Office Card Account
- Net Zero (supporting a greener and a more sustainable future)
- fraud, error and debt
- Shadow Lords Minister
Public body responsibility: The Pensions Regulator, Pension Protection Fund, Financial Assistance Scheme, The Pensions Ombudsman, and Office for Nuclear Regulation.
Viscount Younger of Leckie
Parliamentary Under Secretary of State
(Minister for Work and Pensions in the Lords) (from 1 January 2023)
Portfolio:
- spokesperson for DWP business in the House of Lords
- Child maintenance and family test
- parental conflict
- Bereavement Benefits
- Maternity Benefit
- coordination of departmental legislation
- Artificial Intelligence
- Devolution framework
- Serious Case Panel
- business, including oversight of:
- departmental capability in commercial and digital affairs
- commercial contracting policy
- resourcing and estates
- transparency and data-sharing issues
- research and trialing
Public body responsibility: Social Security Advisory Committee, Health and Safety Executive
DWP executives
Executives at 31 March 2024. Information on what each executive is responsible for can be found in the Executive Team section.
Sir Peter Schofield KCB
Permanent Secretary and Principal Accounting Officer
Appointment: January 2018
- Executive Team (chair)
- Departmental Board
- Nominations Committee
- Non-executive Directors and Executive Team Board
Debbie Alder CB
Director General, Corporate Transformation
Appointment: January 2014
- Executive Team
- Non-executive Directors and Executive Team Board
Neil Couling CB CBE
Director General, Change and Resilience Group
Appointment: October 2014
- Executive Team
- Non-executive Directors and Executive Team Board
Amanda Reynolds
Director General, Service Excellence Group
Appointment: February 2021
- Executive Team
- Transformation Advisory Committee
- Non-executive Directors and Executive Team Board
Katie Farrington
Director General, Disability, Health and Pensions
Appointment: March 2021
- Executive Team
- Non-executive Directors and Executive Team Board
Barbara Bradley
Director General, Work and Health Services Group
Appointment: June 2022
- Executive Team
- Non-executive Directors and Executive Team Board
Catherine Vaughan
Director General, Finance Group
Appointment: November 2022
- Executive Team
- Departmental Board
- Departmental Audit and Risk Assurance Committee
- Non-executive Directors and Executive Team Board
Sophie Dean and Katherine Green (job sharing)
Director General, Labour Market Policy and Implementation
Appointment: December 2022
- Executive Team
- Non-executive Directors and Executive Team Board
Richard Corbridge
Director General, Chief Digital and Information Officer Digital Group
Appointment: April 2023
- Executive Team
- Transformation Advisory Committee
- Non-executive Directors and Executive Team Board
Helen Pickles
Interim Director, People and Capability
Appointment: August 2023
- Executive Team
- Departmental Board
- Nominations Committee
- Non-executive Directors and Executive Team Board
DWP non-executive board members
Non-executives at 31 March 2024
Ashley Machin
Lead non-executive
Appointment: September 2022
- Departmental Board
- Nominations Committee
- Non-executive Directors and Executive Team Board (chair)
Valerie Hughes-D’Aeth
Reappointment: February 2024
- Departmental Board
- Nominations Committee (chair)
- Non-executive Directors and Executive Team Board
David Bennett
Appointment: February 2021
- Departmental Board
- Serious Case Panel (chair)
- Non-executive Directors and Executive Team Board
Charlie Steel
Appointment: March 2023
- Departmental Board Departmental Audit and Risk Assurance Committee (chair)
- Non-executive Directors and Executive Team Board
Reverend Professor Gina Radford
Appointment: March 2023
- Departmental Board
- Health Transformation Board (chair)
- Non-executive Directors and Executive Team Board Arabel Bailey
Appointment: February 2024
- Transformation Advisory Committee (chair)
- Non-executive Directors and Executive Team Board
Other non-executives at 31 March 2024
Sally Cheshire CBE
Departmental Audit and Risk Assurance Committee
Reappointment: August 2023
Ian Wilson
Departmental Audit and Risk Assurance Committee
Reappointment: August 2023
Simon Sear
Transformation Advisory Committee
Appointment: September 2021
Direct appointment at 31 March 2024
John McGlynn
Universal Credit Programme Board (chair)
Reappointment: February 2023
Changes to DWP board and executives in 2023 to 2024
The following changes took place between 1 April 2023 and 31 March 2024.
| Ministerial changes: Role | Name | Change |
|---|---|---|
| Minister of State (Minister for Employment) | Guy Opperman MP | left the Department 12 November 2023 |
| Parliamentary Under Secretary of State (Minister for Pensions) | Laura Trott MP | left the Department 12 November 2023 |
| Minister of State (Minister for Employment) | Jo Churchill MP | appointed 13 November 2023 |
| Parliamentary Under Secretary of State (Minister for Pensions) | Paul Maynard MP | appointed 13 November 2023 |
| Minister of State (Minister for Disabled People, Health and Work) | Tom Pursglove MP | left the Department 6 December 2023 |
| Parliamentary Under Secretary of State (Minister for Social Mobility, Youth and Progression) | Mims Davies MP | responsibilities ended 6 December 2023 |
| Parliamentary Under Secretary of State (Minister for Disabled People, Health and Work) | Mims Davies MP | change of portfolio from 14 December 2023 |
Executive level changes
| Executive changes: Role | Name | Change |
|---|---|---|
| Director General, Chief Digital and Information Officer Digital Group | Richard Corbridge | appointed 11 April 2023 |
| Director General, Chief Digital and Information Officer Digital Group | Simon McKinnon | left the Department 30 June 2023 |
| Director General, Corporate Transformation | Debbie Alder | appointed 14 August 2023 into this new role |
| Interim Director General, People and Capability | Helen Pickles | appointed 1 August 2023 |
Non-executive level changes
| Non-executive changes: Role | Name | Change |
|---|---|---|
| Non-executive director | Arabel Bailey | appointed non-executive director from 19 February 2024. (Appointed non- executive member 3 September 2021) |
Management of interests
All colleagues in DWP are bound by the Civil Service Code – the framework on which the Department’s standards of behaviour are built. The consequences of failing to comply are serious and attract penalties up to and including dismissal. The Department’s Standards of Behaviour Policy and Procedures apply to colleagues at all grades.
It is mandated in the Department’s Standards of Behaviour Procedures that colleagues’ interests and activities outside of work must not create conflict of interest or potential for perceived conflict of interest with their official role and they must not bring the Department into disrepute. DWP colleagues are specifically instructed in the Standards of Behaviour Procedures never to request special treatment from any client of the Department that would benefit their outside interests. DWP colleagues are also specifically required to consult their line manager and seek permission if they are proposing to take up a second occupation or any position with a non-political organisation (political activity is controlled under separate rules) if it could create a conflict of interests or appear to create a conflict of interests. Further, DWP colleagues must seek their manager’s written permission to take up any non-executive directorship during their employment with the Department.
In addition to the Department’s standing requirement for all staff to discuss potential conflicts with their manager before taking up an external appointment, DWP Senior Civil Servants and non-executive members are required to declare any interests which they hold to the Permanent Secretary on an annual basis. The information has been gathered during the year and has been reviewed by the Permanent Secretary. The returns were also scrutinised by DWP’s Departmental Audit and Risk Assurance Committee.
At the beginning of every Departmental Board meeting, all members are asked to declare any new potential conflicts of interest. These are noted in the minutes along with the appropriate action taken to manage them. Where a board member declares a potential conflict at a meeting, it is recorded in the minutes and the board member takes no part in any discussions relating to that matter. There were no conflicts of interests registered during board meetings in 2023 to 2024.
None of DWP’s ministers held directorships that conflicted with their management responsibilities in 2023 to 2024.
The Department has put in place legal agreements with Richard Corbridge and Charlie Steel that define the protocols and principles to be followed to identify, prevent, mitigate and remedy any conflict of interest or unfair advantage (whether actual, potential or perceived) that could arise as a result of Richard’s position on the Executive Team and Charlie’s position on the Department’s non-executive board. In addition, in line with the current Declaration of Interest policy for special advisers, all special advisers have declared any relevant interest or confirmed they do not consider they have any relevant interests. The Permanent Secretary has considered these returns and relevant interests are set out in public.
See a comprehensive list of directors and non-executive board members’ interests as of 31 March 2024 on www.gov.uk
Management of business appointments
Under the Government’s Business Appointment Rules, published internally and on www.gov.uk permission is required if any employee wishes to leave the Department to accept a job offer made by a person, company or firm with whom the employee formed a relationship during the course of their official duties and this applies for up to two years after an employee has left DWP employment. Applications under these rules are considered by someone in a position to understand the potential issues arising from the applicant’s proposed outside appointment and judge the possible public perceptions should the appointment be taken up as proposed. This would normally be someone in the applicant’s line management chain.
The Department’s People and Capability team scrutinises countersigned applications for assessment and action, and to ensure consistent application, ahead of approval either unconditionally or with conditions, or rejection. The Department’s measures in each instance are proportionate to the grade and previous role(s) of the applicant.
In compliance with Government’s Business Appointment Rules, the Department is transparent in the advice given to individual applications from senior staff, including special advisers. Advice given to Senior Civil Servants at SCS1 and SCS2 regarding specific business appointments is published on www.gov.uk
During 2023 to 2024 the number of requests made is contained in the table below.
| Request | Number |
|---|---|
| Number of exits where Business Appointment Rules applications were required | 7 |
| Number of exits where Business Appointment Rules conditions were set | 4 |
| Number of enforcement actions taken for breaches of the Business Appointment Rules | 0 |
The Advisory Committee on Business Appointments (ACOBA) considers applications from the most senior levels:
- Ministers
- Permanent secretaries (and their equivalents)
- Directors general (and their equivalents)
Advice given by ACOBA regarding specific business appointments is published on www.gov.uk
The departmental group
At 31 March 2024, the departmental group includes the core department (DWP), 10 public bodies[footnote 40] and one pension scheme. A public body is an organisation that delivers a public service but is not a ministerial government department. The Department’s public bodies consist of non-departmental public bodies, tribunal or advisory bodies and public corporations. They operate independently but are accountable to the Department. Collectively DWP’s public bodies have a net expenditure of around £469.0 million[footnote 41].
DWP manages its relationships with its public bodies in accordance with the Cabinet Office’s Arm’s Length Body Sponsorship Code of Good Practice[footnote 42] - which ensures a consistent approach.
The table below sets out DWP’s public bodies
| Classification | Pension bodies | Other bodies |
|---|---|---|
| Public corporations | Pension Protection Fund – – National Employment Savings Trust Corporation | Office for Nuclear Regulation |
| Executive non-departmental public bodies | The Pensions Regulator | Health and Safety Executive – – Money and Pensions Service – –Disabled People’s Employment Corporation (GB) Ltd |
| Tribunal or advisory non-departmental public bodies | The Pensions Ombudsman | Industrial Injuries Advisory Council – – Social Security Advisory Committee |
| Other | – | Remploy Pension Scheme Trustees Ltd |
Data Incidents
During 2023 to 2024, DWP notified 19 Personal Data related incidents to the Information Commissioner’s Office (ICO). The table below sets out the detail.
Number of breaches reported to the ICO
| Category | 2021 to 2022 | 2022 to 2023 | 2023 to 2024 |
|---|---|---|---|
| Alteration of personal data | 2 | 1 | 2 |
| Failure to redact | 1 | 0 | 0 |
| Loss/theft of paperwork or data left in insecure location | 1 | 1 | 2 |
| Verbal/written disclosure (including Postal Security Incidents) | 3 | 4 | 3 |
| Processing of wrong citizen’s personal data | 1 | 2 | 2 |
| Unauthorised access (staff member) | 0 | 2 | 2 |
| Other | 6 | 3 | 8 |
| Total | 14 | 13 | 19 |
Statement of Accounting Officer’s responsibilities
Under the Government Resources and Accounts Act 2000 (the GRAA), HM Treasury has directed me, Peter Schofield, as Principal Accounting Officer, to prepare, for each financial year, consolidated resource accounts detailing the resources acquired, held or disposed of, and the use of resources, during the year by the Department and its sponsored public bodies designated by order made under the GRAA by Statutory Instrument 2023 No.1360, together known as the ‘departmental group’, consisting of the Department and sponsored bodies listed in the departmental group section.
The accounts are prepared on an accruals basis and give a true and fair view of the state of affairs of the Department and the departmental group and of the income and expenditure, Statement of Financial Position and cash flows of the departmental group for the financial year. The accounts also include the departmental group’s net resource outturn, application of resources and changes in taxpayers’ equity for the financial year.
In preparing the accounts I have complied with the requirements of the Government Financial Reporting Manual (FReM). In particular, I have:
- observed the Accounting Direction issued by HM Treasury, including the relevant accounting and disclosure requirements, and applied suitable accounting policies on a consistent basis
- ensured that I have in place appropriate and reliable systems and procedures to carry out the consolidation process
- made judgements and estimates on a reasonable basis, including those judgements involved in consolidating the accounting information provided by DWP’s public bodies
- stated whether applicable accounts standards, as set out in the FReM, have been followed, and disclosed and explained any material departures in the accounts
- prepared the accounts on a going-concern basis
HM Treasury appointed me as the Principal Accounting Officer of the Department for Work and Pensions. I have appointed the chief executive or equivalent as the Accounting Officer for each arm’s length body. The chief executives of each DWP public corporation, whilst not accounting officers, have similar responsibilities. I remain responsible for ensuring that appropriate and reliable systems and controls are in place to ensure that monies paid to the Department’s public bodies are used for the purposes intended and that such expenditure and the other income and expenditure of the sponsored bodies are properly accounted for, for the purposes of consolidation within the resource accounts. Under their terms of appointment, the Accounting Officers of the sponsored bodies are accountable for the use, including the regularity and propriety, of the grants received and the other income and expenditure of the sponsored bodies.
I confirm that this Annual Report and Accounts 2023 to 2024 as a whole is fair, balanced and easy to understand. I take personal responsibility for the annual report and accounts and the judgements required for the determining that it is fair, balanced and understandable.
As the Accounting Officer, I have taken all the appropriate steps that I ought to have taken to make myself aware of any relevant audit information and to establish that the auditors are aware of that information. So far as I am aware, there is no relevant audit information of which the auditors are unaware.
The responsibilities of an Accounting Officer, including responsibility for the propriety and regularity of the public finances for which the Accounting Officer is answerable, keeping proper records and safeguarding the assets of the Department for Work and Pensions, are set out in Managing Public Money published by HM Treasury.
Sir Peter Schofield KCB
Permanent Secretary
Governance statement
The Department’s Accounting Officer System Statement (AOSS), available on www.gov.uk sets out how the Permanent Secretary, as the Principal Accounting Officer, fulfils his responsibilities. It describes the accountability system in place for all the expenditure of public money through the Department’s Estimate. This includes money made available to certain locally governed organisations, all public money raised as income, major contracts and outsourced services. It also sets out how the Department gains assurance about the satisfactory use of the money.
This governance statement sets out the Department’s governance structure, risk management framework and internal control procedures. It reflects current arrangements and outlines the significant changes made to increase the robustness and efficacy of governance throughout 2023 to 2024. Additionally, it provides assurance which the Permanent Secretary has received from his directors general, risk management and internal audit colleagues on how the system of control described in the AOSS has operated during the period covered by this statement. It concludes with his assessment of the effectiveness of the system of control.
The system of control
The Department is governed by:
- The Secretary of State’s overall responsibility for the Department and its public bodies,
- The Permanent Secretary’s responsibility, both to the Secretary of State and directly to Parliament, as the Accounting Officer for the Department’s expenditure and management, and
- The Departmental Board’s collective responsibility in providing strategic advice to achieve the Department’s goals effectively.
The system of control also includes the Departmental Board sub-committees, the Executive Team and its sub-committees, along with the control framework which is supported by internal and external assurance processes.
There were no Ministerial Directions during 2023 to 2024.
Senior governance boards’ structure
The chart below sets out the structure of DWP’s senior boards as of 31 March 2024, including the lines of communication so that issues are escalated to the right audience. This structure and board/sub-committee terms of reference and membership are kept under regular review.
DWP Governance – Senior Boards
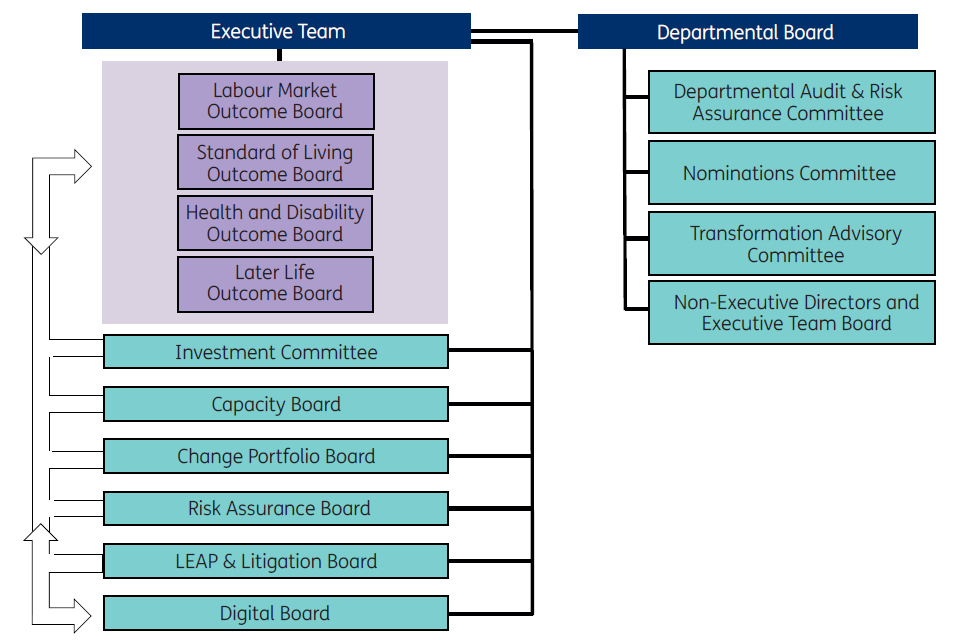
This chart does not include the additional boards that carry out management and assurance functions within the Department but report into the main boards above.
The Departmental Board
The Departmental Board, chaired by the Secretary of State, provides the collective strategic leadership of the Department. It brings together the Ministerial Team, senior members of the Department’s executive leadership team and non-executives from outside government.
Its purpose is to provide advice on the Department’s strategy, monitor performance and advise on significant risks. The board supports and advises on strategic issues linked to the development and implementation of the government’s objectives including appropriate oversight of sponsored bodies. The Departmental Board acts in compliance with the main principles in ‘Corporate governance in central government departments: code of good practice’.
Board membership has changed throughout the year with ministerial changes, the recruitment of a new non-executive board member and turnover of executives.
The board met four times during 2023 to 2024 and monitored progress towards achieving departmental objectives by focusing on departmental performance, transformation, resourcing and the Department’s financial position. This year the board took a new focus on strategic outcomes, using the four outcomes, as set out in the Department’s Outcome Delivery Plan, to guide its review of performance and provide strategic outlook. The conversation driven by this new focus has been collaborative, purposeful, and productive.
A board effectiveness review was conducted in 2023 to 2024, concluding that the Departmental Board operates effectively and supports delivering better outcomes for the public. The board receives data through good quality systems aligned to the monitoring of the Outcome Delivery Plan. It scrutinises performance via a dashboard containing clear, consistent, and comparable information. However, there is work to be done to clarify the role of the board in the performance management of the Department. The review also suggested further work to clarify the Department’s governance with the support of an external board effectiveness evaluation in 2024 to 2025.
The Departmental Board has four sub-committees, all chaired by a non-executive board member:
- The Departmental Audit and Risk Assurance Committee, chaired by Charlie Steel, provides independent assurance to the board and Accounting Officer on the processes and control environment that is in place in the Department and its arm’s length bodies. During 2023 to 2024, the committee has considered areas of corporate governance, risk management, internal and external audits, and accounting. In particular, the committee has reviewed arm’s length bodies assurance, continued its focus on fraud and error (internal and external), as well as monitored the processes for whistleblowing. The committee has also received assurances on security, cyber and digital risks and attained updates on the Legal Entitlement Administrative Practices (LEAP) exercises, including State Pension underpayments and Home Responsibilities Protection.
- The Nominations Committee, chaired by Valerie Hughes-D’Aeth, provides advice on how to identify colleagues with high potential, develop leadership, grow the senior talent pipeline, and advises on the Department’sreward and incentives offer. During 2023 to 2024, the committee focused on: the Executive Team development, performance, accountabilities, refreshing the director general succession plans, understanding the impact of the 2024 to 2025 budget allocations on headcount and the 2024 to 2025 pay landscape.
- The Transformation Advisory Committee, chaired by Arabel Bailey, provides advice to the Department to support its transformation ambitions around customer and colleague experience and service delivery efficiency. During 2023 to 2024, the committee has worked with colleagues in the Service Modernisation Programme, Service Excellence, Digital Group, Policy Group, Change and Business Strategy and has covered a wide range of topics, operating across organisational boundaries in the Department and bringing external experience to bear. Significant topics tackled this year include policy simplification, the evolving Digital Strategy, future culture development and the change management approach, stakeholder communication, Get your State Pension migration, and the next iteration of the business strategy.
- The Non-Executive Directors and Executive Team Board is chaired by the Department’s Lead non-executive Director, Ashley Machin with the aim to support strategic, business, and financial planning and business strategy. The non-executives provide value through support and challenge to the Department’s Executive Team. Along with the chair, the directors general and other non-executive directors review departmental performance, providing challenge and input to high priority work streams. During 2023 to 2024, the board discussed a wide range of topics, including: how to manage unexpected demand or changing priorities, the use of Artificial Intelligence, deliverability and resourcing and managing risk. This board is under review for 2024 to 2025.
In addition, the Serious Case Panel is chaired by a non-executive director, David Bennett. Its purpose is to consider serious widespread issues arising from cases and other insight, impacting on the DWP customer experience and make recommendations to address these issues, to reduce the incidence of such cases in future. The panel met quarterly throughout 2023 to 2024. See the Serious Case section for more information.
Department board and committee attendance 2023 to 2024, by member, of meetings eligible to attend
| Name of board | Departmental Board | Departmental Audit and Risk Assurance Committee | Nominations Committee | Transformation Advisory Committee | Non-Executive Directors and Executive Team Board |
|---|---|---|---|---|---|
| Number of meetings held | 4 | 5 | 2 | 8 | 3 |
| Rt Hon Mel Stride (MP) | 4/4 | – | – | – | – |
| Tom Pursglove MP | 3/3 | – | – | – | – |
| Laura Trott MP | 2/2 | – | – | – | – |
| Mims Davies MP | 3/4 | – | – | – | – |
| Guy Opperman MP | 2/2 | – | – | – | – |
| Viscount Younger | 4/4 | – | – | – | – |
| Paul Maynard MP | 1/2 | – | – | – | – |
| Jo Churchill MP | 1/2 | – | – | – | – |
| Ashley Machin NEM | 4/4 | 2/3 | 2/2 | 4/4 | 3/3 |
| Valerie Hughes-D’Aeth NEM | 3/4 | – | 2/2 | – | 3/3 |
| David Bennett NEM | 3/4 | – | – | – | 2/3 |
| Revd Prof Gina Radford NEM | 4/4 | – | – | – | 3/3 |
| Charlie Steel NEM | 4/4 | 5/5 | – | 3/3 | 3/3 |
| Arabel Bailey NEM | 1/1 | – | – | 8/8 | – |
| Sally Cheshire | – | 4/5 | – | – | – |
| Ian Wilson NEM | - | 5/5 | – | – | – |
| Simon Sear NEM | – | – | – | 7/8 | – |
| John McGlynn NEM | – | – | – | – | – |
| Sir Peter Schofield KCB Executive | 4/4 | 1/1 | – | – | 3/3 |
| Debbie Alder CB Executive | 1/1 | – | 1/1 | – | 2/3 |
| Neil Couling CB CBE Executive | – | – | – | – | 3/3 |
| Amanda Reynolds Executive | – | – | – | 8/8 | 2/3 |
| Katie Farrington Excutive | – | – | – | – | 2/3 |
| Barbara Bradley Executive | – | – | – | – | 3/3 |
| Catherine Vaughan Executive | 4/4 | 5/5 | – | – | 2/3 |
| Sophie Dean and Katherine Green (jobshare) Executives | – | – | – | – | 3/3 |
| Rich Corbridge Executive | – | – | – | 6/8 | 2/3 |
| Helen Pickles CBE Executive | 3/3 | – | 1/1 | – | 2/2 |
The Executive Team
The Executive Team is the senior leadership team of the Department and is responsible for setting the strategic direction, overseeing the delivery of services and programmes, and managing the overarching performance and risks of the Department. The Executive Team meets weekly to discuss and decide on the most important issues facing the Department.
2023 to 2024 brought more challenges for the Department, with the continuing cost of living pressures, a slowdown in economic growth and a further rise in the number of people out of the labour market due to long-term sickness all contributing to rising demand for DWP’s services.
The Executive Team led DWP’s response to these challenges, driving forward delivery of the government’s growth and fiscal objectives and monitoring departmental performance as laid out in the Department’s Outcome Delivery Plan. A key focus was building additional capacity to meet the rising service demand. An ambitious recruitment target was set and a local flexibility framework to allow jobcentres to stop or limit activities to manage demand was introduced - all while protecting the space for transformation to drive productivity and making critical decisions to reduce the financial challenge for the year ahead.
The Executive Team provided steers on the Department’s risks and mitigations against potentially disruptive events such as cyber-attacks and agreed a refreshed set of principal risks with clear ownership at director general level. It also considered a wide range of strategic issues around the Department’s people and its estate. It provided direction for the Department’s Diversity, Equity and Inclusion strategy, commissioned deep dives into aspects of the People Survey results to gain more insight into colleagues’ lived experiences (such as those who have reported bullying or harassment and barriers facing those with workplace adjustments), and agreed the way forward on developing the Department’s roadmap to Net Zero.
Outside formal governance, the Executive Team has the Shadow Board, consisting of colleagues from all grades below Senior Civil Servants currently working within the Department. It is a forum for colleagues to lend diverse voices and thinking to challenge and inform the Executive Team’s decision making. Shadow Board members join the Executive Team meetings to offer insights and support decisions and play an important role in communicating the work of the Executive Team across the Department.
There are several sub-committees of the Executive Team:
- Investment Committee provides a senior line of assurance on the Department’s key projects and programmes, oversight of the Department’s in-year financial position and multi-year plans. It is chaired by the Director General, Finance and supported by senior representatives from all areas of the business. The committee scrutinises business cases against the government’s framework and guidance on options appraisal, the Green Book.
This year the committee considered business cases which support the transformation of the Department’s organisation and services such as Workplace Transformation Programme, Contact Centre Modernisation and Health Transformation Programme. Universal Support and WorkWell, both of which are Workforce Participation measures announced in Spring Budget 2023, were also scrutinised by the committee alongside other labour market initiatives. The committee also scrutinised initiatives designed to help tackle fraud, error and debt, including the Counter Fraud and Error Management System programme, and the Transaction Risking and Targeted Case Review programmes. In addition, the committee provided scrutiny on the Department’s estates portfolio projects which included jobcentre relocations for Marylebone, Bootle and Watford.
In 2023 to 2024, there was a continued focus on strengthening the Investment Committee’s assurance model for programme/project business cases and commercial activity which saw the introduction of a three-level scrutiny process: full scrutiny, light touch, and the pipeline process, to ensure proportionate and value-adding scrutiny in response to the increases in the Department’s spend limits.
The Capacity Board is chaired by the Director General, People and Capability, and is held on a quarterly basis. The Capacity Board is responsible for agreeing both the Annual Workforce Plan and the DWP Strategic Workforce Plan, monitoring progress against agreed workforce targets in line with ministerial priorities and ensuring tactical decisions fit with future direction and affordability. It provides governance and strategic oversight on people resourcing decisions that impact capacity and capability to help improve the Department’s forecasting.
Throughout 2023 to 2024, the board provided oversight on the recruitment process while monitoring redeployment, highlighting areas of concern and opportunity. The board also actively engages with the learning and development strategy to bridge skills gaps and improve staff wellbeing. Over the year, the board continued to review the workforce plans for service delivery and functions, monitoring any changes in staffing levels. Furthermore, the board provided oversight for work on diversity and inclusion.
The Change Portfolio Board is chaired by the Director General, Change and Resilience Group and has oversight of change activity within the Department. The board provides assurance to the Executive Team about the deliverability of the overall departmental change portfolio, confirming that the planned changes are meeting investment conditions and are successfully progressing. The board has close links with the Investment Committee supporting the assessment of the value for money and deliverability of proposed new programmes prior to them being accepted on to the Change Portfolio. During 2023 to 2024, the board continued to have a strong focus on delivery, deliverability, and stability of plans. A number of quarterly scrutiny sessions have been completed to monitor and respond to performance and risk across the portfolio. Areas of focus have included programme board effectiveness, dependencies, plans and benefits.
The LEAP and Litigation Board is an expansion of the LEAP Oversight Board, after the Permanent Secretary agreed in autumn 2023 that the board would also oversee litigation risks. The board is chaired by the Director General, Finance and manages LEAP and litigation activity across the Department. The board sets and leads a clear escalation and reporting route for LEAP and litigation activity, informing financial planning and prioritisation across the Department.
Throughout the year, the board has received regular updates on live LEAP exercises, including the start of the exercise on Home Responsibilities Protection and the closure of the CAT BL and CAT D strands of the State Pension exercises. Following recommendations from the Government Internal Audit Agency, the board also focused on lessons learned from administrative exercises to ensure issues and common themes are identified correctly and that customers’ accessibility is considered.
Since also encompassing litigation, the Legal Director and Litigation senior responsible owner has provided regular updates to the board on litigation risk profiles, which have overall been decreasing. The board has positively recognised the work carried out to develop virtual litigation groups (linking policy, legal, operational and decision-making teams) and to further build litigation capability across the Department so that cases are handled effectively.
The Risk Assurance Board is chaired by the Chief Risk Officer. During 2023 to 2024 board membership has comprised of senior leaders and subject matter experts who seek assurance on the management of strategic, delivery, operational, programme and functional risks. The process for reviewing significant risk themes is well defined with the board regularly assessing new and emerging risks to ensure that the impacts are fully understood. By offering robust challenge to the risks and the mitigating actions being implemented, the board provides assurance to the Executive Team and the Departmental Audit and Risk Assurance Committee that senior responsible risk owners are managing risks effectively.
The Outcome Boards: In spring 2023, the Department introduced four new outcome boards to oversee the end-to-end view of its four strategic outcomes, from policy thinking to deliverability. They aim to create an even sharper focus on citizen outcomes, give greater confidence in decision-making and help shape advice to ministers on relative priorities. The outcome boards are chaired by policy directors general and bring together members from across policy, operations and enabling functions to give a whole-system view.
-
The Labour Market Outcome Board provides oversight and governance around the delivery and impact of labour market policy to support the Department’s strategic objective to ‘Maximise employment, reduce economic inactivity, and support the progression of those in work’. Key areas of focus for the board this year have included the delivery of workforce participation measures announced at Spring Budget 2023, agreeing the overall package of measures of the ‘Back to Work Plan’ as part of Autumn Statement 2023 preparations, and ensuring the deliverability of DWP’s existing labour market interventions alongside new commitments.
-
The Standard of Living Outcome Board provides oversight of the Department’s strategic objective to ‘Deliver financial support to people who are entitled to it’. The board has supported joined up work across policy and delivery teams in preparation for the Autumn and Spring Statements, for example, the increase in the Local Housing Allowance, a further extension to the Household Support Fund and the extension of the repayment period for new Universal Credit Budgeting Advances.
-
The Health and Disability Outcome Board is responsible for delivering a department-wide strategy that supports the outcome of enabling disabled people and people with health conditions to start, stay and succeed in work, and get financial support. Over the past year, the board has been successful in steering and prioritising work on initiatives and activities that deliver these outcomes. This includes the implementation and delivery of the Health and Disability White Paper, measures at the Spring Budget and Autumn Statement to increase workforce participation and support for disabled people and people with health conditions, and the Work Capability Assessment consultation and reforms.
-
The Later Life Outcome Board sets the strategy and oversees work to support financial resilience in later life. Over the past year the board has been considering the challenges as the ageing population increases demand for DWP’s services. The board is supporting ongoing prioritisation work by bringing policy, operational and analytical expertise together to identify further potential efficiencies and enhance join-up with pensions arm’s length bodies.
The Digital Board, chaired by the Chief Digital and Information Officer and established in July 2023, is an enabling, cross-cutting board, which forms part of the Department’s decision-making framework. The board meets bi-monthly, with membership extending across all director general functions. Its purpose is to support the strategic outcomes by strengthening digital delivery and in becoming a data-led, digital-first, organisation. The board met four times in 2023 to 2024 with the focus on development of the Digital Strategy and Digital Group operating model, digital budgets and themes to ensure achievement of business priorities and desired outcomes, including Artificial Intelligence.
Annually managed expenditure
The Department jointly manages its annually managed expenditure (AME) with HM Treasury. HM Treasury is involved in all decisions involving DWP AME spend as the Department, while being responsible for the spend, has no delegated authority. Meetings are held regularly throughout the year to monitor AME spend and its trajectory against the welfare cap. See the Chief Finance Officer report for further detail on the welfare cap.
Within the Department:
- The Director General, Finance holds executive level accountability for AME controls, including that the Department secures the necessary HM Treasury spending approvals outside of fiscal events.
- The Director General, Labour Market Policy and Implementation holds executive level accountability around the welfare cap, monitoring longer term risks to AME spend and overseeing fiscal event processes.
They are supported in this role by the internal AME Board, and by the Senior Welfare AME Group, which has membership from within the Department and HM Treasury. Both boards are chaired by the Director General, Labour Market Policy and Implementation. The boards oversee all departmental activity related to management of AME spend, including the monitoring of all risk to AME spend. They also review liabilities in relation to benefit expenditure for reasons such as judicial reviews, legal cases and appeals as provisions.
Change governance
Prospective changes to join the Department’s Change portfolio are routed through a single gateway. This helps to provide a pipeline view of change across the Department as well as ensure an appropriate level of scrutiny and approval is applied by the Investment Committee or the Change Portfolio Board.
A comprehensive assessment process for changes, involving colleagues from across functional areas within the Department, ensures initiatives are assessed for alignment with the Department’s strategic plans and priorities, value for money and deliverability.
Significant projects or programmes accepted on the Department’s Change portfolio have a formal senior responsible owner (SRO) and Programme Director appointed. The SRO is supported by a programme board where each programme board member has clear accountabilities with appropriate authority. Board members provide assurance to the Investment Committee, Change Portfolio Board, and their own director general on compliance with departmental guidance and deliverability of the programme.
The accountabilities of SROs are formally delegated through appointment letters issued by the Permanent Secretary. If the project or programme is part of the Government’s Major Projects Portfolio (GMPP), the formal appointment letter is jointly issued by the Permanent Secretary and the Chief Executive of the Infrastructure and Projects Authority (published on GOV.UK). DWP currently has seven programmes on the GMPP:
- Universal Credit
- Health Transformation
- Service Modernisation
- Workplace Transformation
- Universal Support, which joined the GMPP in November 2023
- Pensions Dashboard (delivered by Money and Pensions Service)
- The Building Safety Regulator (delivered by Health and Safety Executive programmes)
In addition, the Permanent Secretary provides Accounting Officer oversight for Synergy – a GMPP programme which serves four government departments.
DWP continues to work closely with the Infrastructure and Projects Authority and HM Treasury who provide independent assurance of the Department’s GMPP projects and programmes, including potential new programmes.
Functional Standards
Functional standards exist to create a coherent, effective and mutually understood way of doing business within government organisations. These standards are mandated for use across central government and provide a stable basis for assurance, risk management and capability improvement, supporting value for money for the taxpayer.
A function is a grouping aligned across government to manage functional work such as human resources, commercial or finance. The Department has 12 functions that operate in accordance with the functional standards. The head of each function is responsible for assessing the function against the standards and to have maturity action plans in place to ensure continuous improvement, providing assurance to the Department’s Accounting Officer.
During 2023 to 2024 DWP has undertaken a second annual coordinated delivery functional round table with its heads of function and their counterparts at the centre of government, resulting in shared actions on how the Department can improve delivery through strengthening functions. In addition, in collaboration with the Cabinet Office, DWP has reviewed the approach to managing GovS001, which is the standard that sets expectations for the direction and management of functions across government, including management of functional standards.
Risk management
The Department’s Risk Management Strategy and Framework set out the process for identifying, managing, and mitigating key risks across the Department. It is aligned with and follows the overarching principles of HM Treasury’s Orange Book, ISO 31000: 2018 Risk Management Principles and Guidelines, and the UK Corporate Governance Code.
The Accounting Officer has overall responsibility for the Department’s risk management strategy and framework, with executive team members designated as senior, accountable owners for the Department’s principal risks that threaten successful delivery of its objectives. The risk management strategy and framework define the departmental risk appetite and tolerance levels which are determined and reviewed by the Department’s Executive Team, informing all decision-making and investment choices. Regular risk-focused sessions are held throughout the year with the Executive Team to identify and agree the Department’s principal risks and ownership of those risks at director general level.
DWP’s Director of Risk and Resilience is the Department’s Chief Risk Officer, leading a corporate risk management function that supports the Accounting Officer and Executive Team to ensure senior sponsorship for effective risk management throughout the organisation and across departmental forums including the Risk Assurance Board and the Departmental Audit and Risk Assurance Committee (DARAC). DARAC reviews the departmental risk register adding further scrutiny and challenge.
The Risk Assurance Board supports the Director General, Finance in fulfilling their risk management responsibilities, ensuring there is an effective risk management process in operation across the Department. During 2023 to 2024, the Department has enhanced its approach to testing and seeking risk management assurance in line with revised HM Treasury Orange Book principles.
DWP’s risk management assessment programme reflects key lines of enquiry and assurance on risk control framework themes, as defined in those principles. Assurance mapping against the Department’sprincipal risk set continues to support evaluation of the risk profile and the effectiveness of plans to reduce the level of risk exposure. Those same techniques have been applied to evaluate functional standard performance and are also being piloted to strengthen the assurance regime that informs the Department’s governance statement.
DWP’s public bodies are responsible for their own risk management, with internal board oversight. Governance arrangements were strengthened during 2023 to 2024 with the instigation of joint meetings of the chief executive officers of the public bodies, chaired by the Department’s Chief Risk Officer, this promotes a collaborative approach to governance, sharing of best practice, visibility of cross-cutting risks and a clear escalation route for risks. The Arm’s Length Bodies Partnership Division manages assurance assessments for these organisations using a tailored, risk-based approach which is proportionate and flexible, testing how the arm’s length bodies risks may impact the Department. In its commitment to continuous improvement DWP has, again, reviewed the annual assurance process, building in improvements which have enhanced the robustness of assessments.
Significant Risks in 2023 to 2024 and assessment
Throughout the year the Department delivered against a backdrop of a rapidly changing external environment with a risk landscape that was increasing in complexity with growing interdependencies. This year the Executive Team acknowledged that they are operating with a heightened level of risk, needing to tolerate more risks to delivery.
The principal risk themes in 2023 to 2024 affecting the Department in delivering its objectives were as follows:
| Principal Risk Theme | Description | Assessment* |
|---|---|---|
| Fraud and error | There is a risk that plans DWP has in place to reduce fraud and error are not successful owing to a failure to execute the ambition of the plan successfully; and/or the increased propensity of fraud in wider society. | High increasing risk |
| Affordability and delivery of strategic outcomes | There is a risk that insufficient funding, alongside ambitious plans and constrained resources, may mean that the Department fails to deliver its strategic outcomes and delivery objectives. | High no movement |
| Stabilising performance and quality | There is a risk that the Department could fail to deliver an efficient, effective and high performing service to its customers if churn and attrition continue at its current rate and expected performance standards are not fulfilled due to increased demand. | High no movement |
| Cyber and data threats and risks | There is a risk that internal or external cyber threats could result in breaches in data confidentiality, integrity and availability, disruption of payment services, loss of critical business services, loss of data and bulk data assets. | High no movement |
| Change | There is a risk that capacity and capability challenges mean that the Department fails to deliver its ambitious programme of transformation and modernisation. Deliverability and affordability are being continuously reviewed and assessed. | High no movement |
| Labour Market | There is a risk that with continued economic uncertainty and unemployment forecast to be at its peak level across 2024 to 2025. The Department, employers and partners are not able to meet demand and deliver the package of support to reduce economic inactivity and improve workforce participation. | High no movement |
*The risk assessment demonstrates a combined probability and impact, and this sum is typically low probability, higher impact.
The challenging internal and external environment means that the Department needs to continue to strengthen the assurance regime and test confidence in the effectiveness of risk management plans to bring risks within tolerance and appetite. The Department is taking proportionate mitigation action against these risks that threaten to undermine achievement of its business objectives and delivery of the Department’s services. The Department has for some time been navigating through the uncertainties faced in the past few years and has demonstrated its resilience. That means remaining vigilant to emerging risk themes as DWP revises its delivery plan for 2024 to 2025 and delivers efficiencies over the course of the current and future Spending Review periods. There is more to do to mature the Department’s understanding of the risk landscape which includes scrutinising the controls in place to ensure that they are the right ones to effectively manage risks, ensure compliance with standards and deliver on the Department’s commitments in the Outcome Delivery Plan.
Security and information management
Departmental security is managed and overseen by the Chief Security Officer (CSO), who reports to the Director General, Finance and is a standing member of the Departmental Audit and Risk Assurance Committee and the Risk Assurance Board.
The CSO also attends the Executive Team discussions on a quarterly basis, to provide progress updates across all aspects of security. The Department has continued to focus on five key areas, which have been endorsed by the Executive Team, to improve departmental security further:
- Security operating model: the Department is developing the security operating model to outline how the security outcomes support the Department’s strategic objectives. It will reduce duplication of security activities and help focus security on the most impactful work
- Cyber visibility and control: the Department is driving activity to automate, where appropriate, its cyber response to better utilise cyber security controls
- Malware protections: the Department is improving security controls for threat protection, monitoring and tracking using relevant workshops and tailored exercises to support malware detection and protection activity
- Improved personnel control: the Department is improving internal processes to initiate applications for national security vetting and make case decisions through new technologies and training. The Department is driving ongoing work to evaluate and strengthen security access controls through capabilities, guidance, upskilling and alignment of processes and policies
- Physical Security: the Department is moving to a risk driven approach to protect itsestate and people, recognising the convergence of physical and cyber security. A major programme of work is underway to enhance security controls to mitigate threats and reduce risk. Enhanced access control, CCTV and intrusion detection will complement existing controls in preventing both security and health and safety incidents
These priorities are under constant review as the Department continues to analyse the threats and risks to the Department.
The CSO continues to support cross-government work in several areas, most notably in providing security education and awareness for civil servants across Departments – as well as providing the Department with a rolling education and awareness programme that includes updated and refreshed mandatory e-learning for all staff.
The Security Assurance function is now an established function that provides the Department with evidential understanding and insights that risks are effectively managed, systems are working as designed and security controls are meeting their target outcomes in support of departmental objectives.
During 2023 to 2024, the Data Protection Officer reported 19 incidents to the Information Commissioner’s Office (ICO).
During 2023 to 2024 the Department received 27,187 Subject Access Requests (SARs) with 26,673 completed. 21,231 (80%) were completed within the statutory UK General Data Protection Regulations deadline. There are plans to introduce a strategic technical solution in 2024 to 2025 that means the Department can respond securely and electronically to SARs which should realise efficiency improvements.
The Department reviewed a record number of historical corporate records with over 21,000 records being reviewed helping to keep the Department compliant with its obligations under the Public Records Act. This was achieved through changes to ways of working, with DWP’s records management supplier taking on administrative tasks, freeing up expert resource within the team.
Freedom of Information (FOI) performance within the Department remains strong, there has been a slight increase in the volume of requests received and 2023 to 2024 was one of the highest performing years on record. DWP exceeded the ICO monthly 90% minimum target, for replying to responses within 20 working days, in every month and also achieved the Department’s first 100% clearance rating in November 2023.
The formal FOI performance statistics are published by the Cabinet Office on GOV.UK and can be accessed here – Freedom of Information statistics – GOV.UK (www.gov.uk)
In June 2023, the Department responded to the ICO Practice Recommendation outlining steps that were being taken to address its concerns and provided a further update in January 2024. Colleagues met with ICO representatives to discuss the Department’s response to the Practice Recommendation on Freedom of Information (FOI) in March 2024. The ICO are going to monitor the Department’s FOI responses since it introduced new guidance in the autumn but there were no further action points.
Departmental Security Health Check
The Departmental Security Health Check (DSHC) is an annual Cabinet Office requirement for government departments, and some arm’s length bodies. There have been several changes implemented since the 2022 DSHC the most significant being the removal of all cyber questions, which will be covered in the new Cyber Assessment Framework. There have also been changes to the physical security questions and the introduction of new physical security standards. The Department has received an initial report from the Cabinet Office on its results. The Department hasimproved from last year and outperforms departmental averages in all areas.
The Department agreed to take part in an assurance pilot for the DSHC, where its results will be assessed and assured by an independent third-party. This will provide the Department with greater assurance on its results and help shape and understand the process for future years when third-party assurance becomes mandatory.
Cyber Assessment Framework (CAF)
Cyber security was removed from the DSHC and is being assessed for the first time this year as a separate discipline. Whilst the Department met all minimum security standards for cyber security within the DSHC, the CAF provides a more rigorous assessment.
To pilot CAF this year the Department assessed two critical national infrastructure systems: Universal Credit and the Customer Information System which were assessed against the more demanding ‘enhanced profile’, due to the importance of protecting these systems. The Department has met the enhanced profile across most of both systems but recognises that there is more to do to meet the full requirements of the target profile.
Artificial Intelligence (AI)
The Department uses digital design authority, technology, and data governance and has developed a new cross-departmental assurance framework for assurance and governance of AI.
With the establishment of the Department’s Generative AI Lighthouse Programme in July 2023, the Department extended its existing digital governance to include an AI Steering Board, an AI assurance and Advisory Group and an AI Delivery Board.
The focus has been on convening a whole-Department response to rapidly assure scaling and test effective cross-departmental governance and assurance. To address the 12 risk categories outlined by the UK Parliament Science, Innovation and Technology Committee, DWP adheres to six principles to ensure that the responsible use of AI is:
- explainable
- mitigated
- controlled
- understood
- value-led
- governed
The AI Steering Board, chaired by DWP’s Chief Digital and Information Officer, was established in July 2023. Its purpose was to bring together key representatives from across the Department to take accountability for the appropriate and responsible use of AI across the Department. The Board set the strategic direction for effective and safe AI development. Throughout 2023 to 2024, the AI Steering Board was accountable for:
- Setting strategic direction for AI and providing necessary approvals of approaches, aimed at ensuring policy outcomes and delivery objectives were aligned and successfully achieved
- Setting thresholds for levels of appropriate risks, and determining appropriate escalation routes
- Ensuring blockers to delivery were removed and/or mitigated as needed
- Monitoring, reviewing and mitigating strategic risks
- Ensuring that policy and projects teams consulted with the AI Advisory and Assurance Group on the implications of the use of AI.
Throughout 2023 to 2024 DWP’s AI assurance framework continued to evolve and in April 2024 the AI Delivery Board, chaired by DWP’s Chief Digital and Information Officer, was established to replace the Steering Board. It is responsible for:
- the implementation of the Department’s AI Strategy
- assuring the appropriate use and safe acceleration of AI in DWP
- ensuring decision-making for Projects is in line with the agreed objectives
- approving Go Live decisions
- overseeing management of Project risks and issues and agreeing ownership of mitigation action(s) ensuring all mitigation is implemented and is effective
- providing direction and steering the direction of AI projects
- assuring progress against plans, directing action to achieve outcomes
- owning the development and approval of business case(s) and benefits realisation plans, providing assurance that business benefits and project deliverables remain aligned with the respective business case(s)
- Ensuring lessons learned from Lighthouse projects are actively used to enable continuous improvement
- Taking ownership of internal and external reviews and their associated outcomes
- Operating at all times within the authority of the Department’s overarching governance arrangements; and,
- Ensuring Data Protection by Design is built into the projects and Data Protection Impact Assessments are completed to meet legal requirements.
The AI Advisory and Assurance Group, chaired by the Department’s Deputy Chief Data Officer, was established in September 2023. Its purpose is to bring together the necessary capabilities and expertise across the Department to provide advice and assurance regarding AI. Throughout 2023 to 2024, the AI Advisory and Assurance Group provided scrutiny and advice to the AI Steering Board. The group is accountable for:
- providing scrutiny and advice to the Board and to Lighthouse project teams
- assessing risk associated with proposed AI projects and initiatives
- ensuring proposals conform to both the Department and the Government Data and Digital Principles and underpinning standards, frameworks, and structures
- ensuring appropriate application of the pan-Government Digital Standards
- escalating concerns to the Board.
The AI Advisory and Assurance Group operates separately to the AI Delivery Board to assess risks from the perspective of a collection of subject matter experts. The group supports AI Delivery Board to recognise and assess risks they may not have considered, such as the impacts on DWP staff, potential legal risks, contractual and commercial issues, or ethical risks.
As part of ongoing assurance, the Department is developing a new AI risk framework which will be used to assure all new AI initiatives. The AI risk framework will cover a variety of different risk areas including bias, information security and privacy, and access to data.
The initiative is then taken to Digital Design Authority (DDA) advisory and approvals which is part of existing Digital governance. The DDA review allows for technical experts to assess and raise any concerns around technical risks such as security, data privacy, architectural design, and to ensure that suitable mitigations are in place.
Following this, the AI Delivery Board allows for a final holistic review of each proposed AI project before granting approval for development to begin or continue.
The Department records all AI developments in a newly established AI inventory that includes the project, a description of what is being built, its usage and its possible effects. This inventory has been aligned to the Cabinet Office Algorithmic Transparency Recording Standard.
DWP continues to review and iterate its AI governance and assurance framework so that it remains relevant, robust and includes expert representatives from across functions (data, legal, cyber, risk, etc.) for advice, oversight and assurance throughout the development lifecycle.
Commercial and contract management
The Commercial Strategy provides a roadmap for the delivery of its priority workstreams for the period up to 2025. It outlines how DWP’s Commercial Directorate will operate as a commercial function, enabling the Department to meet its priorities as well as delivery against the Government Commercial Function (GCF) standards.
During 2023 to 2024, the Department focused on developing stronger collaborative working relationships with senior stakeholders across the Department’s operational areas. The operating model has been designed to help increase commercial influence earlier in departmental decision making and align commercial support to departmental priorities to deliver best value within the Department and across government.
Commercial controls
Commercial Directorate continues to operate within a strong control environment, utilising a commercial approval board made up of senior commercial, finance and business stakeholders to assure and approve commercial activity above £400,000, providing confidence to the Department’s seniors that commercial activity is managed in an appropriate way. The Department has introduced an external resource approval board, providing holistic assurance and approval of all contingent labour and consultancy requests. This will significantly increase transparency of external resource use across the Department. The strength and maturity of DWP’s control frameworks are acknowledged through significant levels of earned autonomy from external controls.
During 2023 to 2024 the Department has recognised some areas of control weakness and acted on observations made by the Government Internal Audit Agency, taking action to strengthen practice. Notably, the Department re-designed its conflicts of interest policy and process by introducing a portal, alongside refreshed guidance. This has resulted in greater visibility of potential conflicts and what constitutes a perceived conflict, enabling commercial teams to check and mitigate any conflicts at the earliest stage.
The Department is currently piloting the use of external procurement assurance reviews for its high-risk complex sourcing activity. Following conclusion of the pilot and evaluation of the benefits, recommendations will be made for future independent assurance. The Department has also strengthened its contract management with further targeted roll-out of the Cabinet Office’s Contract Management Capability Programme across the Department’s centralised operational contract management functions.
Assurance covering grants
The Director General, Finance has overall responsibility for providing assurance that financial controls are sufficient to mitigate financial risks in all areas, including grants. The Senior Functional Grants Lead provides assurance on all aspects of grants, including ensuring compliance with the Government Grants Functional Standard and the Global Design Principles.
The Department awards grants to a range of organisations across different sectors, to help achieve delivery of departmental objectives. Examples include Help to Claim, Household Support Fund and Flexible Support Fund schemes.
The Department has a comprehensive grants framework that provides guidance on the end-to-end process for grants. This content has been enhanced by incorporating links to the Cabinet Office’s Government Grants Functional Standard. For schemes that are high-risk, novel, contentious or repercussive, the Department uses the Cabinet Office’s Complex Grants Advice Panel.
The Department’s Grants Approval Board, chaired by the Department’s Senior Functional Grants Lead, the Deputy Director of European Social Fund, has responsibility for ensuring that new schemes and grant extensions, equal to or above £100,000, are compliant with the Government Grants Functional Standard, which is guidance that sets expectations for the management of grants across government. The board ensures that grant owners demonstrate how all aspects of the functional standard are met before a scheme is approved. In 2023 to 2024, thirteen new grants and extensions were considered by the Grants Approval Board totalling £573.8 million.
To underpin the Grants Functional Standard, the Cabinet Office has produced a maturity matrix which includes 258 compliance indicators. The indicators are rated as “Good”, “Better” and “Best” practice. Departments are required to self-assess their compliance with all indicators. Since the last self-assessment in February 2022, the Department has continued to progress actions in the Grants Continuous Improvement plan. The impact of this will be assessed as part of the next formal self-assessment exercise. This is now due to be reported to Cabinet Office in 2024 to 2025, when a new assessment tool is rolled out to Departments.
Assurance about the operation of the system of control
Assurance from executives
The Accounting Officer issues a formal letter to each director general setting out their delegated accountabilities and authority. The Executive Team has responsibility for delivery of their shared team objectives, supporting the delivery of departmental strategic objectives and they review their collective delivery of these on a quarterly basis.
During 2023 to 2024, each director general provided the Accounting Officer with a letter of assurance covering the full reporting year. Letters of assurance provide an assessment of the effectiveness of the internal controls that support delivery of business objectives and departmental policies. To support this process, the Department continues to apply a second line of defence risk and control assessment process to evidence the effectiveness of risk management and controls within each group.
The Accounting Officer is satisfied that, collectively, his directors general effectively manage the governance and internal control structures within the businesses they lead and that he can rely on them to manage risks within their business. The directors general have identified several challenges this year which they are managing effectively within their teams. These include but are not restricted to: capacity and capability, fraud, error and debt and funding pressures.
Assurances covering DWP’s public bodies
For 2023 to 2024 the Director General, Disability, Health and Pensions provided assurance on the governance and control arrangements for the public bodies which deliver outcomes on DWP’s behalf. The Department’s Arm’s Length Bodies Partnership Division is responsible for holding its public bodies to account and ensuring that they work to the high standards expected of them. The Department has a range of oversight activity in place to provide assurance that each body is working effectively through robust governance arrangements. These include a range of standard financial control measures including a quarterly performance dashboard, which reports on delivery, finance, risks and change.
The annual assurance assessment of the Department’s public bodies complements its ongoing engagement and assurance activity, including quarterly accountability reviews with the bodies, attendance at the bodies’ audit and risk committees and ongoing senior day to day engagement with the bodies. This ensures that the Department has a proportionate oversight and understanding of the risks and opportunities that its bodies present to it.
The Department’s risk management approach is written into the framework documents that govern its relationship with its bodies. Each of the public bodies is responsible for identifying their own risks and risk management is overseen by their audit and risk assurance committees. The Department’s Arm’s Length Bodies Partnership Division reviews risks as part of the quarterly accountability review process. The Department’s oversight arrangements support the performance of each body, enhance the protection given to the Permanent Secretary as Principal Accounting Officer and assure the Departmental Board, the Executive Team and the Departmental Audit and Risk Assurance Committee that the Department has a good overview of its public bodies and meets HM Treasury and Cabinet Office expectations of assurance. Earlier this year the National Audit Office published its investigation into the Pensions Dashboards Programme (PDP). Ahead of publication, the Department had already conducted its own assurance review which found that it needed to better clarify its relationship and accountabilities with arm’s-length bodies. In response, DWP plans to strengthen arm’s-length bodies’ links to its own governance arrangements. For example, arm’s-length bodies delivering Government Major Projects Portfolio (GMPP) programmes where DWP is the policy sponsor will be required to regularly attend the Change Portfolio Board, as well as the Investment Committee.
The latest Cabinet Office guidance on conducting reviews of non-departmental public bodies stipulates that attention should be focused on the four quadrants of efficacy, efficiency, governance and accountability. A review of the Health and Safety Executive was published in May 2023, and the Pensions Regulator in September 2023. This followed reviews of all the Department’s other public bodies bar the Pensions Ombudsman. That review is due to take place in the second and third quarters of 2024.
The Department’s public appointments team, within the Arm’s Length Bodies Partnership Division, conducts all its recruitment for its ALB public appointments exercises (chairs, non-executive directors and members). The team collates statistics and information from each recruitment campaign to enable the Permanent Secretary to provide formal annual assurance to the Commissioner for Public Appointments that all public appointments made by DWP ministers are fully compliant with the Cabinet Office governance code on public appointments. All public body appointments activity for 2023 to 2024 is listed below.
| Public body | New appointment (up to 5 years) | Reappointment (up to 5 years) | Extension (up to 12 months) |
|---|---|---|---|
| Health and Safety Executive | Non-executive director Ken Rivers | Non-executive director Ged Nicholls – – Claire Sullivan | – |
| Money and Pensions Service | – | – | Non-executive Director Ann Harris |
| Industrial Injuries Advisory Council | – | Members Prof. John Cherrie – – Chris Stenton – – Dr Max Henderson – – Lesley Francois – – Dr Jennifer Hoyle – – Dr Daniel Shears | – |
| Social Security Advisory Committee | Members – – Les Allamby – – Rachel Chiu – – Daphne Hall – – Stephen Hardy – – Jacob Meagher – – Suzy Walton | Member Bruce Calderwood | – |
| The Pensions Ombudsman | Interim Chair Anthony Arter | Non-executive director Emir Faisal | Deputy Pensions Ombudsman Anthony Arter |
| The Pensions Regulator | – | Non-executive director Katie Kapernaros – – | |
| Christopher Morson | – | ||
| The Office for Nuclear Regulation | Interim Chair Dame Judith Hackitt – –Non-executive director Roger Hardy | – | – |
| National Employment Savings Trust | Non-executive director Helen Copinger-Symes – – Nina Hingorani-Crain – – Nikki Marsh | Non-executive director Chris Hitchen – – Martin Turner – – Karen Cham | – |
Assurance from HM Revenue and Customs
HM Revenue and Customs has provided the Department a letter of assurance that has been approved by its Departmental Audit and Risk Assurance Committee. It contains detail about its capacity to handle risk and highlights any significant issues that may impact on their control and management of the National Insurance Fund and related activities. It also provides detail of the integrity of its real time information that is shared with the Department. The following issues were raised in the letter of assurance: integrity of National Insurance records, Missing HRP, voluntary National Insurance contributions and Universal Credit. Further detail on these areas is contained in the fraud and error section of the Annual Report and Accounts. Detail on the integrity of real time information is available in the performance report.
A joint oversight board was created in July 2023 to support the internal assurance across Departments. The board is chaired jointly by the Director of Operational Excellence (HM Revenue and Customs) and the Director of Retirement Services (DWP). The board oversees and takes accountability for delivery of several cross departmental activities affecting National Insurance records and National Insurance credits.
Following the recommendations in the DWP 2022 to 2023 Public Accounts Committee report, the board also oversees the response to recommendation 5a – “to provide assurance to the Committee within the next twelve months over the integrity of the National Insurance records and how they interact with the DWP’s benefit system”. The scope for the Joint Oversight Board includes Missing Home Responsibility Protection (HRP), Universal Credit and Voluntary National Insurance contributions. Additionally, it can bring into scope other work that impacts on the effective administration of the National Insurance Fund where activity spans between HM Revenue and Customs and the Department.
In March 2024, the Government Internal Audit Agency (GIAA) undertook a review National Insurance Records Involving DWP. The GIAA made 10 recommendations for improvement. Work is underway to address these areas and progress is being overseen by the Joint Oversight Board.
Assurance from other sources
The National Audit Office (NAO) undertook value for money (VFM) studies and cross-government investigations during the year. They completed two VFM studies specific to DWP: Transforming Health Assessments for Disability Benefits and Progress in Implementing Universal Credit. The NAO also undertook an investigation into the Pensions Dashboards Programme, the report was published on the 10 May 2024 and a VFM study on the Department’s Approach to Customer Service, due for publication in July 2024. Examples of cross-government reports include Tackling Fraud and Corruption Against Government, Civil Service Workforce: Recruitment, Pay and Performance Management, Investigation into Whistleblowing in the Civil Service, Use of Artificial Intelligence in Government, Reducing the Harm from Illegal Drugs, and an Investigation into Supported Housing.
The NAO’s reports are presented to Parliament. The Public Accounts Committee (PAC) may hold an inquiry on the NAO reports and invite the Department to answer questions on it. PAC will produce its own report with recommendations and the Department responds to these through a Treasury Minute.
During 2023 to 2024, the Department attended four PAC oral evidence sessions covering Supported Housing, Revising Health Assessments for Disability Benefits, DWP Annual Report and Accounts 2022 to 2023, and Progress in Implementing Universal Credit. The PAC also held an evidence session on tackling fraud and corruption against government, which considered the government’s efforts to improve its counter-fraud capability. The Department was not a witness at this session, which was attended by officials from HM Treasury, the Cabinet Office, and the Public Sector Fraud Authority. NAO reports on the Department are available at www.nao.org.uk
During 2023 to 2024, the Infrastructure and Projects Authority (IPA) undertook two independent reviews. These included a review on the Health Transformation programme, providing assurance and recommendations for improvements to support government objectives, and, in April 2023 a review to assess the Department’s readiness to increase the volume of claimants moving to Universal Credit.
Programmes have ongoing engagement with the IPA, providing quarterly updates against their delivery confidence. Information on the IPA assessment of DWP’s GMPP programmes can be found in the IPA transparency report at www.gov.uk
Assurance opinion of the DWP Group Chief Internal Auditor
DWP’s Group Chief Internal Auditor (GCIA) provides independent assurance to DWP’s Permanent Secretary and the Departmental Board (via the Departmental Audit and Risk Assurance Committee – DARAC). The assurance opinion is derived from a risk-based plan of work which has been approved by the Executive Team and endorsed by DARAC, together with the GCIA’s wider knowledge of the business and other assurance provision. As with prior years, there were some changes to the planned programme of work during the year to ensure that it remained aligned to the changing risk landscape.
The GCIA has provided “moderate” assurance on the Department’s governance, risk management and control framework in 2023 to 2024. The opinion reflects the Department’s consistent governance, risk management and controls, with concerns remaining over the governance of fraud and error (Benefits and State Pensions) and of specific programmes.
A significant piece of work was undertaken by GIAA jointly with HM Revenue and Custom’s Internal Audit team on the National Insurance record.
Findings from other specific internal audit reviews have been taken into account in the assurance process which has fed into the overall governance statement.
The overarching themes covered by the GCIA’s report including the key feedback were:
- delivering a quality service: there is a commitment to continuous improvement across the Department; within that there is a need for improved processes and procedures, for example in relation to customer engagement utilising alternative formats which the department is mobilising to address.
- fraud and error: reviews undertaken in 2023 to 2024 have provided assurance that the Integrated Risk and Intelligence Service, Strategy Implementation Assurance , and Debt Enforcement have put in place strong operational arrangements and governance structures. Reducing fraud and error, though, remains a significant challenge for the Department.
- transformation: several programmes have undergone reprogramming and resets, a theme continued from previous years and the Department faces significant challenges in the scale, complexity, and volume of change operating in an environment of resource limitations. For Service Modernisation, strong controls over benefits management have been established.
- governance and accountability: The need for clearly defined roles, responsibilities and accountabilities has been highlighted in a number of audits, with good practice in these areas identified in others.
- capacity and capability: Internal Audit has suggested a skills gap assessment to better understand the workforce’s current capabilities and the requirements to meet the demands of the business, which continue to be a challenge in 2024 to 2025.
- digital, data and technology: new digital processes should enhance the use of management information; however, there remains a need to refine and embed arrangements to ensure that information is used to identify gaps, anomalies and demonstrate the effectiveness of processes. Strategic reference architecture needs to be implemented as a cross-department objective.
- core controls (people, finance, operations): better use of technology has strengthened several processes in the people and capability space.
Internal Audit coverage of on finance functional responsibilities identified areas of strength including financial management and forecasting. Further work is needed on project accounting processes and to improve the consistency and clarity of supporting guidance and advice for business cases.
Analytical Models Management
The Department continues to use a quality assurance framework that is embedded in its processes which covers its business-critical analytical models. The Department’s lead analysts are accountable for the quality of the models and forecasts in their area, and continue to develop and provide best practice guidance and training to all staff developing models. The Department has a list of analytical business critical models (BCMs) which are owned by the analytical community and includes information on quality assurance, ownership and impact.
In 2023, the Department expanded the framework to include business critical models within Finance Group, this framework is similar to the one used for analytical models.
The Department’s Policy Costings Scrutiny Committee and DEL Scrutiny Committee, scrutinises the different aspects of costings for each fiscal event. The Office for Budget Responsibility (OBR) examines DWP’s forecasts and costings for all benefits. The Department works closely with the OBR, liaising with them throughout the year on the key changes and issues ahead of the next fiscal event. This ensures their views on the economy and/or best practice are accurately and fully reflected in these models. After each fiscal event DWP conducts lessons learned exercises to identify what works, and areas it can improve on in the future. The Department also continues to oversee a programme of development activity to the process of producing resource forecasts, including the development of new modelling capability to provide enhanced scenario functionality.
Shared Services Connected Ltd
Shared Services Connected Ltd (SSCL) is the largest provider of critical business support services for government, police and defence clients delivering a contracted out shared finance, human resources and procurement services.
To facilitate the delivery of the shared services, SSCL is also responsible for the management of the Single Operating Platform system including its data, hosting, infrastructure management support, application management support, service management and performance management.
In 2023, the Cabinet Office opted to sell its 25% share in SSCL to Sopra Steria, SSCL’s parent company, who now fully own SSCL.
Cabinet Office Government People Group (GPG) is responsible for the Memorandum of Agreement for shared services between the Cabinet Office and the government departments. They provide an annual letter of assurance to all customers based upon the overall SSCL audit and assurance programme.
GPG have summarised the findings from various sources of assurance in the 2023 to 2024 Letter of Assurance dated 30 May 2024 as follows:
- PwC provided reasonable/moderate assurance based on five government specific reviews. This is an improvement from 2022 to 2023 when PwC provided limited assurance. Governance, risk management and control in relation to business-critical areas is generally satisfactory. Whilst there are some areas of weakness and non-compliance there are none related to DWP specifically. The findings are related to generic framework level provision.
-
GIAA completed five audits and have provided a limited opinion. This remains the same opinion that was provided for 2022 to 2023. The main concerns are:
- the absence of an automated duplicate identification system for expenses. This is being addressed and planned to be in place by September 2024
- service request management, particularly the absence of a qualitative service measure.
The findings provide the Department with sufficient assurance of the effectiveness of the controls employed by SSCL that were examined in the year.
There were no rectification plans required during the 2023 to 2024 audit period and there are no specific concerns relating to the Department that are likely to materially impact the statements included in the Annual Report and Accounts.
Whistleblowing
The Department and the Government Internal Audit Agency (GIAA) continued to collaborate to ensure that through GIAA’s arm’s length management of the Department’s whistleblowing hotline and its triaging of all whistleblowing cases, colleagues are guaranteed access to an independent and professional team with which they may raise concerns. This is in addition to colleagues being able to raise concerns externally, should they choose, with either the Civil Service Commission or the Comptroller and Auditor General at the National Audit Office (NAO).
This year, the collaboration extended to the Department and GIAA participating in a cross-government review of whistleblowing carried out by the NAO, which was reported to Parliament in December 2023 prior to being discussed at a hearing of the Public Accounts Committee in April 2024. The Department is aalready working with the Government People Group at the Cabinet Office to identify improvements to whistleblowing for 2024 to 2025, identified by the NAO’s report, including a survey of known whistleblowers to determine their experience of whistleblowing. In this context DWP will share with the Government People Group aspects of the Department’s arrangements that NAO highlighted as good practice, notably the Department’s use of disciplinary standards to protect whistleblowers from adverse treatment and the choice its colleagues have over where they might seek support in resolving their concerns.
In 2023 to 2024, the Department’s communications to colleagues and participation in the Civil Service’s ‘National Speak Up Week’ maintained the previous year’s high level of awareness of whistleblowing. Results from the DWP’s People Survey 2023, involving over 58,000 respondents, showed 91% of its colleagues understand the standards set out in the Civil Service Code, 76% understand how to raise a concern and 72% are confident that if they raised a concern, it would be thoroughly investigated. This success in maintaining relatively high awareness resulted in 56 whistleblowing cases being registered up to 31 March 2024, consistent with the previous year’s 51 cases. Once outstanding investigations have been completed to determine outcomes, anonymous details of all 56 cases will be reported internally to the Departmental Audit and Risk Assurance Committee and externally to the Cabinet Office.
Permanent Secretary’s conclusion
As Permanent Secretary, I am satisfied that the Department’s overall governance arrangements are adequate. The Department has continued to operate well in a challenging environment. Having noted the GIAA’s Moderate audit opinion and considered all the evidence, I am content with the Department’s system of internal controls and assured that continued improvements will be made to ensure it remains robust.
Information on how the Department works to prevent fraud and error in the benefits system and recover debts that are owed to it is provided in the Fraud, Error and Debt Report.
Remuneration and staff report
Remuneration policy
The pay of most Senior Civil Servants is set by the Prime Minister, following independent advice from the Senior Salaries Review Body. Details are available on www.gov.uk. This body also advises the Prime Minister on peers’ allowances; the pay, pensions, and allowances of MPs; and others whose pay is determined by the Ministerial and Other Salaries Act 1975.
Salaries are solely for the period in the year when an individual served as a member of DWP’s Executive Team.
Appointment of directors
Civil Service appointments are made in accordance with the Civil Service Commissioner’s Recruitment Principles. These principles require appointments to be made on merit and based on fair and open competition. However, there may be exceptions to this principle.
Unless stated otherwise, all appointments are open-ended. Early termination, other than for misconduct, would result in the individual receiving compensation as set out in the Civil Service Compensation Scheme.
See further information about the work of the Civil Service Commission
Salary
Salary includes gross salary, overtime, reserved rights to London weighting or London allowances, recruitment and retention allowance, private office allowances and any other allowance to the extent that they are subject to UK taxation. This report is based on accrued payments made by the Department and thus recorded in these accounts. In respect of ministers in the House of Commons, Departments bear only the cost of the additional ministerial remuneration; the salary for their services as an MP £86,584 (from 1 April 2023)[footnote 43] and various allowances to which they are entitled are borne centrally. However, the arrangement for ministers in the House of Lords is different in that they do not receive a salary but rather an additional remuneration, which cannot be quantified separately from their ministerial salaries. This total remuneration, as well as the allowances to which they are entitled, is paid by the Department.
Bonuses
Bonuses are non-consolidated variable performance related payments awarded to DWP’s civil servants below SCS grade at the end of the year. To be eligible, staff need to be in post on 31 March and 1 July and must not be undergoing formal poor performance action. Bonus payments are normally paid in July for performance in the preceding financial year, therefore payments made in 2023 to 2024 relate to performance between 1 April 2022 and 31 March 2023.
In addition, SCS bonus payments are based on performance assessments against the framework for SCS Performance Management and Pay prescribed by Cabinet Office. Those that are assessed as top are eligible for a non-consolidated performance related payment.
Benefits in kind
The monetary value of benefits in kind covers any benefits provided by the Department and treated by HM Revenue and Customs as a taxable emolument.
Conflict of interest
DWP keeps a register of its directors’ interests. This contains details of company directorships and other significant interests held by those members. None of DWP’s directors or ministers held directorships that conflicted with their management responsibilities in 2023 to 2024.
A list of ministerial board members’ interests can be viewed online at DWP Register of board members interests
Remuneration and pension entitlements for ministers and executive directors
Ministers’ pay
(This information is subject to audit)
2023 to 2024
| Ministers | Salary £ | Full year equivalent £ | Severance payments £ | Pension benefits to nearest £1,000[footnote 44] | Total to nearest £1,000[footnote 45] |
|---|---|---|---|---|---|
| Rt Hon Mel Stride MP: from 25 October 2022 | 67,505 | 67,505 | – | 18,000 | 86,000 |
| Mims Davies MP: from 27 October 2022 | 22,375 | 22,375 | – | 6,000 | 28,000 |
| Mims Davies MP: from 26 July 2019 – Left 6 July 2022 | – | – | – | – | – |
| Viscount James Younger: from 1 January 2023 | 107,335 | 107,335 | – | 58,000 | 165,000 |
| Jo Churchill MP: from 13 November 2023 | 11,248 | 31,680 | – | 3,000 | 14,000 |
| Paul Maynard MP: from 13 November 2023 | 8,577 | 22,375 | – | 2,000 | 11,000 |
| Guy Opperman MP: from 27 October 2022 – Left 12 November 2023 | 20,655 | 31,680 | – | 5,000 | 26,000 |
| Guy Opperman MP: from 14 June 2017 – Left 8 September 2022 | – | – | – | – | – |
| Tom Pursglove MP: from 27 October 2022 – Left 6 December 2023 | 23,760 | 31,680 | – | 5,000 | 29,000 |
| Laura Trott MBE MP: from 27 October 2022 – Left 12 November 2023 | 14,917 | 22,375 | – | 3,000 | 18,000 |
| Rt Hon Thérèse Coffey MP: from 8 September 2019 – Left 5 September 2022 | – | – | – | – | – |
| Baroness Stedman-Scott OBE DL: from 30 July 2019 – Resigned 31 December 2022 | – | – | – | – | – |
| Rt Hon Chloe Smith MP: from 16 September 2021 – Left 24 October 2022 | – | – | – | – | – |
| David Rutley MP: from 17 September 2021 – Left 19 September 2022 | – | – | – | – | – |
| Julie Marson MP: from 8 July 2022 – Left 19 September 2022 | – | – | – | – | – |
| Victoria Prentis MP: from 7 September 2022 – Left 24 October 2022 | – | – | – | – | – |
| Alex Burghart MP: from 20 September 2022 – Left 26 October 2022 | – | – | – | – | – |
| Claire Coutinho MP: from 21 September 2022 – Left 26 October 2022 | – | – | – | – | – |
2022 to 2023
| Ministers | Salary £ | Full year equivalent £ | Severance payments £ | Pension benefits to nearest £1,000[footnote 46] | Total to nearest £1,000[footnote 47] |
|---|---|---|---|---|---|
| Rt Hon Mel Stride MP: from 25 October 2022 | 29,397 | 67,505 | – | 7,000 | 37,000 |
| Mims Davies MP: from 27 October 2022 | 9,323 | 22,375 | – | 2,000 | 12,000 |
| Mims Davies MP: from 26 July 2019 – Left 6 July 2022 | 5,955 | 22,375 | – | 1,000 | 7,000 |
| Viscount James Younger: from 1 January 2023 | 26,834 | 107,335 | – | 4,000 | 31,000 |
| Jo Churchill MP: from 13 November 2023 | – | – | – | – | – |
| Paul Maynard MP: from 13 November 2023 | – | – | – | – | – |
| Guy Opperman MP: from 27 October 2022 – Left 12 November 2023 | 13,626 | 31,680 | – | 3,000 | 17,000 |
| Guy Opperman MP: from 14 June 2017 – Left 8 September 2022 | 9,820 | 22,375 | – | 2,000 | 12,000 |
| Tom Pursglove MP: from 27 October 2022 – Left 6 December 2023 | 13,200 | 31,680 | – | 3,000 | 17,000 |
| Laura Trott MBE MP: from 27 October 2022 – Left 12 November 2023 | 9,624 | 22,375 | – | 2,000 | 12,000 |
| Rt Hon Thérèse Coffey MP: from 8 September 2019 – Left 5 September 2022 | 33,753 | 67,505 | – | 3,000 | 37,000 |
| Baroness Stedman-Scott OBE DL: from 30 July 2019 – Resigned 31 December 2022 | 80,501 | 107,335 | 17,742[footnote 48] | – | 98,000 |
| Rt Hon Chloe Smith MP: from 16 September 2021 – Left 24 October 2022 | 23,953 | 67,505 | 16,876 | 6,000 | 47,000 |
| David Rutley MP: from 17 September 2021 – Left 19 September 2022 | 11,187 | 22,375 | – | – | 11,000 |
| Julie Marson MP: from 8 July 2022 – Left 19 September 2022 | – | – | – | – | – |
| Victoria Prentis MP: from 7 September 2022 – Left 24 October 2022 | 2,640 | 31,680 | – | 1,000 | 4,000 |
| Alex Burghart MP: from 20 September 2022 – Left 26 October 2022 | 2,548 | 22,375 | – | – | 3,000 |
| Claire Coutinho MP: from 21 September 2022 – Left 26 October 2022 | 2,486 | 22,375 | – | – | 3,000 |
Baroness Stedman-Scott opted out of the Parliamentary Contributory Pension Fund (PCPF) on 30 June 2021 the disclosed amount relates to the period while she was in the scheme. Her salary disclosed above includes Lord Office-holders Allowance of £27,275 for 2022 to 2023 until her resignation on 31 December 2022. She is currently in the process of repaying the severance award disclosed in 2022 to 2023 for her time with the Department, which will be repaid in instalments. The final payment is due in March 2029.
David Rutley has been opted out of the PCPF throughout his appointment, he left the Department on 19 September 2022.
Julie Marson MP was an unpaid minister by the Department. A severance payment of £4,479 was paid by HM Treasury.
Mims Davies MP received a severance payment of £5,593 in July 2022 which was repaid in full in January 2023. Guy Opperman MP received a severance payment of £5,593 in September 2022 which was repaid in full in November 2022. David Rutley MP received a severance payment of £5,593 in October 2022 which was repaid in full in November 2022. The Prime Minister has determined that government ministers in the Commons should receive salaries set at the same rate as that claimed by equivalent ministers under the government from 2015 to 2017. This rate is less than what the Ministerial and Other Salaries Act 1975 entitles ministers to. The table above shows salaries actually received and not salaries entitled to.
No minister received any benefit in kind.
Executive directors’ pay
(This information is subject to audit)
2023 to 2024
| Executive directors | Salary £000 | Bonus payments £000 | Pension benefits to nearest £1,000[footnote 49] | Benefit in kind to nearest £100 | Total to nearest £1,000[footnote 50] |
|---|---|---|---|---|---|
| Sir Peter Schofield KCB from 18 July 2016 | 195 to 200 | 10 to 15 | – | – | 210 to 215 |
| Debbie Alder CB from 1 January 2014 | 120 to 125 | 10 to 15 | – | – | 135 to 140 |
| Neil Couling CB CBE from 1 October 2014 | 180 to 185 | 0 to 5 | – | – | 185 to 190 |
| Amanda Reynolds from 1 February 2021 | 170 to 175 | 0 to 5 | – | – | 170 to 175 |
| Katie Farrington from 15 March 2021 | 130 to 135 | 10 to 15 | – | – | 145 to 150 |
| Barbara Bradley from 20 June 2022 | 165 to 170 | – | – | – | 165 to 170 |
| Catherine Vaughan from 1 November 2022 | 160 to 165 | 10 to 15 | – | – | 175 to 180 |
| Sophie Dean from 5 December 2022 | 85 to 90 | – | – | – | 85 to 90 |
| Katherine Green from 5 December 2022[footnote 52] | 85 to 90 | – | – | – | 85 to 90 |
| Helen Pickles from 1 August 2023 | 90 to 95 (FYE 130-135) | 10 to 15 | – | – | 105 to 110 |
| Richard Corbridge from 11 April 2023 | 190 to 195 (FYE 195-200) | 0 to 5 | – | – | 195 to 200 |
| Simon McKinnon CB CBE from 1 January 2019 – Left 30 June 2023 | 40 to 45 (FYE 160-165) | – | – | – | 40 to 45 |
| Jonathan Mills from 29 August 2017 – Left 5 June 2022 | – | – | – | – | – |
| Nick Joicey CB from 30 July 2018 – Left 31 August 2022 | – | – | – | – | – |
| Karen Gosden from 4 January 2022 – retired 30 June 2022 | – | – | – | – | – |
| Kate Davies from 20 June 2022 – – Left 11 December 2022 | – | – | – | – | – |
2022 to 2023
| Executive directors | Salary £000 | Bonus payments £000 | Pension benefits to nearest £1,000[footnote 49] | Benefit in kind to nearest £100 | Total to nearest £1,000[footnote 50] |
|---|---|---|---|---|---|
| Sir Peter Schofield KCB from 18 July 2016 | 195 to 200 | – | 16 | – | 205 to 210 |
| Debbie Alder CB from 1 January 2014 | 155 to 160 | 10 to 15 | 59 | – | 230 to 235 |
| Neil Couling CB CBE from 1 October 2014 | 165 to 170 | 0 to 5 | -52[footnote 51] | – | 115 to 120 |
| Amanda Reynolds from 1 February 2021 | 155 to 160 | 10 to 15 | 61 | – | 235 to 240 |
| Katie Farrington from 15 March 2021 | 130 to 135 | – | 44 | – | 170 to 175 |
| Barbara Bradley from 20 June 2022 | 130 to 135 | – | 51 | – | 180 to 185 |
| Catherine Vaughan from 1 November 2022 | 60 to 65 (FYE 145 to 150) | – | 24 | – | 85 to 90 |
| Sophie Dean from 5 December 2022 | 25 to 30 (FYE 80 to 85) | 0 to 5 | -1[footnote 51] | – | 25 to 30 |
| Katherine Green from 5 December 2022 | 25 to 30 | 0 to 5 | 11 | – | 35 to 40 |
| Helen Pickles from 1 August 2023 | – | – | – | – | – |
| Richard Corbridge from 11 April 2023 | – | – | – | – | – |
| Simon McKinnon CB CBE from 1 January 2019 – Left 30 June 2023 | 160 to 165 | 10 to 15 | 62 | – | 235 to 240 |
| Jonathan Mills from 29 August 2017 – Left 5 June 2022 | 25 to 30 (FYE 135 to 140) | 0 to 5 | 2 | – | 30 to 35 |
| Nick Joicey CB from 30 July 2018 – Left 31 August 2022 | 75 to 80 (FYE 155 to 160) | – | 0 | – | 75 to 80 |
| Karen Gosden from 4 January 2022 – retired 30 June 2022 | 35 to 40 (FYE 110 to 115) | – | 17 | 800 | 50 to 55 |
| Kate Davies from 20 June 2022 – – Left 11 December 2022 | 70 to 75 (FYE 120 to 125) | 5 to 10 | 43 | – | 120 to 125 |
Accrued pension benefits for directors are not included in this table for 2023 to 2024 due to an exceptional delay in the calculation of these figures following the application of the public service pension remedy[footnote 53].
All pension benefits for 2022 to 2023 are quoted gross and do not take account of any actual or potential reduction to amounts received resulting from taxation which may be due when pension benefits exceed the annual allowance or are taken in excess of the lifetime allowance.
Karen Gosden was the only director to receive benefit in kind during 2022 to 2023. This related to use of a vehicle.
Caroline Croft (appointed May 2023) holds the role of Director General, Employment with Economic Recovery and UK Governance and is DWP’s legal advisor. Prior to Caroline’s appointment Mel Nebhrajani (appointed October 2021 to May 2023) held the role. DWP’s legal services are provided by the Government Legal Department (GLD) and as such, their remuneration is disclosed in GLD’s Annual Report and Accounts 2023 to 2024.
Fair pay disclosure
(This information is subject to audit)
Reporting bodies are required to disclose the relationship between the remuneration of the highest-paid director in their organisation and the lower, median and upper quartile remuneration of the organisation’s workforce.
Total remuneration includes salary, non-consolidated performance related pay and benefits-in-kind. It does not include severance payments, employer pension contributions and the cash equivalent transfer value of pensions.
The banded remuneration of the highest-paid director in the DWP in the financial year 2023 to 2024 was £210,000 to £215,000 (2022 to 2023: £190,000 to £195,000). This was 6.82 times (2022 to 2023: 6.81) the median remuneration of the workforce, which was £31,150 (2022 to 2023: £28,262).
The table below shows further analysis of the DWP remuneration pay ratios across the workforce.
| Year | 25th Percentile Pay Ratio | Median Pay Ratio | 75th Percentile Pay Ratio |
|---|---|---|---|
| 2023 to 2024 | 7.36:1 | 6.82:1 | 5.96:1 |
| 2022 to 2023 | 8.23:1 | 6.81:1 | 5.89:1 |
There has been a reduction in the 25th percentile pay ratio and an increase in the median and 75th percentile. The main reason for the reduction in the 25th percentile ratio is:
- a high majority of colleagues in delegated grades in DWP were exceptionally eligible for a non-consolidated, pro-rated, payment of £1,500. This was in addition to the usual end of year consolidated awards.
- additionally, whilst the majority of colleagues received at least a 4.5% increase, eligible AO colleagues received a 6.25% and EO National colleagues received a 4.92% increase. Median percentiles reduced due to the volume of AO and EO colleagues as AO and EO colleagues make up over 80% of headcount.
A contributing factor to the increase in the 75th percentile ratio is:
- the highest paid director did not receive a bonus in the financial year 2022 to 2023 but did receive a bonus in 2023 to 2024.
Pay and benefits of employees
The tables below show the total remuneration and the salary element of total remuneration for each of the quartiles.
25th percentile total remuneration
| Year | Total pay and benefits | Salary component |
|---|---|---|
| 2023 to 2024 | £28,866 | £27,223 |
| 2022 to 2023 | £23,389 | £23,244 |
Median total remuneration
| Year | Total pay and benefits | Salary component |
|---|---|---|
| 2023 to 2024 | £31,150 | £29,500 |
| 2022 to 2023 | £28,262 | £28,117 |
75th percentile total remuneration
| Year | Total pay and benefits | Salary component |
|---|---|---|
| 2023 to 2024 | £35,629 | £33,979 |
| 2022 to 2023 | £32,660 | £32,515 |
In 2023 to 2024 and 2022 to 2023 no employees received remuneration in excess of the highest-paid director. Banded remuneration ranged from £22,000 to £22,500 to £210,000 - £215,000 (2022 to 2023: £18,000 to £18,500 to £190,000 to £195,000).
In 2023 to 2024, 62 employees (2022 to 2023, 176) who were engaged on temporary contracts were paid in excess of the highest paid director providing predominately Digital specialist support. Annualised remuneration ranged from £218,000 to £426,000 per annum (2022 to 2023 £195,000 to £396,000).
Percentage change in remuneration from 2022 to 2023
The table below shows the overall percentage change in total remuneration across DWP workforce.
| Percentage change from prior year | Salary and allowances | Performance pay and bonuses payable[footnote 54] | Total remuneration |
|---|---|---|---|
| Highest paid director | 3% | – | 11% |
| Employees | 6% | 746% | 10% |
On average, employees, excluding the highest paid director, had a pay and benefits increase of 10% in accordance with Civil Service Pay Remit 2023 to 2024, Senior Civil Service Pay Award 2023 to 2024 and PSRC guidance. This increase includes a non-consolidated, one-off, pro-rated, payment of £1,500 for colleagues in delegated grades in DWP. This was in addition to the usual end of year consolidated awards. This one-off payment explains the significant increase in Performance pay and bonuses payable to employees.
The highest paid director had an increase in total remuneration due to an increase in salary and allowances and bonus awarded in the year.
The employees had an increase in total remuneration due to an increase in salary and allowances, and one off non-consolidated payment.
Non-executive directors’ fees
(This information is subject to audit)
| Non-executive directors | Board | Fees 2023 to 2024 to the nearest £1,000 | Benefit in kind 2023 to 2024 to the nearest £100 | Fees 2022 to 2023 to the nearest £1,000 | Benefit in kind 2022 to 23 to the nearest £100 | |
|---|---|---|---|---|---|---|
| David Holt from 03 May 2019 to 13 March 2023 | Departmental Board, DARAC chair, Health Transformation board chair and Delivery Board | – | – | 19,000 | – | – |
| Tim Nolan from 01 July 2019 to 30 June 2022 | DARAC | – | – | 4,000 | – | – |
| Ashley Machin from 13 November 2020 to 12 November 2023 – – Re-appointed 13 Nov 23 to 12 Jan 24 – – Re-appointed from 13 Jan 24 to 11 July 25 | Departmental Board, DARAC, Non-executive Directors and Executive Team Board, Transformational Advisory Committee and NOMS | 20,000 | – | 20,000 | – | |
| Eleanor Shawcross from 10 June 2020 to 31 May 2022 | Departmental Board and Delivery Board | – | – | 3,000 | – | |
| Nick Markham from 07 July 2020 to 25 September 2022 | Lead non-executive, Departmental Board, Delivery Board and NOMS | – | – | 10,000 | – | |
| Sally Cheshire from 10 August 2020 to 09 August 2023 – – Re-appointed from 10 August 2023 to 9 August 2026 | DARAC | 15,000 | – | 15,000 | – | |
| Ian Wilson from 10 August 2020 to 09 August 2023 – – Re-appointed from 10 August 2023 to 9 August 2026 | DARAC | 15,000 | – | 15,000 | – | |
| Valerie Hughes-D’Aeth from 09 February 2021 to 08 February 2024 – – Re-appointed 9 Feb 24 to 8 Feb 2027 | Departmental Board, Non-executive Directors and Executive Team Board, NOMS (chair) and Portfolio Board | 20,000 | – | 20,000 | – | |
| David Bennett from 24 February 2021 to 23 February 2024 – – Re-appointed 24 Feb 23 to 23 May 2024 | Departmental Board, Non-executive Directors and Executive Team Board and Serious Case Panel chair | 20,000 | – | 20,000 | – | |
| John McGlynn from 05 August 2021 to 04 Feb 2023 – – Re-appointed 5 Feb 23 to 4 Aug 2024 | UC Programme Board Chair | Fee waived | – | Fee waived | – | |
| Charlie Steel from 03 September 2021 to 02 September 2024 | DARAC (interim chair), Departmental Board Transformation Advisory Committee | 20,000 | – | 15,000 | – | |
| Simon Sear from 03 September 2021 to 02 September 2024 | Non-executive Board Member – Transformation Advisory Committee | 15,000 | – | 15,000 | – | |
| Arabel Bailey from 03 September 2021 to 02 September 2024 | Non-executive Board Member – Transformation Advisory Committee (interim chair) | 20,000 | – | 18,000 | – | |
| Reverend Professor Gina Radford from 30 March 2023 to 29 March 2026 | Departmental Board | 19,000 | – | – | – | |
| Total | 163,000 | – | 174,000 | – | – |
Totals may not sum due to rounding of individual figures.
Ministers’ and executive directors’ pensions
(This information is subject to audit)
| Ministers | Total accrued pension at age 65 as at 31 March 2024 £000 | Real increase in pension at age 65 £000 | Cash equivalent transfer value at 31 March 2024 £000 | Cash equivalent transfer value at 31 March 2023[footnote 55] £000 | Real increase in cash equivalent transfer value £000 |
|---|---|---|---|---|---|
| Rt Hon Thérèse Coffey MP | – | – | – | 56 | – |
| Guy Opperman MP – –1 Apr 2022 to 8 Sep 2022 | – | – | – | 46 | – |
| Guy Opperman MP – – 1 Apr 2023 to 12 Nov 2023 | 0 to 5 | 0 to 2.5 | 68 | 59 | 4 |
| Mims Davies MP – – 1 Apr 2022 to 6 Jul 2022 | – | – | – | 22 | – |
| Mims Davies MP – – | 0 to 5 | 0 to 2.5 | 41 | 32 | 4 |
| Baroness Stedman-Scott OBE DL | – | – | – | – | – |
| Rt Hon Chloe Smith MP | – | – | – | 61 | – |
| David Rutley MP | – | – | – | – | – |
| Victoria Prentis MP | – | – | – | 18 | – |
| Alex Burghart MP | – | – | – | 4 | – |
| Claire Coutinho MP | – | – | – | – | – |
| Rt Hon Mel Stride MP | 0 to 5 | 0 to 2.5 | 81 | 54 | 16 |
| Tom Pursglove MP | 0 to 5 | 0 to 2.5 | 24 | 18 | 2 |
| Laura Trott MBE MP | 0 to 5 | 0 to 2.5 | 5 | 2 | 1 |
| Viscount James Younger | 15 to 20 | 2.5 to 5 | 374 | 302 | 54 |
| Jo Churchill MP | 0 to 5 | 0 to 2.5 | 47 | 41 | 3 |
| Paul Maynard MP | 0 to 5 | 0 to 2.5 | 25 | 22 | 2 |
Where a minister joined or left the Department part way through the year, the ‘cash equivalent transfer value’ column refers to those dates and not 31 March.
| Executive directors | Accrued pension at pension age as at 31 March 2024 £000 | Real increase in pension and related lump-sum at pension age £000 | Cash equivalent transfer value at 31 March 2024 £000 | Cash equivalent transfer value at 31 March 2023[footnote 56] £000 | Real increase in cash equivalent transfer value £000 | |
|---|---|---|---|---|---|---|
| Sir Peter Schofield KCB | – | – | – | 1,441 | – | |
| Debbie Alder CB | – | – | – | 623 | – | |
| Neil Couling CB CBE | – | – | – | 1,784 | – | |
| Jonathan Mills | – | – | – | 701 | – | |
| Nick Joicey CB | – | – | – | 1,026 | – | |
| Simon McKinnon CB CBE | – | – | – | 931 | – | |
| Amanda Reynolds | – | – | – | 93 | – | |
| Katie Farrington | – | – | – | 640 | – | |
| Karen Gosden | – | – | – | 1,143 | ||
| Barbara Bradley | – | – | – | 35 | – | |
| Kate Davies | – | – | – | 353 | – | |
| Sophie Dean | – | – | – | 365 | – | |
| Katherine Green | – | – | – | 520 | – | |
| Catherine Vaughan | – | – | – | 323 | ||
| Helen Pickles | – | – | – | – | – | - |
| Richard Corbridge | – | – | – | – | – | - |
Accrued pension benefits for directors are not included in this table for 2023 to 2024 due to an exceptional delay in the calculation of these figures following the application of the public service pension remedy[footnote 57].
All pension benefits for 2022 to 2023 are quoted gross and do not take account of any actual or potential reduction to amounts received resulting from taxation which may be due when pension benefits are taken in excess of the lifetime allowance.
Where an executive director leaves or joins the Department part way through the year, the ‘cash equivalent transfer value’ column refers to the value at the date of joining or leaving.
Any members affected by the Public Service Pensions Remedy were reported in the 2015 scheme for the period between 1 April 2015 and 31 March 2022 in 2022 to 2023, but are reported in the legacy scheme for the same period in 2023 to 2024.
Ministerial pensions
Pension benefits for ministers are provided by the Parliamentary Contributory Pension Fund (PCPF). The scheme is made under statute and the rules are set out in the ministers’ etc. Pension Scheme 2015, available at: www.mypcpfpension.co.uk
Ministers who are Members of Parliament (MP) may also accrue an MP’s pension under the PCPF (details of which are not included in this report). A new MP’s pension scheme was introduced from May 2015, although members who were aged 55 or older on 1 April 2013 have transitional protection to remain in the previous final salary pension scheme. Benefits for ministers are payable from State Pension age under the 2015 scheme. Pensions are revalued annually in line with Pensions Increase legislation both before and after retirement. The contribution rate from May 2015 is 11.1% and the accrual rate is 1.775% of pensionable earnings.
The figure shown for pension value includes the total pension payable to the member under both the pre and post 2015 ministerial pension schemes.
Further details of the scheme are available at: www.mypcpfpension.co.uk
Civil Service Pensions
Pension benefits are provided through the Civil Service pension arrangements. Before 1 April 2015, the only scheme was the Principal Civil Service Pension Scheme (PCSPS), which is divided into a few different sections – classic, premium, and classic plus provide benefits on a final salary basis, whilst nuvos provides benefits on a career average basis. From 1 April 2015 a new pension scheme for civil servants was introduced – the Civil Servants and Others Pension Scheme or alpha, which provides benefits on a career average basis. All newly appointed civil servants, and the majority of those already in service, joined the new scheme.
The PCSPS and alpha are unfunded statutory schemes. Employees and employers make contributions (employee contributions range between 4.6% and 8.05%, depending on salary). The balance of the cost of benefits in payment is met by monies voted by Parliament each year. Pensions in payment are increased annually in line with the Pensions Increase legislation. Instead of the defined benefit arrangements, employees may opt for a defined contribution pension with an employer contribution, the partnership pension account.
In alpha, pension builds up at a rate of 2.32% of pensionable earnings each year, and the total amount accrued is adjusted annually in line with a rate set by HM Treasury. Members may opt to give up (commute) pension for a lump sum up to the limits set by the Finance Act 2004. All members who switched to alpha from the PCSPS had their PCSPS benefits ‘banked’, with those with earlier benefits in one of the final salary sections of the PCSPS having those benefits based on their final salary when they leave alpha.
The accrued pensions shown in this report are the pension the member is entitled to receive when they reach normal pension age, or immediately on ceasing to be an active member of the scheme if they are already at or over normal pension age. Normal pension age is 60 for members of classic, premium, and classic plus, 65 for members of nuvos, and the higher of 65 or State Pension Age for members of alpha. The pension figures in this report show pension earned in PCSPS or alpha – as appropriate. Where a member has benefits in both the PCSPS and alpha, the figures show the combined value of their benefits in the two schemes but note that the constituent parts of that pension may be payable from different ages.
When the government introduced new public service pension schemes in 2015, there were transitional arrangements which treated existing scheme members differently based on their age. Older members of the PCSPS remained in that scheme, rather than moving to alpha. In 2018, the Court of Appeal found that the transitional arrangements in the public service pension schemes unlawfully discriminated against younger members.
As a result, steps are being taken to remedy those 2015 reforms, making the pension scheme provisions fair to all members. The public service pensions remedy[footnote 58] is made up of two parts. The first part closed the PCSPS on 31 March 2022, with all active members becoming members of alpha from 1 April 2022. The second part removes the age discrimination for the remedy period, between 1 April 2015 and 31 March 2022, by moving the membership of eligible members during this period back into the PCSPS on 1 October 2023. This is known as “rollback”.
For members who are in scope of the public service pension remedy, the calculation of their benefits for the purpose of calculating their Cash Equivalent Transfer Value and their single total figure of remuneration, as of 31 March 2023 and 31 March 2024, reflects the fact that membership between 1 April 2015 and 31 March 2022 has been rolled back into the PCSPS. Although members will in due course get an option to decide whether that period should count towards PCSPS or alpha benefits, the figures show the rolled back position i.e., PCSPS benefits for that period.
The partnership pension account is an occupational defined contribution pension arrangement which is part of the Legal & General Mastertrust. The employer makes a basic contribution of between 8% and 14.75% (depending on the age of the member). The employee does not have to contribute but, where they do make contributions, the employer will match these up to a limit of 3% of pensionable salary (in addition to the employer’s basic contribution). Employers also contribute a further 0.5% of pensionable salary to cover the cost of centrally provided risk benefit cover (death in service and ill health retirement).
Further details about the Civil Service pension arrangements can be found at the website www.civilservicepensionscheme.org.uk
Cash equivalent transfer value (CETV) – ministers and executive directors
(This information is subject to audit)
This is the actuarially assessed capitalised value of the pension scheme benefits accrued by a member at a particular point in time. The benefits valued are the member’s accrued benefits and any contingent spouse’s pension payable from the scheme. A CETV is a payment made by a pension scheme or arrangement to secure pension benefits in another pension scheme or arrangement when the member leaves a scheme and chooses to transfer the benefits accrued in their former scheme.
The pension figures shown relate to the benefits the individual has accrued from their total service. For ministers that is all their time as a minister, not just their current employment. For executive directors, that is all the time they’ve been a member of that pension scheme, not just the time they were in a senior role.
The figures include the value of any pension benefit in another scheme or arrangement, which the member has transferred to the civil service pension arrangements. They also include any additional pension benefit accrued to the member as a result of their buying additional pension benefits at their own cost.
CETVs are calculated in accordance with the Occupational Pension Schemes (Transfer Values) (Amendment) Regulations 2008. They don’t take account of any actual or potential reduction to benefits resulting from lifetime allowance tax that may be due when pension benefits are taken.
CETV figures are calculated using the guidance on discount rates for calculating unfunded public pension contribution rates that was extant at 31 March 2024.
Real increase in the value of the CETV
This is the element of the increase in accrued pension funded by the Exchequer for ministers and by the employer for executive directors. It excludes increases in accrued pension due to inflation and contributions paid by the minister or employee. It is worked out using common market valuation factors for the start and end of the period.
Average staff numbers and composition[footnote 59]
(This information is subject to audit)
The average number of whole-time equivalent people employed during the year is shown in the table below.
| Permanent staff | Others | Ministers | Special Advisers | Number Total 2023 to 2024 | Number Total 2022 to 2023 | |
|---|---|---|---|---|---|---|
| Number of staff | 81,334 | 2,253 | 6 | 3 | 83,596 | 83,537 |
| Staff engaged on capital projects | 233 | 17 | 0 | 0 | 250 | 236 |
| Total | 81,567 | 2,270 | 6 | 3 | 83,846 | 83,773 |
| Of which: Core Department | 77,320 | 2,033 | 6 | 3 | 79,362 | 79,437 |
| Of which: Arm’s Length Bodies | 4,247 | 237 | 0 | 0 | 4,484 | 4,336 |
| Total | 81,567 | 2,270 | 6 | 3 | 83,846 | 83,773 |
Senior Civil Servants
DWP’s executive directors are all Senior Civil Servants. In total there were 302 individual Senior Civil Servants, totalling 293.4 whole-time equivalents, as at 31 March 2024. This is an increase on last year.
| Senior Civil Servant headcount by pay band | March 2019 | March 2020 | March 2021 | March 2022 | March 2023 | March 2024 | |
|---|---|---|---|---|---|---|---|
| Permanent Secretary | £150,000 to £200,000 | 1 | 1 | 1 | 1 | 1 | 1 |
| SCS3 | £141,000 to £200,000 | 5 | 5 | 7 | 7 | 9 | 9 |
| SCS2 | £97,000 to £158,585 | 43 | 46 | 46 | 55 | 61 | 57 |
| SCS1 | £75,000 to £125,726 | 168 | 165 | 186 | 205 | 215 | 235 |
| Total | 217 | 217 | 240 | 268 | 286 | 302 |
Staff expenditure
(This information is subject to audit)
| Permanently employed staff £000 | Others £000 | Ministers £000 | 2023 to 2024 Total £000 | 2022 to 2023 Total £000 | |
|---|---|---|---|---|---|
| Wages and salaries | 2,878,998 | 200,933 | 276 | 3,080,207 | 2,816,266 |
| Employers’ National Insurance | 300,918 | 651 | 31 | 301,600 | 270,755 |
| Superannuation and pension costs | 720,959 | – | – | 720,959 | 673,352 |
| Total | 3,900,875 | 201,584 307 | 4,102,766 | 3,760,373 | |
| Less recoveries in respect of outward secondments | (581) | – | – | (581) | (494) |
| Total net costs | 3,900,294 | 201,584 | 307 | 4,102,185 | 3,759,879 |
| Charged to staff budgets £000 | Charged to Capital budgets £000 | Total £000 | |
|---|---|---|---|
| Core Department | 3,785,503 | 14,671 | 3,800,174 |
| ALBs | 317,263 | 3,076 | 320,339 |
| Total | 4,102,766 | 17,747 | 4,120,513 |
The Principal Civil Service Pension Scheme (PCSPS) and the Civil Servant and Other Pension Scheme (CSOPS) – known as ‘alpha’, are unfunded multi-employer defined benefit schemes. However, it is not possible to identify DWP’s share of the underlying assets and liabilities. A full actuarial valuation was carried out as at 31 March 2020. Details can be found in the resource accounts of the Cabinet Office www.civilservicepensionscheme.org.uk.
For 2023 to 2024, DWP paid employer contributions of £715 million to the PCSPS and the CSOPS (2022 to 2023: £667 million). These were at one of four rates in the range 26.6% to 30.3% (2022 to 2023: 26.6% to 30.3%) of pensionable pay, based on salary bands. The scheme actuary reviews employer contributions usually every four years following a full scheme valuation. The contribution rates are set to meet the cost of the benefits accruing during 2023 to 2024 to be paid when the member retires and not the benefits paid during this period to existing pensioners.
Outstanding contributions of £75 million (2022 to 2023: £67 million) were payable to the Civil Superannuation Vote at 31 March 2024 and are included in trade payables and other liabilities (see note 15).
Employees can opt to open a partnership pension account, a stakeholder pension with an employer contribution. In total DWP paid employers contributions of £3.3 million (2022 to 2023: £3.1 million) to appointed stakeholder pension providers. Employer contributions are age-related and ranged from 8% to 14.75%. The Department also matches employee contributions up to 3% of pensionable pay. In addition, employer contributions of £0.1 million were payable to the PCSPS to cover the cost of the future provision of lump-sum benefits on death in service or ill health retirement of these employees.
Contributions due to the partnership pension providers at the reporting period date were £0.3 million. There were no prepaid contributions at that date.
In 2023 to 2024, 108 people (2022 to 2023: 77 people) retired early on ill-health grounds. The total additional accrued pension liabilities in the year were £537,002 (2022 to 2023: £373,052).
Reporting of Civil Service and other compensation schemes – exit packages
(This information is subject to audit)
Table 1: 2023 to 2024
Core Department
| Exit package cost band | Number of compulsory redundancies[footnote 60] | Number of other departures agreed | Total number of exit packages by cost band |
|---|---|---|---|
| < £10,000 | 48 | 10 | 58 |
| £10,001-£25,000 | 36 | 56 | 92 |
| £25,001-£50,000 | 47 | 190 | 237 |
| £50,001-£100,000 | 29 | 11 | 40 |
| £100,001-£150,000 | 2 | 0 | 2 |
| £150,001-£200,000 | 0 | 0 | 0 |
| Total number of exit packages | 162 | 267 | 429 |
| Total cost £000 | 4,583 | 8,542 | 13,125 |
Departmental group
| Exit package cost band | Number of compulsory redundancies | Number of other departures agreed | Total number of exit packages by cost band |
|---|---|---|---|
| < £10,000 | 49 | 15 | 64 |
| £10,001-£25,000 | 43 | 57 | 100 |
| £25,001-£50,000 | 47 | 191 | 238 |
| £50,001-£100,000 | 30 | 18 | 48 |
| £100,001-£150,000 | 2 | 1 | 3 |
| £150,001-£200,000 | 0 | 1 | 1 |
| Total number of exit packages | 171 | 283 | 454 |
| Total cost £000 | 4,767 | 9,373 | 14,140 |
Table 2: 2022 to 23
Core Department
| Exit package cost band | Number of compulsory redundancies | Number of other departures agreed | Total number of exit packages by cost band |
|---|---|---|---|
| < £10,000 | 42 | 40 | 82 |
| £10,001-£25,000 | 30 | 123 | 153 |
| £25,001-£50,000 | 35 | 543 | 578 |
| £50,001-£100,000 | 17 | 22 | 39 |
| £100,001-£150,000 | – | – | – |
| £150,001-£200,000 | – | – | – |
| Total number of exit packages | 124 | 728 | 852 |
| Total cost £000 | 2,955 | 23,068 | 26,023 |
Departmental group
| Exit package cost band | Number of compulsory redundancies | Number of other departures agreed | Total number of exit packages by cost band |
|---|---|---|---|
| < £10,000 | 43 | 41 | 84 |
| £10,001-£25,000 | 30 | 126 | 156 |
| £25,001-£50,000 | 38 | 545 | 583 |
| £50,001-£100,000 | 18 | 26 | 44 |
| £100,001-£150,000 | – | – | – |
| £150,001-£200,000 | – | – | – |
| Total number of exit packages | 129 | 738 | 867 |
| Total cost £000 | 3,189 | 23,508 | 26,697 |
DWP has paid redundancy and other departure costs in accordance with the provisions of the Civil Service Compensation Scheme, a statutory scheme made under the Superannuation Act 1972. The table above shows the total cost of exit packages agreed and accounted for in 2023 to 2024 was £14.1 million (£26.7 million in 2022 to 2023). The Department accounts for exit costs in full when the early retirement programme becomes binding but actual dates of departure may fall in the following reporting period. Where the Department has agreed early retirements, it , not the Civil Service Pension Scheme, meet the additional costs. Ill-health retirement costs are met by the pension scheme and are not included in the table.
From 22 December 2010, new civil service compensation terms were introduced for Early Release schemes. All voluntary exit costs payable by DWP are now made in the form of lump-sum payments. Payments made in respect of schemes prior to this date were made as both lump-sum payments and annual compensation payments. The liability in respect of these annual payments is included in other provisions in note 17.
Reporting the tax arrangements of public sector appointees
All government departments and their arm’s length bodies (ALBs) which employ appointees off-payroll have to report to HM Treasury about the financial arrangement to make sure it is transparent and that the appointee in question is paying the right amount of tax and National Insurance. Off-payroll engagements include any appointee who is not on the Department’s payroll.
DWP continuously reviews the way it employs appointees to ensure its processes are robust. The Department has the right to request assurances, and do so, from the appointees. The individual’s contract can be terminated if these assurances are not provided. The tables below outline the off-payroll arrangements for 2023 to 2024.
Off-payroll
Table 1: Highly paid off-payroll worker engagements as at 31 March 2024, that were paid £245 per day or greater
| Engagement | Core Department | ALBs | Departmental group |
|---|---|---|---|
| No. of existing engagements as of 31 March 2024 | 1380 | 89 | 1469 |
| No. that existed < 1 year at time of reporting | 550 | 59 | 609 |
| No. that have existed for between 1 and 2 years at time of reporting | 323 | 28 | 351 |
| No. that have existed for between 2 and 3 years at time of reporting | 246 | 2 | 248 |
| No. that have existed for between 3 and 4 years at time of reporting | 95 | 0 | 95 |
| No. that have existed for 4 or more years at time of reporting | 166 | 0 | 166 |
Table 2: All highly paid off-payroll workers engagements engaged at any point during the year ended 31 March 2024, earning £245 per day or greater
| Engagement | Core Department | ALBs | Departmental group |
|---|---|---|---|
| No. of new engagements between 1 April 2023 and 31 March 2024 | 2100 | 226 | 2326 |
| No. of appointments to which the off-payroll legislation does not apply | 2056 | 104 | 2160 |
| No. assessed as caught by IR35 (In scope) | 39 | 119 | 158 |
| No. assessed as not caught by IR35 (Out of scope) | 5 | 3 | 8 |
| No. of engagements reassessed for consistency/assurance purposes during the year | – | 70 | 70 |
| No. of engagements that saw a change to IR35 status following consistency review | – | – | – |
- Off-Payroll Working Rules (IR35 legislation) requires public sector bodies, where they engage off-payroll workers, to ensure they correctly assess their “employment status” i.e. correct tax treatment
- To do this, DWP utilised HM Revenue and Customs’ CEST (Check Employment Status Tool)
- All engagements of highly paid workers, which are not on the Department’s payroll, are included in the off-payroll tables
- Highly paid engagements includes payments to individuals of at least £245 per day
Table 3: For any off-payroll engagements of board members, and/or, senior officials with significant financial responsibility, between 1 April 2023 and 31 March 2024
| Core Department | Arm’s Length Bodies | Departmental group | |
|---|---|---|---|
| No. of off-payroll engagements of board members, and/or, senior officials with significant financial responsibility, during the financial year. | – | – | – |
| Total no. of individuals on payroll and off-payroll that have been deemed “board members, and/or, senior officials with significant financial responsibility”, during the financial year. This figure should include both on payroll and off-payroll engagements. | – | 14 | 14 |
These are DWP’s most senior officials who hold the highest levels of delegated financial authority.
Consultancy and temporary staff
DWP occasionally uses professional service providers to help with specialist work – including consultancy and contingent labour where it is necessary and prudent to do so.
| Consultancy (£ million) | 2023 to 2024 | 2022 to 2023 |
|---|---|---|
| Core Department | 8.9 | 4.3 |
| Arm’s Length Bodies | 10.5 | 6.2 |
| Departmental group | 19.4 | 10.5 |
| Temporary (off-payroll) staff (£ million) | 2023 to 2024 | 2022 to 23 |
|---|---|---|
| Core Department | 154.9 | 144.1 |
| Arm’s Length Bodies | 19.0 | 19.1 |
| Departmental group | 173.9 | 163.2 |
Increased and more complex programmes in 2023 to 2024 have resulted in a shortage of internal project management, procurement, and legal services specialist skills leading to higher demand for external expertise and independent governance support.
Staff absence and sickness
DWP recognises the costs associated with high levels of employee absence. The Department’s wellbeing approach to sick absence is focused on health promotion and absence prevention, while supporting employees who are absent to return to work.
DWP develops policies, standards, procedures and guidance covering Health and Safety issues to ensure its employees remain safe.
At end March 2024 there were 4,718 open absences in DWP (including all sickness and non-sickness categories). This represents 5.1% of the DWP workforce which is slightly lower than at end March 2023 at 5.5%.
For sickness absence only, at end March 2024 there were 3,195 absences representing 3.5% of the workforce. This has reduced slightly from 3.7% in March 2023.
Staff Engagement
In 2023 to 2024 the People Survey provided an important opportunity for the Department to hear about the things that matter to colleagues. 59,000 colleagues shared their views giving DWP its highest response rate since 2018 at 68% which is encouraging as this gives a stronger understanding of how colleagues are feeling and where DWP needs to act.
With challenges and pressures faced both internally and externally, combined with ensuring DWP provides the absolute best service to colleagues and customers its staff engagement score remains higher than pre-pandemic levels at 61% (pre-pandemic level 59%).
The 2023 People Survey core themes remained relatively stable for my work at 74%, my manager at 77%, my team at 83%, inclusion and fair treatment 80%, leadership and managing change at 50% along with resources and workload at 76%.
For organisational objectives and purpose, DWP achieved 86% which indicates many of its colleagues feel connected to the difference the Department can make to people’s lives. The Department saw a continuing rise in learning and development to 62% and an increase in pay and benefits to 33%.
For 2024 to 2025 DWP will build upon its work so far on Wellbeing, Pay, Line Management, Change Management and Disability. Ways of working, resources and workload are key areas of concern raised by colleagues, and (as with its customers) they continue to face cost of living changes. Bullying, Harassment and Discrimination scores have plateaued these past few years at 10% and 11% respectively and are being prioritised as part of the wider work across the Civil Service. The Department is conducting a deeper analysis into the sources and factors by gathering case studies, identifying, and sharing good practice. With its new Bullying, Harassment and Discrimination action plan, its network of Fair Treatment Advisors, strong visible leadership, the Department is committed to build on its work so far and put interventions in place to tackle inappropriate behaviour.
Amidst the increasing demand that the Department’s services are seeing – particularly with regards to its wellbeing offer – DWP scores for PROXY stress and PERMA indices (which measure factors associated with stressful or flourishing workplace environments) are unchanged from last year at 28% (Civil Service overall 27%) and 74% (Civil Service overall 74%) respectively. These results show that DWP is responding well, noting the Civil Service 2023 scores overall.
DWP continues to offer comprehensive wellbeing support and significant financial resources including its Employee Assistance Programme. 2023 was a year of consolidation, growth and reflection across the Wellbeing and Inclusion space with a refreshed Wellbeing Strategy which built on the lessons learned from across the Department over the pandemic and the excellent progress that it has achieved since its last strategy ‘Working Well Together – 2020 and beyond’ that focusses on 7 key priorities for the next 3 years. The Department launched ‘My Wellbeing button, Wellbeing Hub and Wellbeing Calendar’ and refreshed Mental Health First Aid training to strengthen resources for its colleagues and put into place a programme to support workplace adjustments. The Department will monitor the impact over the coming year.
The survey gives DWP vital insight on what more it needs to do to make sure that everyone who works in DWP feels supported and valued. The Department has looked closely at all of its results to consider where it can make things better. Informed by the survey outcomes as part of its ongoing listening programme the Department will continue to undertake regular pulse and insight activities to check in on colleague experience. The Department will implement a new approach to action planning and ensure that it engages and updates its colleagues on progress.
Staff Turnover
The all-staff 12-month moving average turnover rate for DWP at March 2024 was 7.28%. The turnover rate is now much more stable and at levels similar to those pre-pandemic. It had been historically high over the preceding two years because, during the COVID-19 pandemic, the proportion of DWP employees on fixed term/temporary contracts increased significantly and these members of staff tend to have much higher turnover rates than permanent staff. The proportion of the DWP workforce on fixed term/temporary contracts has now significantly reduced again from a peak of 22% of the workforce in September 2021 to 1% in March 2024.
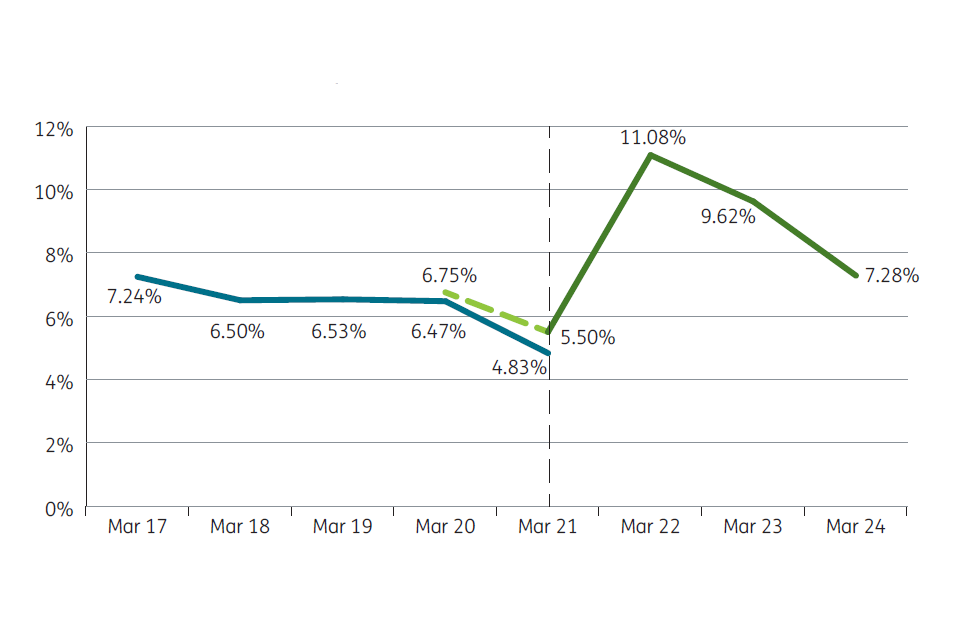
Trade union facility time
| DWP Facility Time | Figures |
|---|---|
| Number of trade union representatives | 987 |
| Number of representatives with trade union facility time 0 % | 0 |
| Number of representatives with trade union facility time (between 1% and 50% of contracted hours) | 987 |
| Number of representatives with trade union facility time (between 51% and 99% of contracted hours) | 0 |
| Number of representatives with trade union facility time (100 %) | 0 |
| Total time spent (hours) | 87,123 |
| Cost of facility time | £0.812 million |
| Total paybill | £3.8 billion |
| Facility time as a percentage of the Department’s annual pay bill | 0.02% |
| HSE Facility Time | Figures |
|---|---|
| Number of trade union representatives | 71 |
| Number of representatives with trade union facility time 0 % | – |
| Number of representatives with trade union facility time (between 1% and 50% of contracted hours) | 71 |
| Number of representatives with trade union facility time (between 51% and 99% of contracted hours) | – |
| Number of representatives with trade union facility time (100 %) | – |
| Cost of facility time | £0.193 million |
| Total paybill | £182 million |
| Facility time as a percentage of the Department’s annual pay bill | 0.11% |
The number of trade union representatives (987) is the total headcount of representatives in DWP from the PCS, FDA and Prospect trade unions. This equates to 912 FTE.
In addition some representatives hold multiple roles, so included in the total figure of 987 are 414 Health and Safety Representatives and 61 Union Learning Representatives (ULR).
Staff seconded and loaned
The Department made a small number of secondments and loans of members of staff to other government departments during 2023 to 2024.
Grade: outward secondments
| Outward Secondments (from DWP to outside the Civil Service) | AO | EO | HEO | SEO | G7 | G6 | SCS1 | SCS2 | NK | Total |
|---|---|---|---|---|---|---|---|---|---|---|
| 1. Number who went on secondment since 1 April 2023 | 0 | 2 | 0 | 1 | 1 | 0 | 2 | 0 | 0 | 6 |
| 2. Number who were already on secondment prior to 1 April 2023 and are expected to be throughout this year (beyond 31 March 2024) | 0 | 4 | 1 | 1 | 3 | 2 | 1 | 2 | 0 | 14 |
| 3. Number who were already on secondment prior to 1 April 23 and have or are expected to end this year (up to 31 March 2024) | 0 | # 1 | 2 | 0 | 5 | 3 | 4 | 0 | 0 | 15 |
| Grand Total (All outward secondments) | 0 | 7 | 3 | 2 | 9 | 5 | 7 | 2 | 0 | 35 |
Grade: inward secondments
| Inward Secondments (from outside the Civil Service to DWP) | AO | EO | HEO | SEO | G7 | G6 | SCS1 | SCS2 | NK | Total |
|---|---|---|---|---|---|---|---|---|---|---|
| 1. Number who are seconded to DWP since 1 April 2023 | 0 | 0 | 0 | 2 | 3 | 0 | 0 | 0 | 1 | 6 |
| 2. Number who were already on secondment to DWP prior to 1 April 2023 and are expected to be throughout this year | 0 | 0 | 0 | 3 | 0 | 0 | 0 | 0 | 0 | 3 |
| 3. Number who were already on secondment to DWP prior to 1 April 2023 and have or are expected to end this year | 0 | 0 | 1 | 3 | 2 | 1 | 0 | 0 | 0 | 7 |
| Grand Total (All inward secondments) | 0 | 0 | 1 | 8 | 5 | 1 | 0 | 0 | 1 | 16 |
Grade: outward loans
| Outward Loans (from DWP to OGD/NDPB) | AO | EO | HEO | SEO | G7 | G6 | SCS1 | SCS2 | NK | Total |
|---|---|---|---|---|---|---|---|---|---|---|
| 1. Number who went on loan since 1 April 2023 | 1 | 0 | 9 | 1 | 4 | 0 | 0 | 0 | 1 | 16 |
| 2. Number who were already on loan prior to 1 April 2023 and are expected to be throughout this year (beyond 31 March 2024) | 2 | 3 | 2 | 0 | 0 | 0 | 0 | 0 | 3 | 10 |
| 3. Number who were already on loan prior to 1 April 2023 and have or are expected to end this year (up to 31 March 2024) | 0 | 3 | 4 | 1 | 0 | 0 | 0 | 1 | 3 | 12 |
| Grand Total (All outward loans) | 3 | 6 | 15 | 2 | 4 | 0 | 0 | 1 | 7 | 38 |
Grade: inward loans
| Inward Loans (from OGD/NDPB to DWP) | AO | EO | HEO | SEO | G7 | G6 | SCS1 | NK | Total |
|---|---|---|---|---|---|---|---|---|---|
| 1. Number on loan to DWP since 1 April 2023 | 0 | 1 | 1 | 0 | 0 | 0 | 0 | 0 | 2 |
| 2. Number who were already on loan to DWP prior to 1 April 2023 and are expected to be throughout this year (beyond 31 March 2024) | 0 | 0 | 0 | 0 | 0 | 2 | 0 | 1 | 3 |
| 3. Number who were already on loan to DWP prior to 1 April 23 and have or are expected to end this year (up to 31 March 2024) | 0 | 1 | 0 | 0 | 0 | 0 | 0 | 2 | 3 |
| Grand Total (All inward loans) | 0 | 2 | 1 | 0 | 0 | 2 | 0 | 3 | 8 |
Diversity and inclusion
DWP is committed to providing services which embrace diversity and which promote equality of opportunity. As an employer DWP is also committed to equality and valuing diversity within its workforce. Its goal is to ensure that these commitments, reinforced by the DWP Values, are embedded in its day to day working practices with all its customers, colleagues and partners. DWP’s diversity and inclusion ambition continues to be to:
- Increase the representation of currently under-represented groups to make DWP more reflective of the citizens and communities it serves
- Build an inclusive environment, where colleagues are able to be their authentic selves at work, feel they have a voice and belong, see their reflection in senior leaders across the organisation, feel supported, empowered, valued, respected and fairly treated
DWP’s priorities support the commitments set out in the Civil Service Diversity and Inclusion Strategy 2022 to 2025, “Promoting Fairness and Performance” which are to:
- Attract talent from all backgrounds
- Invest in people capabilities and
- Drive a performance culture that delivers improved outcomes for citizens
The Department has made significant progress in attracting a more diverse range of talent and laying the foundations of a strong ethos for inclusion. For example, to ensure a greater understanding of its Public Sector Equality Duty and personal responsibilities in relation to both its staff and customers, the Department has developed and rolled-out mandatory e-learning to all its employees. As of 31 March 2024, 93% of employees have completed the learning.
DWP has also seen improvements in many areas of representation where it is beginning to look and feel much more like an organisation that mirrors the communities it serves.
Representation Data
DWP continues to encourage individuals to voluntarily share their personal diversity information and promote the benefits of gathering this through communications and new starter induction. However, not every member of staff is willing to share their details and the tables below only include colleagues who have done so.
Disability representation has increased from 17.6% in March 2020 to 22.8% as of 31 March 2024, above the economically active population in Great Britain representation (of 19.1%). DWP is fully committed to increasing representation of disabled people in HEO-G6 levels ensuring a stable talent pipeline to the SCS.
Ethnic minority representation has risen from 15.6% on 31 March 2020 to 20.1% as of 31 March 2024 (against the economically active population of 16.1%) with increases across all grades, particularly at the C/EO grade which most of the Department’s recruitment activity has been focused this year.
DWP continues to make progress in the percentage of staff who have shared details of their sexual orientation and religious beliefs information (information on marriage and civil partnership is also captured via a central recording system, but no information on gender re-assignment is currently captured).
Representation of female staff, ethnic minority staff and disabled staff
| Year (March) | Total Number of Staff | Female | Ethnic Minority | Disabled |
|---|---|---|---|---|
| Economically Active Population in Great Britain (2023)* | – | 47.7% | 16.1% | 19.1% |
| 2024 | 90,779 | 63.0% | 20.1% | 22.8% |
| 2023 | 84,944 | 64.3% | 17.6% | 21.7% |
| 2022 | 91,452 | 64.6% | 17.6% | 18.5% |
| 2021 | 92,690 | 65.2% | 17.2% | 18.3% |
| 2020 | 75,590 | 65.9% | 15.6% | 17.6% |
| 2019 | 68,742 | 66.3% | 13.0% | 11.0% |
*Source Annual Population Survey September 2023
Although DWP figures are above the Economically Active Population and are steadily growing, there is still much more work to do. As part of this, the Department will launch a new DWP Equity, Diversity and Inclusion approach and development of a new EDI Programme Board and partnership forum linking all its networks and EDI experts.
DWP’s key priorities for 2023 to 2024 were:
Inclusion
- embedding a culture of inclusive and accountable leadership, promoted by senior role models
- pilot and evaluate bespoke DWP team-based learning programme Inclusion Matters with 376 colleagues across 30 teams
- updating/promoting mandatory SCS Wellbeing and Inclusion Performance objective guidance
- conducting 1-2-1 Inclusion Engagement Sessions, collecting insights on lived experiences of a diverse range of colleagues to understand more about feelings of Inclusion and Belonging
- delivering guidance on Inclusive Ways of Working and the organisational benefits of being ‘Inclusive by Design’
- engaging with over 105,000 colleagues across National Inclusion Week, Speak Up Week and Anti-Bullying Week
Ethnicity
DWP has continued to make progress with its overall ethnic minority representation level and since 2020, the Department has seen overall ethnic minority representation increase to 20.1% (nearly 7PP higher than the current internal 13.2% success measure). From June 2020, representation has been consistently above 13.2% for grades AO to EO, with highest representation in the Department at EO grade (23.4%).
DWP has seen good improvement in HEO representation (15.9% +5.9PP since June 2020), and some improvement at SEO level to 14.9% although Grade 7 representation is still below 13.2% (at 12.5%).
Progress at Grade 6 and SCS is slower compared to other grades, consistently remaining below 13.2% with little fluctuation over the last 2 years (currently 7.1% for Grade 6, and 7.6% for SCS).
DWP continues to work to support delivery of the departmental Race Plan 2023-25 through its 3 focus areas; Joining our workforce, Developing in our workforce, and Colleague and Leadership behaviour.
Disability
The Department role models Disability Confidence, it has recently renewed its Disability Confident Leader status – demonstrating with evidence that it has leaders and role models in this space for other organisations.
DWP is committed to increasing trust, encouraging proactive support and empowering disabled colleagues.
Each year DWP refreshes its Disability Action Plan, using insight and lived experience working in partnership with its disability networks:
- the Department’s 2024 Disability Action Plan has four strategic priorities, ensuring colleagues with long-term health conditions are not disproportionately or adversely impacted through design or attitude
- making sure its recruitment is accessible to all, the Department has achieved Visibly Better Employer Quality Standard and works very closely with a company specialising on inclusive recruitment and branding.
- optimising people policies and streamlining processes to ensure the Social Model of Disability is embedded, normalising workplace adjustments throughout
- a Workplace Adjustments Governance Board and Workplace Adjustment project leading on solution-focused priorities to improve support for line managers and individuals
- the Department continues to develop communications campaigns, that enhances awareness of disability issues and challenges
- DWP has updated learning products throughout the Department with Disability Confident language and information
- DWP continues to work with disability working groups to understand how its priorities align to challenges being felt in the workforce
- gathering rich insight and challenge from THRIVE – the DWP disability colleague network for diverse ability, who also collaborate closely with networks for colleagues who are deaf or have hearing loss, blind and visually impaired and neurodivergent.
Faith and Belief
Faith and belief are important aspects of colleagues’ identity. The Department has introduced a DWP Faith and Belief Network bringing together representatives from individual faiths and beliefs, to work collectively to deliver against the following priorities:
- foster an inclusive and safe environment that provides colleagues of faith and belief to have a sense of belonging, allows them to be authentic and ensures they have a voice in their team and organisation
- understand the composition and work experiences of DWP colleagues; and
- ensure that any potential impacts from a Faith and Belief perspective are considered and inform DWP HR policies and decision-making
Gender/Sex
Since March 2021 DWP has seen a rise from 50% of Senior Civil Servants being female to 55.4% in March 2024. The overall percentage of the Department has remained over 60% female.
DWP has progressed a number of actions this year to support its employees which have included:
- introduction of the DWP Man Down sessions which provide a safe space for men to come together and talk about their health and wellbeing.
- implementation of guidance on managing Endometriosis and Polycystic Ovary Syndrome
- continued provision of free sanitary products in all DWP offices
- listening circles on women’s health to better understand employees’ lived experiences and how the Department can better support them
- ongoing promotion and provision of coaching, mentoring, sponsorship and progression opportunities. This has included DWP Gender Champion sponsorship initiatives where a total of 717 women across the Department were sponsored and funded to attend either the Crossing Thresholds Programme or Women into Leadership
- piloted the Cultivating Your Leadership Workshop, a consolidation workshop for participants post Crossing Thresholds and Women into Leadership programmes
Representation by Gender (Sex)
| Staff Diversity – % Women | March 2021 | March 2022 | March 2023 | March 2024 |
|---|---|---|---|---|
| Workforce | 65.5% | 64.6% | 64.3% | 63.0% |
| Senior Civil Servants | 50.0% | 53.2% | 54.0% | 55.4% |
| Ministers | 50.0% | 66.7% | 33.0% | 40.0% |
| Non-executive Members | 33.3% | 30.8% | 40.0% | 50.0% |
| Executive Team | 33.3% | 37.5% | 63.7% | 72.7% |
Age
To support the Fuller Working Lives agenda and to help with career planning, future learning and wellbeing for its colleagues, DWP has developed a mid-life MOT that includes useful hints, tips, support and guidance to help its employees thrive in both DWP and their personal life. The principles and area of focus are the same as promoted externally but the supportive products are bespoke to DWP.
To demonstrate its commitment to exemplary practice in recruitment, retention and support of workers and to ensure all age groups have equitable access to opportunities within the organisation, the Department has signed the Centre for Ageing Better Age-friendly Employer Pledge and is the first government department to have done so.
Representation by Age
| Percentage of DWP Workforce by age range | March 2021 | March 2022 | March 2023 | March 2024 |
|---|---|---|---|---|
| 16 to 24 | 4% | 5% | 3% | 3% |
| 25 to 34 | 14% | 15% | 15% | 17% |
| 35 to 44 | 20% | 20% | 19% | 20% |
| 45 to 54 | 31% | 28% | 28% | 26% |
| 55 to 64 | 28% | 29% | 31% | 30% |
| 65 + | 3% | 3% | 4% | 4% |
Caring
The Department is extremely proud of its Level 3 Carer Confident Ambassador accreditation which is the highest level of recognition by Employer for Carers. This accreditation recognised the excellent work undertaken across the Department to promote its commitment to offering all employees a range of supportive measures to enable them to meet their personal caring responsibilities whilst still achieving a fulfilling career in the Department.
Examples of measures DWP has put in place include:
- ongoing promotion of its Carers’ Charter; Carers’ Passport; Line Manager Toolkit and facilitated learning sessions
- celebration and promotion of Carers’ Rights Day and Carers’ Week
- growth of a departmental supportive peer-to-peer community, and
- active participation in the Cross-Government Carers Network
Carers Data
| Substantive Grade | Caring Responsibilities | % of all Caring responsibility group |
|---|---|---|
| Total | Adult Care Responsibilities | 8.6% |
| Total | Both child and adult care responsibilities | 2.1% |
| Total | Childcare responsibilities | 24.0% |
| Total | No | 58.0% |
| Total | Not recorded | 7.3% |
LGBT+
DWP continues to support its LGBT+ colleagues to ensure that they are included and fairly represented. Through its active LGBT+ staff network the Department has delivered several successful Sexual Orientation and Transgender/Gender Identity activities, events and communications celebrating, raising awareness and the visibility of its LGBT+ employees.
DWP continues to see a steady increase in positive declaration of sexual orientation, rising from 57.9% in June 2020 to 78.4% in March 2024.
Social Mobility
Social Mobility forms a key part of DWP’s Diversity and Levelling Up agenda. This year:
- the Department was extremely proud to be ranked 10th in the Social Mobility 2023 Employer Index in recognition of its work
- the Social Mobility Network has been instrumental in organising and delivering events across the Department and supporting a growing community of allies which currently stands at approximately 1,700
- the Department has continued to promote several initiatives to support development and progression including participation in cross-government mentoring programmes, success profile application support and confidence building, including addressing self-limiting beliefs
- the Department continuously monitored workforce data relating to socio-economic background to highlight areas which require targeted support
Gender pay gap
The gender pay gap (GPG) figures for all large UK employers were published for the first time in December 2017. These publications provide unprecedented transparency of the difference between men’s and women’s average earnings, generate debate and encourage employers to take action to close the pay gap. DWP has mechanisms in place to ensure that men and women are paid equally for the same jobs, but a mean GPG exists which is largely attributed to the structure of the Department’s workforce.
There is a positive story for DWP’s 2023 Gender Pay Gap compared to 2022, this with many of the headline figures improving.
In March 2023:
- DWP’s mean ordinary GPG: 5.5% (decreased by 0.4 percentage points (ppt) since 2022)
- DWP’s median ordinary GPG: 0.0% (unchanged since 2022)
- DWP’s mean bonus GPG: 11.9% (decreased by 2.8 ppt since 2022)
- DWP’s median bonus GPG: 10.1% (decreased by 4.7 ppt since 2022)
DWP continues to perform favourably when compared to the wider Civil Service, where the overall ordinary mean GPG is 8.1%. The Department also compares favourably with the mean bonus GPG for the Civil Service of 23.5%, and the median bonus GPG of 25.4%
Women represent 63% of the DWP workforce and the Department continued to make positive progress in increasing women that are represented at the most senior grades. At SCS1 and SCS3, over 50% of roles continue to be filled by women, and over 72% within the Executive Team. The pay gap for the more senior grades has been reduced compared to March 2022.
Women are under-represented at higher grades, and slightly over-represented at lower grades. Over 80% of all women in the workforce occupy grades AA to EO, compared to 76% of men.
Statement of Outturn against Parliamentary Supply (SOPS)
Introduction
In addition to the primary statements prepared under International Financial Reporting Standards (IFRS), the Government Financial Reporting Manual (FReM) requires the Department to prepare a Statement of Outturn against Parliamentary Supply (SOPS) and supporting notes.
The SOPS and related notes are subject to audit, as detailed in the Certificate and Report of the Comptroller and Auditor General to the House of Commons.
The SOPS is a key accountability statement that shows, in detail, how an entity has spent against their Supply Estimate. Supply is the monetary provision (for resource and capital purposes) and cash (drawn primarily from the Consolidated Fund), that Parliament gives statutory authority for entities to utilise. The Estimate details supply and is voted on by Parliament at the start of the financial year.
Should an entity exceed the limits set by their Supply Estimate, called control limits, their accounts will receive a qualified opinion.
The format of the SOPS mirrors the Supply Estimates, published on GOV.UK, to enable comparability between what Parliament approves and the final outturn.
The SOPS contain a summary table, detailing performance against the control limits that Parliament have voted on, cash spent (budgets are compiled on an accruals basis and so outturn won’t exactly tie to cash spent) and administration.
The supporting notes detail the following:
- outturn by Estimate line, providing a more detailed breakdown (note 1)
- a reconciliation of outturn to net operating expenditure in the SoCNE, to tie the SOPS to the financial statements (note 2)
- a reconciliation of outturn to net cash requirement (note 3); and
- an analysis of income payable to the Consolidated Fund (note 4)
The SOPS and Estimates are compiled against the budgeting framework, which is similar to, but different from, IFRS. Further information on the Public Spending Framework and the reasons why budgeting rules are different to IFRS can also be found in chapter 1 of the Consolidated Budgeting Guidance, available on GOV.UK.
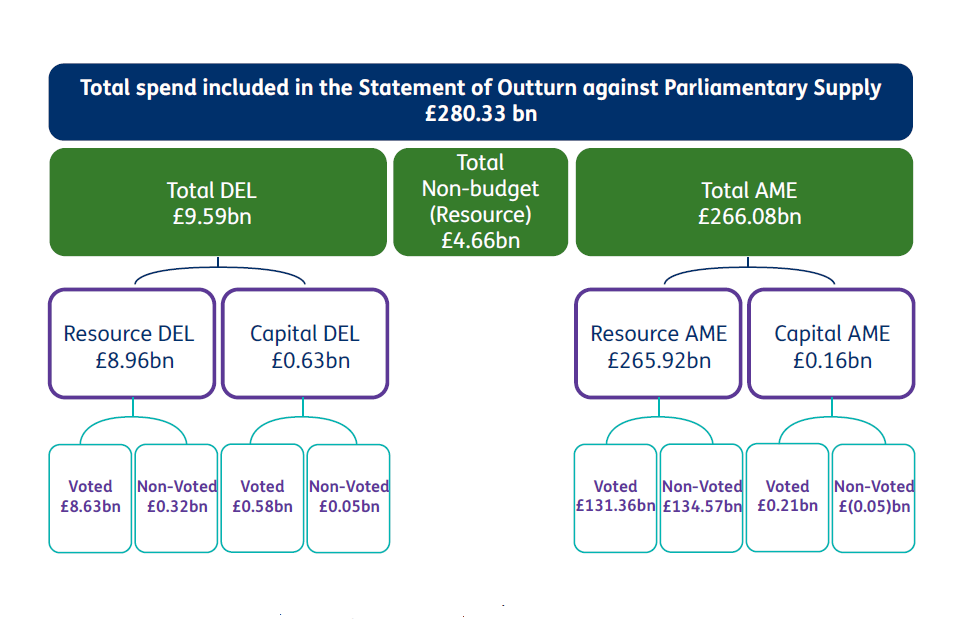
- voted expenditure of £145.44 billion[footnote 61] is funded by Parliament from the Consolidated Fund
- voted expenditure funded from the Consolidated Fund includes £4.66 billion cash for the Social Fund administered by DWP which, for budgeting purposes, is classified as non-budget
- expenditure from the Social Fund is classified as non-voted budget DEL and AME. Therefore, SOPS includes both the cash paid into the Social Fund and the spend incurred by the Social Fund
- other non-voted expenditure of £130.13 billion is funded by the National Insurance Fund
- values may not sum due to roundings
Statement of Outturn against Parliamentary Supply
| Expenditure | Note | Outturn: voted 2023 to 2024 £000 | Outturn: non-voted 2023 to 2024 £000 | Outturn: total 2023 to 2024 £000 | Estimate: voted 2023 to 2024 £000 | Estimate: non-voted 2023 to 2024 £000 | Estimate: total 2023 to 2024 £000 | Outturn vs Estimate Saving/(excess): voted 2023 to 2024 £000 | Outturn vs Estimate Saving/(excess): total 2023 to 2024 £000 | Prior Year Outturn total 2022 to 2023 |
|---|---|---|---|---|---|---|---|---|---|---|
| Departmental Expenditure Limit – Resource | 1 | 8,632,668 | 323,924 | 8,956,592 | 8,838,249 | 324,620 | 9,162,869 | 205,581 | 206,277 | 8,696,155 |
| Departmental Expenditure Limit – Capital | 1 | 581,297 | 51,148 | 632,445 | 640,634 | 50,374 | 691,008 | 59,337 | 58,563 | 449,564 |
| Total DEL | 9,213,965 | 375,072 | 9,589,037 | 9,478,883 | 374,994 | 9,853,877 | 264,918 | 264,840 | 9,145,719 | |
| AME – Resource | 1 | 131,355,691 | 134,567,533 | 265,923,224 | 136,179,500 | 137,150,616 | 273,330,116 | 4,823,809 | 7,406,892 | 230,470,982 |
| AME – Capital | 1 | 205,823 | (48,727) | 157,096 | 381,815 | 20,000 | 401,815 | 175,992 | 244,719 | 69,945 |
| Total AME | – | 131,561,514 | 134,518,806 | 266,080,320 | 136,561,315 | 137,170,616 | 273,731,931 | 4,999,801 | 7,651,611 | 230,540,927 |
| Total Budget – Resource | – | 139,988,359 | 134,891,457 | 274,879,816 | 145,017,749 | 137,475,236 | 282,492,985 | 5,029,390 | 7,613,169 | 239,167,137 |
| Total Budget – Capital | – | 787,120 | 2,421 | 789,541 | 1,022,449 | 70,374 | 1,092,823 | 235,329 | 303,282 | 519,509 |
| Total Budget Expenditure | – | 140,775,479 | 134,893,878 | 275,669,357 | 146,040,198 | 137,545,610 | 283,585,808 | 5,264,719 | 7,916,451 | 239,686,646 |
| Non-Budget – Resource | 1 | 4,661,139 | – | 4,661,139 | 5,146,860 | – | 5,146,860 | 485,721 | 485,721 | 4,869,429 |
| Total Budget and Non-budget | – | 145,436,618 | 134,893,878 | 280,330,496 | 151,187,058 | 137,545,610 | 288,732,668 | 5,750,440 | 8,402,172 | 244,556,075 |
Figures in the columns shaded cover the voted control limits voted by Parliament. Refer to the Supply Estimates guidance manual, available on GOV.UK, for detail on the control limits voted by Parliament.
Net Cash Requirement 2023 to 2024
| SOPS Note | 2023 to 2024 Outturn £000 | 2023 to 2024 Estimate £000 | Outturn vs Estimate: saving / (excess) £000 | 2022 to 2023 Outturn £000 |
|---|---|---|---|---|
| 3 | 145,018,749 | 151,345,267 | 6,326,518 | 126,011,587 |
Administration Costs 2023 to 2024
| SOPS Note | 2023 to 2024 Outturn £000 | 2023 to 2024 Estimate £000 | Outturn vs Estimate: saving / (excess) £000 | 2022 to 2023 Outturn £000 |
|---|---|---|---|---|
| 1 | 979,637 | 1,046,767 | 67,130 | 874,326 |
Although not a separate voted limit, any breach of the administration budget will also result in an excess vote.
Notes to the Statement of Outturn against Parliamentary Supply
SOPS 1. Outturn Detail, by Estimate Line
1.1. Analysis of Resource Outturn by Estimate Line
| Spending in Departmental Expenditure Limit | Outturn: admin: gross 2023 to 2024 £000 | Outturn: admin: income 2023 to 2024 £000 | Outturn: admin: net 2023 to 2024 £000 | Outturn: programme: gross 2023 to 2024 £000 | Outturn: programme: income 2023 to 2024 £000 | Outturn: programme: net 2023 to 2024 £000 | Outturn: programme: total 2023 to 2024 £000 | Estimate: total £000 | Estimate: virements £000 | Estimate: total including virements | Outturn vs Estimate saving/(excess) £000 | Outturn: total 2022 to 2023 £000 |
|---|---|---|---|---|---|---|---|---|---|---|---|---|
| Voted: A Core Department | 945,903 | (38,459) | 907,444 | 6,075,627 | (731,450) | 5,344,177 | 6,251,621 | 6,491,021 | (43,268) | 6,447,753 | 196,132 | 6,043,874 |
| Voted: B Health and Safety Executive (Net) | 55,095 | – | 55,095 | 126,217 | – | 126,217 | 181,312 | 180,572 | 739 | 181,311 | – | 157,011 |
| Voted: C Money and Pensions Service (Net) | – | – | – | 164,850 | – | 164,850 | 164,850 | 156,518 | 8,332 | 164,850 | – | 155,646 |
| Voted: D Other Arm’s Length Bodies (Net) | 17,098 | – | 17,098 | 99,142 | – | 99,142 | 116,240 | 119,686 | – | 119,686 | 3,446 | 107,894 |
| Voted: E Employment Programmes | – | – | – | 753,395 | 37 | 753,432 | 753,432 | 719,423 | 34,009 | 753,432 | – | 814,908 |
| Voted: F Support for local authorities | – | – | – | 205,814 | – | 205,814 | 205,814 | 205,817 | – | 205,817 | 3 | 211,657 |
| Voted: G Funding for Public Corporations | – | – | – | 28,176 | (48,250) | (20,074) | (20,074) | (20,262) | 188 | (20,074) | – | (9,320) |
| Voted: H Other Benefits | – | – | – | 1,030,404 | (50,931) | 979,473 | 979,473 | 985,474 | – | 985,474 | 6,001 | 977,544 |
| Total Voted DEL | 1,018,096 | (38,459) | 979,637 | 8,483,625 | (830,594) | 7,653,031 | 8,632,668 | 8,838,249 | – | 8,838,249 | 205,581 | 8,459,214 |
| Non-voted: I National Insurance Fund – Core Department | – | – | – | 305,682 | (4,979) | 300,703 | 300,703 | 300,703 | – | 300,703 | – | 211,347 |
| Non-voted: J Social fund | – | – | – | 23,221 | – | 23,221 | 23,221 | 23,917 | – | 23,917 | 696 | 25,594 |
| Total Non-Voted DEL | – | – | – | 328,903 | (4,979) | 323,924 | 323,924 | 324,620 | – | 324,620 | 696 | 236,941 |
| Total spending in DEL | 1,018,096 | (38,459) | 979,637 | 8,812,528 | (835,573) | 7,976,955 | 8,956,592 | 9,162,869 | – | 9,162,869 | 206,277 | 8,696,155 |
| Spending in Annually Managed Expenditure | Outturn: admin: gross 2023 to 2024 £000 | Outturn: admin: income 2023 to 2024 £000 | Outturn: admin: net 2023 to 2024 £000 | Outturn: programme: gross 2023 to 2024 £000 | Outturn: programme: income 2023 to 2024 £000 | Outturn: programme: net 2023 to 2024 £000 | Outturn: programme: total 2023 to 2024 £000 | Estimate: total £000 | Estimate: virements £000 | Estimate: total including virements | Outturn vs Estimate saving/(excess) £000 | Outturn: total 2022 to 2023 £000 | |
|---|---|---|---|---|---|---|---|---|---|---|---|---|---|
| Voted: K Severe Disablement Benefit | – | – | – | 56,453 | – | 56,453 | 56,453 | 57,384 | – | 57,384 | 931 | 58,390 | |
| Voted: L Industrial Injuries Benefits Scheme | – | – | – | 735,743 | – | 735,743 | 735,743 | 760,249 | – | 760,249 | 24,506 | 695,401 | |
| Voted: M Universal Credit | – | – | – | 52,038,557 | – | 52,038,557 | 52,038,557 | 54,923,266 | (249,696) | 54,673,570 | 2,635,013 | 41,169,896 | |
| Voted: N Employment and Support Allowance (Non-Contributory) | – | – | – | 7,445,650 | – | 7,445,650 | 7,445,650 | 8,174,048 | – | 8,174,048 | 728,398 | 7,561,029 | |
| Voted: O Income Support | – | – | – | 647,630 | (344) | 647,286 | 647,286 | 656,484 | – | 656,484 | 9,198 | 865,559 | |
| Voted: P Pension Credit | – | – | – | 5,467,138 | – | 5,467,138 | 5,467,138 | 5,643,065 | – | 5,643,065 | 175,927 | 4,935,310 | |
| Voted: Q Financial Assistance Scheme | – | – | – | (270,726) | – | (270,726) | (270,726) | (366,485) | 95,759 | (270,726) | – | (1,663,907) | |
| Voted: R Attendance Allowance | – | – | – | 6,695,944 | – | 6,695,944 | 6,695,944 | 6,881,537 | – | 6,881,537 | 185,593 | 5,668,053 | |
| Voted: S Personal Independence Payment – | – | – | 21,689,145 | – | 21,689,145 | 21,689,145 | 22,036,357 | – | 22,036,357 | 347,212 | 17,636,766 | ||
| Voted: T Disability Living Allowance | – | – | – | 6,862,281 | – | 6,862,281 | 6,862,281 | 6,891,524 | – | 6,891,524 | 29,243 | 5,974,758 | |
| Voted: U Carer’s Allowance | – | – | – | 3,737,836 | – | 3,737,836 | 3,737,836 | 3,857,841 | – | 3,857,841 | 120,005 | 3,249,815 | |
| Voted: V Housing Benefit | – | – | – | 15,161,615 | – | 15,161,615 | 15,161,615 | 15,016,795 | 144,820 | 15,161,615 | – | 14,875,704 | |
| Voted: W Statutory Maternity Pay | – | – | – | 2,881,000 | – | 2,881,000 | 2,881,000 | 3,096,496 | – | 3,096,496 | 215,496 | 2,628,923 | |
| Voted: X Christmas Bonus (Non-Contributory) | – | – | – | 45,524 | 45,524 | 45,524 | 45,024 | 500 | 45,524 | – | 40,747 | ||
| Voted: Y Jobseekers Allowance (Non-Contributory) | – | – | – | 144,721 | (4) | 144,717 | 144,717 | 148,930 | – | 148,930 | 4,213 | 225,147 | |
| Voted: Z State Pension (Non-Contributory) | – | – | – | 223,649 | – | 223,649 | 223,649 | 275,176 | – | 275,176 | 51,527 | 179,185 | |
| Voted: AA Support for Mortgage Interest | – | – | – | 6,329 | (3,831) | 2,498 | 2,498 | (5,537) | 8,035 | 2,498 | – | 1,770 | |
| Voted: AC Other Expenditure | – | – | – | (1,536) | – | (1,536) | (1,536) | 250,531 | – | 250,531 | 252,067 | 28,818 | |
| Voted: AD Other Expenditure EALBs (Net) | – | – | – | 551 | – | 551 | 551 | (31) | 582 | 551 | – | (343) | |
| Voted: AB Cost of Living support payments | – | – | – | 7,792,366 | – | 7,792,366 | 7,792,366 | 7,836,846 | – | 7,836,846 | 44,480 | 5,665,489 | |
| Total Voted AME | – | – | – | 131,359,870 | (4,179) | 131,355,691 | 131,355,691 | 136,179,500 | – | 136,179,500 | 4,823,809 | 109,796,510 | |
| Non-voted: AE Social Fund: Winter Fuel | – | – | – | 4,654,575 | – | 4,654,575 | 4,654,575 | 4,703,032 | – | 4,703,032 | 48,457 | 4,565,822 | |
| Non-voted: AF Incapacity Benefit | – | – | – | (908) | – | (908) | (908) | 633 | – | 633 | 1,541 | 11,759 | |
| Non-voted: AG Social Fund: Other | – | – | – | 79,569 | – | 79,569 | 79,569 | 516,410 | – | 516,410 | 436,841 | 191,742 | |
| Non-voted: AH Employment and Support Allowance (Contributory) | – | – | – | 4,911,445 | – | 4,911,445 | 4,911,445 | 5,129,460 | – | 5,129,460 | 218,015 | 4,527,025 | |
| Non-voted: AI Maternity Allowance | – | – | – | 412,197 | – | 412,197 | 412,197 | 423,483 | – | 423,483 | 11,286 | 389,603 | |
| Non-voted: Bereavement Benefits | – | – | – | 330,259 | – | 330,259 | 330,259 | 391,623 | – | 391,623 | 61,364 | 398,832 | |
| Non-voted: AK Christmas Bonus (Contributory) | – | – | – | 127,978 | – | 127,978 | 127,978 | 130,118 | – | 130,118 | 2,140 | 125,876 | |
| AL Jobseekers Allowance (Contributory) | – | – | – | 168,581 | (5) | 168,576 | 168,576 | 165,325 | – | 165,325 | (3,251) | 108,353 | |
| AM State Pension (Contributory) | – | – | – | 123,883,842 | – | 123,883,842 | 123,883,842 | 125,690,532 | – | 125,690,532 | 1,806,690 | 110,355,460 | |
| Total AME Non-voted | – | – | – | 134,567,538 | (5) | 134,567,533 | 134,567,533 | 137,150,616 | – | 317,150,616 | 2,583,083 | 120,674,472 | |
| Total spending in AME | – | – | – | 265,927,408 | (4,184) | 265,923,224 | 265,923,224 | 273,330,116 | – | 273,330,116 | 7,406,892 | 230,470,982 |
| Non-budget resource | Outturn: admin: gross 2023 to 2024 £000 | Outturn: admin: income 2023 to 2024 £000 | Outturn: admin: net 2023 to 2024 £000 | Outturn: programme: gross 2023 to 2024 £000 | Outturn: programme: income 2023 to 2024 £000 | Outturn: programme: net 2023 to 2024 £000 | Outturn: programme: total 2023 to 2024 £000 | Estimate: total £000 | Estimate: virements £000 | Estimate: total including virements | Outturn vs Estimate saving/(excess) £000 | Outturn: total 2022 to 2023 £000 |
|---|---|---|---|---|---|---|---|---|---|---|---|---|
| Voted: AP Cash paid in to the Social | – | – | – | 4,661,139 | – | 4,661,139 | 4,661,139 | 5,146,860 | – | 5,146,860 | 485,721 | 4,869,429 |
| Total spending in Non-budget | – | – | – | 4,661,139 | – | 4,661,139 | 4,661,139 | 5,146,860 | – | 5,146,860 | 485,721 | 4,869,429 |
| Total Resource | 1,018,096 | (38,459) | 979,637 | 279,401,075 | (839,757) | 278,561,318 | 279,540,955 | 287,639,845 | – | 287,639,845 | 8,098,890 | 244,036,566 |
1.2. Analysis of Capital Outturn by Estimate Line
| Spending in Departmental Expenditure Limit | Outturn: programme: gross 2023 to 2024 £000 | Outturn: programme: income 2023 to 2024 £000 | Outturn: programme: net 2023 to 2024 £000 | Estimate: total £000 | Estimate: virements £000 | Estimate: total including virements | Outturn vs Estimate saving/(excess) £000 | Outturn: total 2022 to 2023 £000 |
|---|---|---|---|---|---|---|---|---|
| Voted: A Core Department | 602,376 | (127,678) | 474,698 | 523,732 | – | 523,732 | 49,034 | 230,689 |
| B Health and Safety Executive (Net) | 25,544 | – | 25,544 | 23,269 | 2,275 | 25,544 | – | 13,729 |
| C Money and Pensions Service (Net) | 5,569 | – | 5,569 | 16,128 | (2,275) | 13,853 | 8,284 | 11,957 |
| D Other Arm’s Length Bodies (Net) | 12,486 | – | 12,486 | 14,505 | – | 14,505 | 2,019 | 8,104 |
| G Funding for Public Corporations | 63,000 | – | 63,000 | 63,000 | – | 63,000 | – | 139,500 |
| Total Voted DEL | 708,975 | (127,678) | 581,297 | 640,634 | – | 640,634 | 59,337 | 403,979 |
| Non-voted: J Social fund | 51,770 | (622) | 51,148 | 50,374 | – | 50,374 | (774) | 45,585 |
| Total Non-Voted DEL | 51,770 | (622) | 51,148 | 50,374 | – | 50,374 | (774) | 45,585 |
| Total spending in DEL | 760,745 | (128,300) | 632,445 | 691,008 | – | 691,008 | 58,563 | 449,564 |
| Spending in Annually Managed Expenditure | Outturn: programme: gross 2023 to 2024 £000 | Outturn: programme: income 2023 to 2024 £000 | Outturn: programme: net 2023 to 2024 £000 | Estimate: total £000 | Estimate: virements £000 | Estimate: total including virements | Outturn vs Estimate saving/(excess) £000 | Outturn: total 2022 to 2023 £000 |
|---|---|---|---|---|---|---|---|---|
| M Universal Credit | 281,611 | (152,399) | 129,212 | 248,262 | – | 248,262 | 119,050 | 109,885 |
| AA Support for Mortgage Interest | 37,301 | (6,977) | 30,324 | 65,112 | – | 65,112 | 34,788 | 16,169 |
| AC Other Expenditure | 46,077 | 210 | 46,287 | 68,441 | – | 68,441 | 22,154 | 7,253 |
| Total Voted AME | 364,989 | (159,166) | 205,823 | 381,815 | – | 381,815 | 175,992 | 133,307 |
| Non-voted: AG Social Fund: Other | (48,720) | (7) | (48,727) | 20,000 | – | 20,000 | 68,727 | (63,362) |
| AH Employment and Support Allowance (Contributory) | – | – | – | – | – | – | – | – |
| Total AME Non-voted | (48,720) | (7) | (48,727) | 20,000 | – | 20,000 | 68,727 | (63,362) |
| Total spending in AME | 316,269 | (159,173) | 157,096 | 401,815 | – | 401,815 | 244,719 | 69,945 |
| Non-budget resource | Outturn: programme: gross 2023 to 2024 £000 | Outturn: programme: income 2023 to 2024 £000 | Outturn: programme: net 2023 to 2024 £000 | Estimate: total £000 | Estimate: virements £000 | Estimate: total including virements | Outturn vs Estimate saving/(excess) £000 | Outturn: total 2022 to 2023 £000 |
|---|---|---|---|---|---|---|---|---|
| Voted: AP Cash paid in to the Social | – | – | – | – | – | – | – | – |
| Total spending in Non-budget | – | – | – | – | – | – | – | – |
| Total Capital | 1,077,014 | (287,473) | 789,541 | 1,092,823 | – | 1,092,823 | 303,282 | 519,509 |
The total Estimate columns include virements. Virements are the reallocation of provision in the Estimates that do not require parliamentary authority (because Parliament does not vote to that level of detail and delegates to HM Treasury). Further information on virements is provided in the Supply Estimates Manual, available on GOV.UK
The outturn vs Estimate column is based on the total including virements. The Estimate total before virements have been made is included so that users can tie the Estimate back to the Estimates laid before Parliament.
SOPS 2. Reconciliation of outturn to net operating expenditure
| Total resource outturn in Statement of outturn Against Parliamentary Supply | Note | 2023 to 2024 outturn £000 | 2022 to 2023 outturn £000 |
|---|---|---|---|
| Budget | 1.1 | 274,879,816 | 239,167,137 |
| Non-budget | 1.1 | 4,661,139 | 4,869,429 |
| Total resource outturn | – | 279,540,955 | 244,036,566 |
| Add: Capital Grants | – | (140,581) | (131,692) |
| Capital Research and Development | – | 11,698 | 12,575 |
| Service Concession Adjustments | – | (1,498) | (1,287) |
| Sub-total | – | (130,381) | (120,404) |
| Less: Income payable to the Consolidated Fund | 4 | (22,389) | (18,013) |
| Less: Cash paid to the Social Fund – Voted Non-budget | – | (4,661,139) | (4,869,429) |
| Sub-total | – | (4,683,528) | (4,887,442) |
| Net operating costs in Consolidated Statement of Comprehensive Net Expenditure | – | 274,727,046 | 239,028,720 |
As noted in the introduction to the SOPS, the outturn and the Estimate are compiled against the budgeting framework, which is similar to, but different from, IFRS. Therefore, this reconciliation bridges the resource outturn to net operating expenditure, linking the SOPS to the financial statements.
Reconciling items
Provided below is an explanation of the reconciling items between resource outturn and net operating costs.
Capital grants (whether received or issued) and capital research and development are budgeted for as capital, but accounted for as resource spend in the SoCNE.
Service Concession Arrangements are treated as on-SoFP for Accounts, but treated as off-SoFP for Estimates and Budgets. Spend is therefore recognised differently in net resource outturn and the SoCNE, and a reconciling adjustment is required.
Income payable to the Consolidated Fund is excluded from the SOPS because Parliament did not authorise the Department to retain the income and the income will be returned to the Consolidated Fund. However, in line with IFRS, income earned by the Department is recognised in the SoCNE.
Cash paid to the Social Fund from the Consolidated Fund is included in SOPS as non-budget but is excluded from the SoCNE. The SoCNE only includes the expenditure incurred by the Social Fund (also included in SOPS as spend within Budget).
SOPS 3. Reconciliation of Net Resource Outturn to Net Cash Requirement
| Note | 2023 to 2024 outturn £000 | 2023 to 2024 estimate £000 | Outturn v estimate: saving/(excess) £000 | |
|---|---|---|---|---|
| Total Resource outturn | SoPS 1.1 | 279,540,955 | 287,639,845 | 8,098,890 |
| Total Capital outturn | SoPS 1.2 | 789,541 | 1,092,823 | 303,282 |
| Adjustments for ALBs: Remove voted resource and capital | – | (506,552) | (510,647) | (4,095) |
| Adjustments for ALBs: Add cash grant in aid | – | 507,344 | 467,379 | (39,965) |
| Adjustments to remove non-cash items: Non-cash items | – | (571,779) | (776,771) | (204,992) |
| Adjustments to reflect movements in working balances: Changes in working capital other than cash | – | (294,288) | 1,000,000 | 1,294,288 |
| Adjustments to reflect movements in working balances: Use of provisions | – | 447,406 | (21,752) | (469,158) |
| Adjustments to reflect movements in working balances: Non-Voted Budget | – | (134,893,878) | (137,545,610) | (2,651,732) |
| Net Cash Requirement | – | 145,018,749 | 151,345,267 | 6,326,518 |
As noted in the introduction to the SOPS, outturn and the Estimate are compiled against the budgeting framework, not on a cash basis. Therefore, this reconciliation bridges the resource and capital outturn to the net cash requirement.
SOPS 4. Analysis of income payable to the Consolidated Fund
In addition to income retained by the Department, the following income is payable to the Consolidated Fund (cash receipts being shown in italics).
| Income | Outturn 2023 to 2024 income £000 | Outturn 2023 to 2024 receipts £000 | Outturn 2022 to 2023 income £000 | Outturn 2022 to 2023 receipts £000 |
|---|---|---|---|---|
| Income outside of the ambit of the Estimate | 22,389 | 22,906 | 18,013 | 18,730 |
| Excess cash surrenderable to the Consolidated Fund | 351,487 | 351,487 | 1,659 | 1,659 |
| Total amount payable to the Consolidated Fund | 373,876 | 374,393 | 19,672 | 20,389 |
Income payable to the Consolidated Fund is excluded from DWP’s Estimate because Parliament did not authorise the Department to retain the income, it will be returned to the Consolidated Fund. However, in line with IFRS, income earned by the Department is recognised in the SoCNE.
Included in the above Consolidated Fund income for 2023 to 2024 of £373.8 million are costs recovered from the automatic enrolment fines collected by The Pensions Regulator (£11.3 million), income received in respect debt recoveries (£1.4 million) and collection of civil penalties (£3.3 million).
Excess cash surrenderable to the Consolidated Fund includes £350.0 million surplus cash from the Social Fund which has been returned to HM Treasury. This has arisen due to recoveries exceeding new loans paid out, as customers migrate to Universal Credit.
Consolidated Fund income shown above does not include any amounts DWP collects from the Financial Assistance Scheme (FAS) while acting as agent of the Consolidated Fund rather than as principal. Details of income collected as agent for the Consolidated Fund were in previous years disclosed in a FAS Trust Statement, but as the revenue is no longer material to DWP the need to produce a Trust Statement no longer exists.
FAS does, however still hold annuity policies, transferred from FAS qualifying pension schemes, and continues to collect the income arising from those assets and pay the resulting cash over to the Consolidated Fund. In the year to 31 March 2024, FAS collected income totalling £8.3 million, consisting of annuity and other income of £8.2 million and scheme transfer income of £0.1 million (2022 to 2023: £8.7 million, consisting of annuity and other income, scheme transfer income was £ nil). £8.4 million was paid over to the Consolidated Fund during the year (2022 to 2023: £8.6 million). At 31 March 2024, FAS illiquid assets were valued at £90.4 million (2022 to 2023: £103.1 million) and FAS held cash awaiting transfer to the Consolidated Fund of £0.4 million (2022 to 2023: £0.4 million).
Variances
The disclosed variances are those which meet the following criteria:
- Variance of at least £10 million and 10%
- Variances material by nature
The variances are stated in the order they appear in the Statement of Outturn against Parliamentary Supply and are calculated by comparing the total net figure from the Supplementary Estimate 2023 to 2024 with the final net outturn figure for 2023 to 2024. These variances are calculated prior to virements.
SOPS 1.1 and 1.2
Voted Expenditure – DEL
C – Money and Pensions Service (Net) – Capital
Outturn is £10.6 million lower than the Supplementary Estimate provided for the Pensions Dashboard programme following a reclassification of capital spend to resource expenditure.
AME
The Office for Budget Responsibility forecasts of benefit expenditure, on which DWP’s Estimate are based, are central estimates. Each year DWP applies a margin to reflect the inherent uncertainty that these forecasts are equally likely to go up or down.
Voted Expenditure – AME
M – Universal Credit (UC) - Capital
Outturn is £119.0 million lower than the Supplementary Estimate for UC Advances, largely because the Department did not use the margin and demand for Advances was lower than forecast, leading to a lower volume of claims than expected.
Q – Financial Assistance Scheme (FAS) – Resource
Outturn shows a variance of £95.8 million compared to Supplementary Estimate. There was a lower than forecast decrease in the FAS provision. This is due to an increase in the costs in the Financial Assistance Scheme between Supplementary Estimate and outturn caused by a higher than anticipated rate of inflation along with an uplift in payment values resulting from the Hampshire legal judgement (ruling that members should receive at least 50% of the value of their accrued pension).
Z – State Pension (non-contributory) - Resource
Outturn is £51.5 million lower than the Supplementary Estimate. This is primarily due to payments under DWP’sreciprocal agreement with the Isle of Man which were forecast in non-contributory State Pension, however outturn is contributory State Pension.
AC – Other Expenditure – Resource and Capital
Resource outturn is £252.1 million lower than the Supplementary Estimate because provision funding levels requested were not required at outturn.
Capital outturn is £22.2 million lower than forecast due to a decrease in the Department’s estates dilapidation provision. This was caused by an updated estimation of liability and a margin which was not required. The value of the provision also reduced to remove sites included in the Supplementary Estimate, where settlements had been agreed during the financial year.
AA – Support for Mortgage Interest – Capital
Outturn is £34.8 million lower than the Supplementary Estimate. Fewer claimants than expected applied for SMI following the Department’s extension of the SMI eligibility criteria in April 2023. The average value of SMI loans was also lower than forecast.
Non-voted Expenditure – AME
AG – Social Fund: Other – Resource and Capital
Resource outturn is £436.8 million lower than Supplementary Estimate due to large margins included for the unpredictable nature of Cold Weather Payments.
Capital outturn is £68.7 million lower than Supplementary Estimate because recoveries for budgeting and crisis loans exceeded expectations. DWP aims to fund new loans from recoveries, however both new loan demand and recoveries have been volatile in recent years, therefore a margin was applied to the net position to ensure the Department can continue to support vulnerable citizens in times of financial hardship.
AJ – Bereavement Benefit – Resource
Outturn is £61.4 million lower than the Supplementary Estimate due to lower than expected take up.
SOPS 3
Total net cash requirement was £6.3 billion lower than Supplementary Estimate. Underspend against resource and capital budgets contribute to this where they have a cash impact, significant variances are explained above.
Other movements are due to variations in provisions, working capital and non-voted budget items.
Core Tables
(This information is not subject to audit)
Table 1: Public spending for the Department for Work and Pensions
| Resource DEL[2] | 2019 to 2020 Outturn £million | 2020 to 2021 Outturn £million | 2021 to 2022 Outturn £million | 2022 to 2023 Outturn £million | 2023 to 2024 Outturn £million | 2024 to 25 Plans £miilion |
|---|---|---|---|---|---|---|
| Section A: Core Department | 4,495 | 4,667 | 5,990 | 6,044 | 6,252 | 6,108 |
| Section B: Health and Safety Executive (Net) | 128 | 165 | 162 | 157 | 181 | 150 |
| Section C: Money and Pensions Service (Net) | 107 | 139 | 150 | 156 | 165 | 177 |
| Section D: Other Arm’s Length Bodies (Net) | 101 | 106 | 105 | 108 | 116 | 115 |
| Section E: Employment Programmes | 246 | 293 | 790 | 815 | 753 | 1,149 |
| Section F: Support for local authorities | 217 | 237 | 214 | 212 | 206 | 212 |
| Section G: Funding for Public Corporations | (9) | (13) | (1) | (9) | (20) | 7 |
| Section H: Other Benefits | 136 | 344 | 813 | 978 | 979 | 128 |
| Section I: National Insurance Fund - Core Department | 432 | 687 | 714 | 211 | 301 | 431 |
| Section J: Social Fund | 30 | 36 | 34 | 26 | 23 | 23 |
| Total Resource DEL | 5,883 | 6,661 | 8,972 | 8,696 | 8,957 | 8,502 |
| Staff costs | 3,044 | 3,499 | 3,865 | 3,756 | 4,096 | 4,029 |
| Purchase of goods and services | 1,952 | 2,237 | 2,504 | 2,324 | 2,528 | 3,756 |
| Income from sales of goods and services | (274) | (294) | (229) | (222) | (192) | (222) |
| Current grants to local government (net) | 431 | 640 | 1,106 | 1,236 | 1,224 | 339 |
| Current grants to persons and non-profit bodies (net) | 574 | 464 | 1,672 | 1,520 | 1,279 | 220 |
| Current grants abroad (net) | (280) | (186) | (283) | (556) | (541) | (1) |
| Subsidies to public corporations | 49 | 48 | 48 | 39 | 35 | 31 |
| Rentals | 169 | 54 | 18 | 34 | 42 | (5) |
| Depreciation[3] | 188 | 185 | 264 | 565 | 558 | 485 |
| Take up of provisions | 3 | 8 | 8 | – | – | – |
| Change in pension scheme liabilities | 32 | 27 | – | – | – | – |
| Other resource | (5) | (23) | (1) | 1 | (73) | (131) |
| Resource AME[4] | 2019 to 2020 Outturn £million | 2020 to 2021 Outturn £million | 2021 to 2022 Outturn £million | 2022 to 2023 Outturn £million | 2023 to 2024 Outturn £million | 2024 to 25 Plans £miilion | |
|---|---|---|---|---|---|---|---|
| Section K Severe Disablement Benefit | 89 | 72 | 62 | 58 | 56 | 53 | |
| Section L: Industrial Injuries Benefits Scheme | 831 | 723 | 705 | 695 | 736 | 770 | |
| Section M: Universal Credit | 18,377 | 38,082 | 40,592 | 41,170 | 52,039 | 68,359 | |
| Section N: Employment and Support Allowance (Non-contributory) | 9,339 | 8,817 | 8,182 | 7,561 | 7,446 | 7,794 | |
| Section O: Income Support | 1,376 | 1,074 | 768 | 866 | 647 | 201 | |
| Section P: Pension Credit | 5,061 | 5,071 | 4,834 | 4,935 | 5,467 | 5,864 | |
| Section Q: Financial Assistance Scheme | (15) | 281 | 945 | (1,664) | (271) | 150 | |
| Section R: Attendance Allowance | 5,908 | 5,345 | 5,307 | 5,668 | 6,696 | 7,684 | |
| Section S: Personal Independence Payment | 12,513 | 13,692 | 15,209 | 17,637 | 21,689 | 25,471 | |
| Section T: Disability Living Allowance | 7,233 | 5,808 | 5,696 | 5,975 | 6,862 | 7,318 | |
| Section U: Carer’s Allowance | 2,941 | 3,039 | 3,075 | 3,250 | 3,738 | 4,228 | |
| Section V: Housing Benefit | 17,813 | 17,027 | 15,545 | 14,876 | 15,162 | 13,828 | |
| Section W: Statutory Maternity Pay | 2,169 | 2,594 | 2,569 | 2,629 | 2,881 | 3,180 | |
| Section X: Christmas Bonus (Non-contributory) | 35 | 36 | 37 | 41 | 46 | 47 | |
| Section Y: Jobseeker’s Allowance (Non-contributory) | 603 | 435 | 300 | 225 | 145 | 96 | |
| Section Z: State Pension (Non-contributory) | 122 | 135 | 160 | 179 | 224 | 216 | |
| Section AA: Support for Mortgage Interest | 6 | 6 | 3 | 2 | 2 | (7) | |
| Section AB: Cost of Living Support Payments | – | – | – | 5,665 | 7,792 | 2 | |
| Section AC: Other Expenditure | 238 | (49) | 6 | 29 | (2) | (7) | |
| Section AD: Other Expenditure EALBs (Net) | (1) | (1) | – | – | 1 | – | |
| Section AE: Social Fund: Winter Fuel | 1,974 | 1,957 | 1,974 | 4,566 | 4,655 | 1,889 | |
| Section AF: Incapacity Benefit | 5 | 5 | (9) | 12 | (1) | – | |
| Section AG: Social Fund: Other | 59 | 145 | 10 | 192 | 80 | 83 | |
| Section AH: Employment and Support Allowance (Contributory) | 4,512 | 4,567 | 4,507 | 4,527 | 4,911 | 5,274 | |
| Section AI: Maternity Allowance | 419 | 384 | 362 | 390 | 412 | 439 | |
| Section AJ: Bereavement Benefits | 506 | 498 | 341 | 399 | 330 | 367 | |
| Section AK: Christmas Bonus (Contributory) | (131) | 123 | 124 | 126 | 128 | 128 | |
| Section AL: Jobseeker’s Allowance (Contributory) | 111 | 611 | 190 | 108 | 169 | 134 | |
| Section AM: State Pension (Contributory) | 98,689 | 101,901 | 104,533 | 110,355 | 123,884 | 138,006 | |
| Consolidated Fund Extra Receipts | – | – | – | – | – | – | |
| Total Resource AME | 190,782 | 212,378 | 216,030 | 230,471 | 265,923 | 291,566 | |
| Purchase of goods and services | 1 | – | – | – | – | – | |
| Current grants to local government (net) | 17,813 | 17,027 | 15,545 | 14,876 | 15,162 | 13,828 | |
| Current grants to persons and non-profit bodies (net) | 173,021 | 194,051 | 198,889 | 217,830 | 251,524 | 277,751 | |
| Depreciation[3] | (24) | (107) | 224 | (1,476) | 137 | 41 | |
| Take up of provisions | 48 | 1,555 | 1504 | (399) | (512) | 144 | |
| Release of provision | (610) | (394) | (498) | (750) | (774) | (237) | |
| Change in pension scheme liabilities | (31) | (26) | 2 | 2 | 2 | – | |
| Other resource | 565 | 271 | 364 | 389 | 385 | 39 | |
| Total Resource Budget | 196,665 | 219,039 | 225,002 | 239,167 | 274,880 | 300,067 | |
| Depreciation[3] | 164 | 78 | 488 | (911) | 695 | 526 |
| Capital DEL[5] | 2019 to 2020 Outturn £million | 2020 to 2021 Outturn £million | 2021 to 2022 Outturn £million | 2022 to 2023 Outturn £million | 2023 to 2024 Outturn £million | 2024 to 25 Plans £miilion |
|---|---|---|---|---|---|---|
| Section A: Core Department | (35) | 279 | 442 | 231 | 475 | 500 |
| Section B: Health and Safety Executive (Net) | 8 | 11 | 17 | 14 | 26 | 15 |
| Section C: Money and Pensions Service (Net) | 2 | 1 | – | 12 | 6 | 6 |
| Section D: Other Arm’s Length Bodies (Net) | – | 8 | 6 | 8 | 12 | – |
| Section G: Funding for Public Corporations | 72 | 108 | 113 | 140 | 63 | 1 |
| Section J: Social Fund | 34 | 62 | 49 | 46 | 51 | 57 |
| Total Capital DEL | 81 | 468 | 626 | 450 | 632 | 579 |
| Staff costs | 1 | 2 | 3 | 3 | 6 | – |
| Purchase of goods and services | – | 3 | 14 | 8 | 6 | 16 |
| Capital grants to private sector companies (net) | (1) | – | – | 3 | 9 | – |
| Capital support for public corporations | 72 | 108 | 110 | 138 | 61 | 1 |
| Purchase of assets | 111 | 319 | 457 | 286 | 621 | 420 |
| Income from sales of assets | (137) | (25) | (2) | (34) | (125) | – |
| Net lending to the private sector and abroad | 34 | 62 | 49 | 46 | 51 | 143 |
| Other capital | – | – | (4) | – | 3 | – |
| Capital AME | 2019 to 2020 Outturn £million | 2020 to 2021 Outturn £million | 2021 to 2022 Outturn £million | 2022 to 2023 Outturn £million | 2023 to 2024 Outturn £million | 2024 to 25 Plans £miilion |
|---|---|---|---|---|---|---|
| Section M: Universal Credit | 356 | 168 | 70 | 110 | 129 | 436 |
| Section AA: Support for Mortgage Interest | 35 | 29 | 18 | 16 | 30 | 84 |
| Section AC: Other Expenditure | – | – | – | 7 | 46 | 56 |
| Section AG: Social Fund: Other | (81) | (51) | (58) | (63) | (49) | (8) |
| Total Capital AME | 309 | 146 | 30 | 70 | 157 | 567 |
| Net lending to the private sector and abroad | 831 | 443 | 475 | 197 | 263 | 959 |
| Other Capital | (522) | (298) | (445) | (134) | (156) | (447) |
| Take up of provisions | – | – | – | 7 | 50 | 56 |
| Total Capital Budget | 390 | 614 | 656 | 520 | 790 | 1,147 |
| Total departmental spending | 196,891 | 219,574 | 225,170 | 240,598 | 274,975 | 300,688 |
| Total DEL | 5,776 | 6,944 | 9,334 | 8,581 | 9,031 | 8,596 |
| Total AME | 191,116 | 212,630 | 215,836 | 232,017 | 265,943 | 292,092 |
1. These tables are not reported on the same basis as the financial statements disclosures, with differing categories and headings.
2. DEL resource and capital is set for each year in the spending review process (amended to incorporate transfers of functions to and from other government departments as they have arisen).
3. Depreciation includes impairments.
4. AME limits are set as part of the Autumn Statement and Spring Budget process.
5. Expenditure on tangible and intangible fixed assets is net of sales.
6. Total departmental spending is the sum of the resource budget and the capital budget less depreciation. Similarly total departmental expenditure limit (DEL) is the sum of the resource budget DEL and capital budget DEL less depreciation in DEL.
7. Table 1 is aligned to the HM Treasury System (Online System for Central Accounting and Reporting (OSCAR)) which is used by all central government departments to record their spending and plans. At 31 May 2024, OSCAR reflects the planned Main Estimate 2024 position, with plan year 2024 to 2025 reflecting Spending Review 2021 and updates from the subsequent fiscal events. In the event of structural changes or Machinery of Government transfers this may not match the outturn in previous years’ financial statements and some spending may also appear on different lines.
8. Expenditure is stated net of income from sales of goods and services.
9. Totals may not sum due to rounding.
10. The impacts of the adoption of IFRS 16 are shown from 2022 to 2023 onwards, and cause higher DEL capital and depreciation figures than in other years.
Table 2: Administration budget for the Department for Work and Pensions
DWP: Administration budget , 2019 to 2020 to 2024 to 2025
| Resource DEL | 2019 to 2020 Outturn £million | 2020 to 2021 Outturn £million | 2021 to 2022 Outturn £million | 2022 to 2023 Outturn £million | 2023 to 2024 Outturn £million | 2024 to 25 Plans £miilion |
|---|---|---|---|---|---|---|
| Core Department | 731 | 832 | 841 | 800 | 907 | 863 |
| Health and Safety Executive (Net) | 50 | 61 | 60 | 57 | 55 | 56 |
| Other Arm’s Length Bodies (Net) | 16 | 17 | 19 | 17 | 17 | 18 |
| Total administration budget | 797 | 911 | 920 | 874 | 980 | 936 |
| Staff costs | 460 | 524 | 519 | 554 | 589 | 428 |
| Purchase of goods and services | 360 | 436 | 392 | 297 | 389 | 478 |
| Income from sales of goods and services | (112) | (114) | (38) | (41) | (47) | (32) |
| Rentals | 48 | 15 | (7) | 9 | 10 | (1) |
| Depreciation | 30 | 34 | 41 | 43 | 33 | 62 |
| Other resource | 11 | 15 | 13 | 13 | 6 | 1 |
| Current grants to persons and non-profit bodies (net) | – | – | – | – | 1 | – |
1. These tables are not reported on the same basis as the financial statements disclosures, with differing categories and headings.
2. This table represents DEL administration expenditure (amended to incorporate transfers of functions to and from other government departments as they have arisen).
3. Depreciation includes impairments.
4. Table 2 is aligned to the HM Treasury System (Online System for Central Accounting and Reporting (OSCAR)) which is used by all central government departments to record their spending and plans. At 31 May 2024, OSCAR reflects the planned Main Estimate 2024 position, with plan year 2024 to 2025 reflecting Spending Review 2021 and updates from the subsequent fiscal events. In the event of structural changes or Machinery of Government transfers this may not match the outturn in previous years’ financial statements and some spending may also appear on different lines.
5. Totals may not sum due to rounding.
6. The impacts of the adoption of IFRS 16 are shown from 2022 to 2023 onwards, and cause higher depreciation than in other years.
Regularity of expenditure
(This information is subject to audit)
DWP is a custodian of taxpayers’ funds and has a duty to Parliament to ensure the regularity and propriety of its activities and expenditure. DWP manages public funds in line with HM Treasury’s Managing Public Money[footnote 62].
The importance of operating with regularity and the need for efficiency, economy, effectiveness and prudence in the administration of public resources to secure value for public money, is the responsibility of the Accounting Officer whose responsibilities are also set out in Managing Public Money. They include responsibility for the propriety and regularity of the public finances for which the Accounting Officer is answerable.
To discharge this responsibility and ensure DWP’s control totals are not breached the following activities are in place:
- formal delegation of budgets
- detailed monitoring of expenditure
- monthly management reporting against control totals
In addition, DWP operates the three lines of defence model, which also forms part of its risk management framework.
In 2023 to 2024, DWP did not breach any of its control totals, details are provided in the Statement of Outturn against Parliamentary Supply.
DWP is in the process of recovering the overpayment of an incorrectly awarded severance award paid to a former Minister in 2022 to 2023. Details are provided in the Remuneration and Staff Report.
DWP accounts have been qualified this year, as has been the case since 1988 to 1989, due to a material level of irregular benefit expenditure, arising from fraud and error.
Parliamentary accountability disclosures
Losses and Special Payments[footnote 63]
(This information is subject to audit)
| Losses and special payments | 2023 to 2024 Core department £000 | 2023 to 2024 Departmental group £000 | 2023 to 2024 Core department cases | 2023 to 2024 Departmental group cases | 2022 to 2023 Core department £000 | 2022 to 2023 Departmental group £000 | 2022 to 2023 Core department cases | 2022 to 2023 Departmental group cases |
|---|---|---|---|---|---|---|---|---|
| Losses | 417,997 | 419,092 | 1,023,564 | 1,024,535 | 393,816 | 395,937 | 1,075,126 | 1,076,395 |
| Special Payments | 31,334 | 31,335 | 65,669 | 65,671 | 112,224 | 112,299 | 355,705 | 355,708 |
Overpayments due to fraud and error are not considered losses until recovery options have been exhausted, for more information please see note 1.12.
i. Losses arising from benefit overpayments, grants and subsidies
| Loss | 2023 to 2024 £000 |
|---|---|
| Non-recoverable Benefit Overpayments – During the year DWP writes off non-recoverable overpayments of benefits and Tax Credits. These are where the Department cannot legally enforce repayment and it is not in the public interest to do so | 328,953 |
| Customer Fraud – DWP writes off overpayments resulting from customer fraud once it has exhausted its debt recovery processes | 5,769 |
| Duplicate Christmas Bonus – DWP sometimes pays duplicate Christmas Bonuses because more than one benefit system can generate the payment. This is classed as official error, and the Department has no legal right to recovery | 318 |
| Social Fund – DWP makes low-cost funeral expense payments to people who receive (or whose partners receive) a qualifying benefit or Tax Credits. These are recoverable from the estate of the deceased but DWP writes them off when there are not enough assets in the estate. This year the Department wrote off 26,437 funeral expense payments with a total value of £50.8 million. Budgeting and crisis loans which cannot be recovered are written off subject to strict criteria. This year the Department wrote off 20,005 of these loans with a total value of £2.5 million. The Department also wrote off 10,983 irrecoverable overpayments amounting to £3.1 million, of which £2.9 million relate to Winter Fuel Payments. This year the Department also wrote off non-recoverable Cold Weather Payment overpayments amounting to £0.2 million | 56,593 |
ii. Cash Losses
| loss | 2023 to 2024 £000 |
|---|---|
| Bad debts – Staff Costs – Bad debts written off in respect of staff costs where value is less than DWP threshold (£500) or age of debt is greater than 6 months | 607 |
| Flexible Support Fund Losses – Under the Flexible Support Fund, DWP gives funds to some claimants to buy items to help them to start work. If, after a number of reminders, claimants don’t provide receipts, or provide incomplete or incorrect receipts, the Department treats the funding as a loss. This figure is an estimate based on returns provided by individual jobcentres – | 1,528 |
iii. Realised Exchange Rate Fluctuation
| Loss | 2023 to 2024 £000 |
|---|---|
| European Social Fund (ESF) Exchange Rate Loss – DWP carries a risk (and opportunity) on ESF transactions due to exchange rate fluctuations between payment application submission to the European Commission and payment to DWP, and between receiving pre-financing and repaying it to the European Commission. In 2023 to 2024, a net loss on foreign exchange of £2.818 million materialised, consisting of £3.924 million in losses partially offset by £1.106 million in gains | 2,818 |
iv. Special Payments
| Payment | 2023 to 2024 £000 |
|---|---|
| Personal Injury Legal costs staff/contractors – These are legal costs arising from personal injury payments suffered by Civil Servants or Contractors | 702 |
| Consolatory Payments – These are Ex Gratia Consolatory payments to claimants in receipt of non-contributory benefits that are not funded by the National Insurance Fund in order to restore confidence and relieve anxiety as a result of departmental failure or delay | 887 |
| FAS extra contractual payment to suppliers – The Functional Assessment Service (FAS) contract, which forms part of the Health Transformation Programme, was due to take effect on 1 April 2023 however, due to delays within the FAS procurement process owing to legal challenge there was a consequential 6 month delay to the effective start date of the contracts. During this period successful suppliers incurred costs as they prepared for contract commencement (pre-commencement costs). Pre-commencement cost payments have been made to 3 suppliers, one is below the threshold for reporting, the figures for the remaining two are £1.528 million and £0.919 million, respectively | 2,507 |
| Employment Tribunal Awards – Payments to Employees, Contactors and others, as a result of an Employment Tribunal | 449 |
| Special Severance – These are payments to employees, contractors and others, outside of normal statutory or contractual requirements when leaving employment in public service whether they resign, are dismissed or reach an agreed termination of contract. 38 Special Severance Payments were made in the previous financial year. The total amount paid out this year was £501,000. The maximum payment was £100,000, minimum was £278 and median value of all Payments made was £7,000 | 501 |
| Legal Settlements – These are payments for ex gratia out of court legal settlements | 1,522 |
| Secure Card Payment Service – Out of court settlement in resolution of a legal dispute regarding the procurement and supply of a Secure Card Payment Service (“SCPS”). The Claimants issued legal proceedings and filed a Particulars of Claim with the Court contesting DWP’s award of the 2022 Contract | 950 |
| Extra-statutory Payment – Special payments made to certain sufferers of a) unilateral diffuse pleural thickening or b) asbestos-related primary carcinoma of the lung (without asbestosis), or their dependants, who were not eligible for a lump-sum payment under the “Pneumoconiosis etc. (Workers’ Compensation) Act 1979” (or the “1979 Act”) scheme. The 1979 Act scheme legislation was amended in February 2024, to provide a legislative basis for future payments in respect of these diseases. Costs for this year are estimated at £1 million, and years 2002 to 2003 to 2022 to 2023 are estimated at £38 to £65 million. Prior year estimates are not included in the summary table | 1,000 |
| Loss of Statutory Entitlement Payments – These are special payments for financial redress to cover loss of statutory entitlement (LOSE) payments. They are paid if maladministration has caused a claimant to lose entitlement to statutory benefit payments | 417 |
| Student Income Apportionment – Regulation 71 of the Universal Credit Regulations 2013 did not provide for correct application of policy intent for students who made a claim to Universal Credit part way through their academic year. DWP received Treasury approval to make ex-statutory payments to students on UC between October 2019 and March 2024 in line with the original policy intent. On 1 April 2024, legislation was aligned with policy intent and these payments no longer need to be reported as ex-statutory | 19,976 |
| Out of court settlement for the Redhill site divestment – The Department incurred a special payment of £1 million as full and final settlement of all future liabilities with the landlord upon divestment of a DWP leasehold property | 1,000 |
| European Citizens in the European Union – These are ex-statutory payments made to a small cohort of EU citizens resident in the EU and in receipt of a UK benefit, who are not expressly covered by Title III of Part Two of the Withdrawal Agreement | 493 |
v. Fruitless Payments
| Payment | 2023 to 2024 £000 |
|---|---|
| Off-Payroll Working Rules – Payment to HM Revenue and Customs – DWP conducted a review of its managed service contracts that are held with third-party suppliers, ensuring these were fully contracted out services and not that of a supply of resource to the Department. The findings of the review, highlighted a number of contracts that were determined to be a supply of resource and where the off-payroll working rules had not correctly been applied. The contracts reviewed related to contracts spanning multiple tax years from 2022 to 2023 through to 2017 to 2018. DWP made an unprompted disclosure to HM Revenue and Customs including its findings and during 2023 to 2024 reached a settlement for a historic tax liability of £2.208 million | 2,208 |
vi. Constructive Losses
| Loss | 2023 to 2024 £000 |
|---|---|
| Write-off of PPE assets (boilers) – Due to the early vacation of Warbreck House, the equipment was derecognised part-way through its anticipated useful expected life | 487 |
| Decommissioning exercise – This loss is the total amount of rent DWP have paid relating to vacant property. This is linked to the planned decommissioning of a series of properties post the peak of the COVID-19 pandemic and in alignment with the DWP Estates Strategy, in order to deliver savings on site running costs and operational overheads and ensure readiness for divestment. These sites were taken on a 5 year lease, with a breakpoint at year 3. The Department has served notice to exit at the breakpoint but are committed to pay for these leases until that time | 16,449 |
vii. Claims waived or abandoned
| Claim | 2023 to 2024 £000 |
|---|---|
| Working Links – Working Links (Employment) Ltd provided employment support for the long-term unemployed on behalf of DWP. Working Links were contracted to deliver multiple welfare to work employment programmes in specific geographical areas within the UK. Working Links (Employment) Ltd fell into financial difficulty and in February 2019, went into administration. At the time of Administration, Working Links (Employment) Ltd had balances outstanding owing to DWP to the amount of £2,436,659. As part of the Administration, DWP received final Dividend of £61,661, and after netting off monies owed to Working Links (Employment) Ltd relating for the same contract, the final Bad debt write-off amounted to £1,480,056 | 1,480 |
viii. Other Accountability Issues
| Issue | 2023 to 2024 £000 |
|---|---|
| Counter Fraud and Investigation – DWP Other Accountability Fraud Data 1 April 2023 to 31 March 2024 – The Government Internal Audit Agency’s Counter Fraud and Investigation team provides counter fraud services to DWP. This includes the investigation of internal fraud and/or other serious breaches of the Department’s Standards of Behaviour by DWP employees, contractors and providers. Recovery action is taken at a local level and recoveries are not recorded separately for disclosure. Internal Fraud: – – Salary, expenses and other non-benefit losses: – – 35 investigations were completed, resulting in proven losses of £214,956. – Benefit related losses for example employee benefit fraud or diversion of payments: – – 25 investigations were completed, resulting in proven losses of £1,003,081. The total benefit related loss includes one investigation with an identified loss of £602,484. Over a four-month period, an employee issued erroneous backdated and repeated payments to claimants known to them. Upon discovery, immediate actions were taken, including dismissal of the employee. The Department initiated a review of internal controls and are fully cooperating with the ongoing criminal investigation | 1,218 |
Remote contingent liabilities
(This information is subject to audit)
These are remotely possible obligations that arise from past events whose existence will be confirmed only by the occurrence of one or more uncertain future events not wholly within DWP’s control. They are incorporated under parliamentary reporting requirements and not under IAS 37.
National Employment Savings Trust (Nest)
The Pension Schemes Act 2017 introduced the definition of a Master Trust and signalled the start of a robust new authorisation and supervision regime, administered by the Pensions Regulator to ensure that Master Trusts being used for automatic enrolment are safe for the many millions of people now saving in these schemes. To be able to operate as a Master Trust (MT), of which Nest is one, schemes are required to meet five authorisation criteria prescribed in the 2017 Act.
One of the criteria is that the scheme must be financially sustainable. This means that in the event of a triggering event, an event that would put the scheme at risk of needing to wind up, the scheme must hold sufficient financial reserves to cover its gradual closure, without putting these additional costs onto scheme members.
Due to the nature of its financial arrangements with government Nest, which has been an authorised MT scheme since 2019, is unable to build up the financial reserves needed to meet the financial sustainability criteria. Specifically, this is to hold sufficient funds to meet running costs for 24 months and any one-off costs associated with scheme closure. Using figures produced by Nest for The Pensions Regulator if a triggering event was to occur, then the maximum size of the contingent liability required to be made available to Nest would be £329 million. This was the amount estimated by Nest in 2019, subsequently restated and accepted by The Pension Regulator. Since then and prior to entering the supervisory process the amount of the liability is reviewed annually. As part of the annual review of Nest’s funding settlement the Department has agreed that Nest can hold capital sufficient to meet the difference between potential costs and the original assessment, so there is no change to the Department’s liability.
The Department has estimated that the risk of full crystallisation as remote (at £16.45 million (5%)). The contingent liability is underwritten through a ‘Letter of Comfort’ in order that Nest can comply with the Master Trust supervisory regime which came into effect in October 2020.
State Pension Underpayment exercise
The Department has completed the Legal Entitlements and Administrative Practice (LEAP) exercise for both Cat BL (Married) and Cat D (over 80) cases. Where a customer has failed to respond to the Department’s repeated attempts to obtain the information needed, the case is cleared but remains on the Department’s records. If the required information is subsequently provided, the case would be re-opened and any arrears paid. This is considered a remote possibility and it is not possible to quantify the Department’s liability.
Dormant ESA SDP underpayments
Some income-related ESA claimants should receive an additional element called a Severe Disability Premium if they are eligible. A claimant cannot apply for these as they are part of the benefit. To enable payment, claimants are required to provide up-to-date information that the Department requests on their individual circumstances. As a result of a combination of information not being provided, not being held and the Department not effectively assessing entitlement, some customers have missed out on additional premiums alongside their benefit award.
Unfortunately, some underpayments may be owed to customers who no longer have an active ESA claim and restrictions in data make it difficult to identify, assess and correct these errors. The Department is therefore disclosing an unquantified remote contingent liability.
Reconciliation of contingent liabilities included in the Supply Estimate to the accounts
(This information is not subject to audit)
Quantifiable Contingent Liabilities
| Description of contingent liability | Supply Estimate | Amount disclosed in ARA | Variance (Estimate – Amount disclosed in ARA) |
|---|---|---|---|
| Compensation Recovery[footnote 64] | £11,163,000 | £8,055,617 | £3,107,382 |
| Legal Cases[footnote 65] | £2,285,290,179 | £365,000,000 | £1,920,290,179 |
| Document and Data Management Services Contract[footnote 66] | £0 | £1,880,000 | (£1,880,000) |
| National Employment Savings Trust (NEST)[footnote 67] | £0 | £16,450,000 | (£16,450,000) |
Unquantifiable Contingent Liabilities
| Description of contingent liability | Included in Supply Estimate (Yes/No) | Disclosed in the ARA (Yes/No) | Explanation of difference |
|---|---|---|---|
| Benefit underpayments | Yes | Yes | N/A |
| European Social Fund (ESF) repayments | Yes | Yes | N/A |
| The Rent Service employee pensions | Yes | Yes | N/A |
| Compensation Claims | Yes | Yes | N/A |
| Dilapidation liability for leased property | Yes | Yes | N/A |
| Capital Diminution | No | Yes | Contingent Liability confirmed after submission of the Supply Estimate |
| State Pension Underpayment (Cat BL and Cat D) | No | Yes | Remote Contingent Liability confirmed after submission of the Supply Estimate |
| Dormant ESA SDP underpayments | No | Yes | Remote Contingent Liability confirmed after submission of the Supply Estimate |
Bodies outside the boundary
(This information is subject to audit)
The following are arm’s length bodies of DWP outside its accounting boundary:
Office for Nuclear Regulation
Pension Protection Fund
National Employment Savings Trust Corporation
Sir Peter Schofield KCB
Permanent Secretary
15 July 2024
The certificate of the Comptroller and Auditor General to The House of Commons
The Certificate of the Comptroller and Auditor General to the House of Commons and Report by the Comptroller and Audit General are produced by National Audit Office. The Department is unable to publish these in HTML format. The Report by the Comptroller and Audit General is available as a PDF direct on National Audit Office’s website.
The Certificate of the Comptroller and Auditor General to the House of Commons PDF is also available.
Financial statements
Introduction to the financial statements
These financial statements present the operating costs, financial position and cash flows of the Department for Work and Pensions for the year ended 31 March 2024.
In addition to its functions of paying benefits for welfare and pensions, its accounts include the following areas of spending:
National Insurance Fund (NIF)
HM Revenue and Customs is responsible for the NIF. DWP administers the benefits funded from the NIF (see note 5b) on HM Revenue and Custom’s behalf. DWP includes these in its Statement of Comprehensive Net Expenditure (SoCNE) and recover this expenditure, together with the associated cost of administration, from the NIF. Financing from the NIF is included in DWP’sStatement of Cash Flows.
Social Fund
DWP is responsible for the Social Fund, which is used to make grants and repayable loans to individuals. It makes regulated payments of Funeral Expenses Payments, Sure Start Maternity Grants, Winter Fuel Payments and Cold Weather Payments plus discretionary payments for Budgeting Loans. Where appropriate, the Department includes these in its SoCNE and any related receivables in the Statement of Financial Position (SoFP).
Child Maintenance Service (CMS)
DWP has responsibility for the management of client funds relating to the statutory child maintenance schemes operated through the Child Maintenance Service (CMS). Ongoing Child Maintenance and Legacy Child Support Agency (CSA) arrears only cases are managed through the CMS launched in 2012, following the closure of the CSA systems in August 2020. Although all managed through the CMS, cases are administered according to the rules of the particular scheme that was in effect when the arrears arose.
The running costs of CMS are charged to the Department however the funds they collect are not departmental assets and are not included in these accounts. CMS acts purely as custodian and the Department is required, by HM Treasury, to publish Client Funds Accounts separately.
European Social Fund (ESF)
The European Social Fund is one of the European Union structural funds designed to strengthen economic and social cohesion. It helps unemployed and socially excluded people find work or become more employable. It can also be used to help prevent people in work from becoming unemployed. DWP records the expenditure and income related to ESF programmes in its SoCNE. The ESF 2014 to 2020 programme will continue through to closure in 2025 to 2026. It will then be replaced by the UK Shared Prosperity Fund.
Other expenditure
This includes other expenditure that is voted to the Department by Parliament including the costs of running the Department and subsidies paid by grants to local authorities that administer and pay Housing Benefit. Grant in aid and grant payments to DWP’s arm’s length bodies are recorded as expenditure.
Arm’s length bodies
They are administered separately from the Department and they produce their own Annual Reports and Accounts. Excluding public corporations which fall outside of the Department’s accounting boundary, the arm’s length bodies are consolidated to inform the group accounts.
Consolidated Statement of Comprehensive Net Expenditure
for the year to 31 March 2024
| Expenditure | Note | 31 March 2024: Core Department £000 | 31 March 2024: Departmental group £000 | 31 March 2023: Core Department £000 | 31 March 2023: Departmental group £000 |
|---|---|---|---|---|---|
| Staff expenditure | 3 | 3,785,503 | 4,102,766 | 3,470,620 | 3,760,373 |
| Purchase of goods and services | 4 | 3,334,668 | 3,041,602 | 3,118,078 | 2,871,327 |
| Benefit and Social Fund expenditure | 5 | 268,516,641 | 268,516,641 | 234,824,830 | 234,824,830 |
| Depreciation and impairment charges | 6 | 676,630 | 692,597 | (926,320) | (910,565) |
| Provision expense | 6 | (508,853) | (508,787) | (395,681) | (396,024) |
| Total operating expenditure | – | 275,804,589 | 275,844,819 | 240,091,527 | 240,149,941 |
| Operating income | 7 | (869,919) | (981,397) | (901,020) | (990,608) |
| Total operating income | – | (869,919) | (981,397) | (901,020) | (990,608) |
| Finance income | 7 | (36,299) | (37,002) | (26,754) | (27,117) |
| Finance expense | 4 | 15,440 | 49,077 | 11,987 | 30,680 |
| Net expenditure for the year | – | 274,913,811 | 274,875,497 | 239,175,740 | 239,162,896 |
| Donated assets | 8 | (148,451) | (148,451) | (134,177) | (134,177) |
| Net operating costs for the year | – | 274,765,360 | 274,727,046 | 239,041,563 | 239,028,719 |
Other comprehensive net expenditure
Items that will not be reclassified to net operating expenditure
| Item | Net loss/(gain) | Net loss/(gain) | Net loss/(gain) | Net loss/(gain) |
|---|---|---|---|---|
| Revaluation of property, plant and equipment | – | (2,240) | – | 3,057 |
| Revaluation of intangibles | (56,628) | (56,875) | (24,060) | (24,462) |
| Revaluation of pension fund | (1,766) | (1,766) | (2,787) | (2,787) |
| Total comprehensive net expenditure for the year ended 31 March 2024 | 274,706,966 | 274,666,165 | 239,014,716 | 239,004,527 |
All income and expenditure is derived from continuing operations.
Consolidated Statement of Financial Position
as at 31 March 2024
| Note | 31 March 2024: Core Department £000 | 31 March 2024: Departmental group £000 | 31 March 2023: Core Department £000 | 31 March 2023: Departmental group £000 | |
|---|---|---|---|---|---|
| Non-current asset: Property, plant and equipment | 9 | 1,247,714 | 1,382,388 | 1,283,011 | 1,417,086 |
| Non-current asset: Intangible assets | 10 | 517,508 | 558,880 | 463,753 | 483,305 |
| Non-current asset: Trade receivables, financial and other assets | 14 | 6,757,775 | 6,760,015 | 6,387,633 | 6,389,797 |
| Total non-current assets | 8,522,997 | 8,701,283 | 8,134,397 | 8,290,188 | |
| Current assets: Trade receivables, financial and other assets | 14 | 3,867,838 | 3,929,881 | 4,135,971 | 4,188,250 |
| Current assets: Cash and cash equivalents | 13 | 379,949 | 382,251 | 982,565 | 991,742 |
| Total current assets | 4,247,787 | 4,312,132 | 5,118,536 | 5,179,992 | |
| Total assets | 12,770,784 | 13,013,415 | 13,252,933 | 13,470,180 | |
| Current liabilities: Trade payables and other liabilities | 15 | (10,783,912) | (10,866,000) | (9,879,452) | (9,971,892) |
| Current liabilities: Provisions for liabilities and charges | 17 | (1,186,618) | (1,186,743) | (1,764,831) | (1,765,527) |
| Total current liabilities | (11,970,530) | (12,052,743) | (11,644,283) | (11,737,419) | |
| Total assets less current liabilities | 800,254 | 960,672 | 1,608,650 | 1,732,761 | |
| Non-current liabilities: Provisions for liabilities and charges | 17 | (5,024,166) | (5,024,712) | 5,682,431) | (5,682,941) |
| Non-current liabilities: Other payables | 15 | (956,222) | (1,044,748) | (1,044,754) | (1,137,708) |
| Non-current liabilities: Pension liability | 18 | – | (887) | – | (989) |
| Total non-current liabilities | (5,980,388) | (6,070,347) | (6,727,185) | (6,821,638) | |
| Assets less liabilities | (5,180,134) | (5,109,675) | (5,118,535) | (5,088,877) | |
| Taxpayers’ equity and other reserves: General fund | (5,241,356) | (5,210,975) | (5,167,815) | (5,175,748) | |
| Taxpayers’ equity and other reserves: Revaluation reserve | 61,222 | 101,300 | 49,280 | 86,871 | |
| Total equity | (5,180,134) | (5,109,675) | (5,118,535) | (5,088,877) |
Sir Peter Schofield KCB
Permanent Secretary
15 July 2024
Consolidated Statement of Cash Flows
for the year ended 31 March 2024
| Note | 31 March 2024: Core Department £000 | 31 March 2024: Departmental group £000 | 31 March 2023: Core Department £000 | 31 March 2023: Departmental group £000 | ||
|---|---|---|---|---|---|---|
| Cash flows from operating activities (CFOA): Net cost for the year | – | (274,765,360) | (274,727,046) | (239,041,563) | (239,028,719) | |
| CFOA: Adjustments for non-cash transactions | – | 6,7 | 170,422 | 188,464 | (1,307,156) | (1,291,737) |
| CFOA: Adjustments for Capital Grant in Kind transfers | 8 | (148,451) | (148,451) | (134,177) | (134,177) | |
| CFOA: Decrease/(increase) in trade and other receivables | 14 | (102,009) | (111,849) | (2,179,643) | (2,182,569) | |
| CFOA: Movements in receivables relating to items not passing through the Statement of Comprehensive Net Expenditure | – | 111,557 | 109,885 | 778,418 | 754,953 | |
| CFOA: Increase/(decrease) in trade and other payables | 15 | 1,423,919 | 1,409,173 | 1,059,172 | 1,091,255 | |
| CFOA: Movements in payables relating to items not passing through the Statement of Comprehensive Net Expenditure | – | (7,453) | (6,705) | 873,485 | 876,688 | |
| CFOA: Utilisation of provisions | 17 | (777,919) | (778,613) | (750,040) | (750,040) | |
| Net cash outflow from operating activities | – | 274,095,294) | (274,065,142) | (240,701,504) | (240,664,346) | |
| Cash flows from investing activities (CFIA): Purchase of property, plant and equipment | 9b | (189,722) | (198,559) | (96,792) | (104,783) | |
| CFIA: Purchase of intangible assets | 10a | (109,818) | (130,257) | (108,633) | (123,031) | |
| CFIA: Proceeds of disposal of property, plant and equipment and intangible assets | – | – | 7 | – | 175 | |
| CFIA: Loans to other bodies – repayments[footnote 79] | – | 1,508 | 1,508 | 1,284 | 1,284 | |
| CFIA: Loans to other bodies | – | (63,000) | (63,000) | (139,500) | (139,500) | |
| Net cash outflow from investing activities | – | (361,032) | (390,301) | (343,641) | (365,855) | |
| Cash flows from financing activities (CFFA): From the Consolidated Fund (supply) current year | 145,073,905 | 145,073,905 | 125,383,096 | 125,383,096 | ||
| CFFA: Net financing from the National Insurance Fund | – | 129,998,803 | 129,998,803 | 115,841,347 | 115,841,347 | |
| CFFA: Advances from the contingencies fund | – | – | – | 2,477,600 | 2,477,600 | |
| CFFA: Repayments to the contingencies fund | – | – | – | (2,477,600) | (2,477,600) | |
| CFFA: Capital element of payments in respect of leases and on-Statement of Financial Position PFI contracts | – | (239,092) | (246,816) | (261,288) | (268,267) | |
| Net financing | – | 274,833,616 | 274,825,892 | 240,963,155 | 240,956,176 | |
| Net increase/(decrease) in cash and cash equivalents in the period before adjustment for receipts and payments to the Consolidated Fund | – | 377,290 | 370,449 | (81,990) | (74,025) | |
| Payments of amounts due to the Consolidated Fund | – | (371,915) | (371,915) | (36,300) | (36,300) | |
| Net (decrease)/increase in cash and cash equivalents in the period after adjustment for receipts and payments to the Consolidated Fund | 13 | 5,375 | (1,466) | (118,290) | (110,325) | |
| Cash and cash equivalents at the beginning of the period | 13 | (1,211,956) | (1,202,889) | (1,093,666) | (1,092,564) | |
| Cash and cash equivalents at the end of the period[footnote 80] | 13 | (1,206,581) | (1,204,355) | (1,211,956) | (1,202,889) |
Consolidated Statement of Changes in Taxpayers’ Equity
for the year ended 31 March 2024
| Note | General Fund: Core Department £000 | General Fund : Departmental group £000 | Revaluation Reserve: Core Department £000 | Revaluation Reserve: Departmental group £000 | Total Reserves: Core Department £000 | Total Reserves: Departmental group £000 | |
|---|---|---|---|---|---|---|---|
| Balance at 31 March 2022 | – | (7,974,970) | (7,995,747) | 37,382 | 77,628 | (7,937,588) | (7,918,119) |
| Net parliamentary funding drawn down (current year) | – | 125,383,096 | 125,383,096 | – | – | 125,383,096 | 125,383,096 |
| Repayments to the Consolidated Fund SOPS | 4 | (1,659) | (1,659) | – | – | (1,659) | (1,659) |
| Net parliamentary funding – deemed | – | 661,918 | 661,918 | – | – | 661,918 | 661,918 |
| Funding from National Insurance Fund | – | 115,841,347 | 115,841,347 | – | – | 115,841,347 | 115,841,347 |
| Advances from the contingencies fund | – | 2,477,600 | 2,477,600 | – | – | 2,477,600 | 2,477,600 |
| Repayments to the contingencies fund | – | (2,477,600) | (2,477,600) | – | – | (2,477,600) | (2,477,600) |
| Supply payable adjustment | 15 | (33,427) | (33,427) | – | – | (33,427) | (33,427) |
| CFERS payable to the Consolidated Fund | SOPS 4 | (18,013) | (18,013) | – | – | (18,013) | (18,013) |
| General fund – other | – | (1,080) | (1,080) | – | – | (1,080) | (1,080) |
| Net costs for the year | – | (239,041,563) | (239,028,719) | – | – | (239,041,563) | (239,028,719) |
| Non-cash adjustments: Non-cash charges – Auditor’s remuneration | 6 | 1,587 | 1,587 | – | – | 1,587 | 1,587 |
| Non-cash adjustments: Actuarial revaluation on pension | 18 | 2,787 | 2,787 | – | – | 2,787 | 2,787 |
| Movements in reserves: Recognised in Statement of Comprehensive Net Expenditure | – | – | – | 24,060 | 21,405 | 24,060 | 21,405 |
| Movements in reserves: Transfers between reserves | – | 12,162 | 12,162 | (12,162) | (12,162) | – | – |
| Balance at 31 Mar 2023 | – | (5,167,815) | (5,175,748) | 49,280 | 86,871 | (5,118,535) | (5,088,877) |
| Net parliamentary funding drawn down (current year) | – | 145,073,905 | 145,073,905 | – | – | 145,073,905 | 145,073,905 |
| Repayments to the Consolidated Fund | SOPS 4 | (351,487) | (351,487) | – | – | (351,487) | (351,487) |
| Net parliamentary funding – deemed | – | 33,427 | 33,427 | – | – | 33,427 | 33,427 |
| Funding from National Insurance Fund | – | 129,998,803 | 129,998,803 | – | – | 129,998,803 | 129,998,803 |
| Supply payable adjustment | 15 | (88,583) | (88,583) | – | – | (88,583) | (88,583) |
| CFERS payable to the Consolidated Fund | SOPS 4 | (22,389) | (22,389) | – | – | (22,389) | (22,389) |
| Net costs for the year | – | (274,765,360) | (274,727,046) | – | – | (274,765,360) | (274,727,046) |
| Non-cash adjustments: Non-cash charges – Auditor’s remuneration | 6 | 1,691 | 1,691 | – | – | 1,691 | 1,691 |
| Non-cash adjustments: Actuarial revaluation on pension | 18 | 1,766 | 1,766 | – | – | 1,766 | 1,766 |
| Movements in reserves: Recognised in Statement of Comprehensive Net Expenditure | – | – | – | 56,628 | 59,115 | 56,628 | 59,115 |
| Movements in reserves: Transfers between reserves | – | 44,686 | 44,686 | (44,686) | (44,686) | – | – |
| Balance at 31 March 2024 | – | (5,241,356) | (5,210,975) | 61,222 | 101,300 | (5,180,134) | (5,109,675) |
The general fund represents the total assets less liabilities of the entities within the accounting boundary, to the extent that the total is not represented by other reserves and financing items.
The revaluation reserve reflects the unrealised element of the cumulative balance of indexation and revaluation adjustments.
Notes to the accounts
1. Statement of accounting policies
Basis of preparation and statement of compliance
These financial statements have been prepared in accordance with the 2023 to 2024 government Financial Reporting Manual (FReM) issued by HM Treasury. The accounting policies in the FReM apply International Financial Reporting Standards (IFRS) as adapted or interpreted for the public sector.
Where the FReM allows choice of accounting policy, DWP has selected the one that it thinks is the most appropriate to its circumstances and which gives a true and fair view. The policies adopted are set out below. They have been applied consistently in dealing with items considered material to the accounts.
As well as preparing the primary statements under IFRS, DWP is required under the FReM to prepare the Statement of Outturn against Parliamentary Supply. The statement shows outturn against estimate in terms of net resource requirement and net cash requirement.
These accounts have been prepared on a going concern basis.
1.2. Accounting standards, interpretations and amendments
DWP has adopted all IFRS, International Accounting Standards (IAS), International Financial Reporting Interpretations Committee (IFRIC) interpretations and amendments to published standards that were effective at 31 March 2024. The specific interpretations and adaptations included in the FReM have also been taken into account.
IFRS 17 (Insurance Contracts) effective from 1 April 2025
The International Accounting Standards Board (IASB) has issued IFRS 17 (Insurance Contracts), which replaces IFRS 4 (Insurance Contracts). It has been effective since 1 January 2023, following IASB decisions to defer the effective date.
An insurance contract is a contract under which one party (the issuer) accepts significant insurance risk from another party (the policyholder) by agreeing to compensate the policyholder if a specified uncertain future event (the insured event) adversely affects the policyholder.
Insurance risk is the risk the entity accepts from the policyholder. This means the entity must accept, from the policyholder, a risk to which the policyholder was already exposed. Any new risk created by a contract for the entity or the policyholder is not insurance risk. On this basis the Department expects there to be no impact as it does not have insurance contracts where it accepts risk to which the policyholder was already exposed.
1.3. Accounting convention
These financial statements have been prepared on an accruals basis under the historical cost convention modified to account for the revaluation of property, plant and equipment, intangible assets, inventories and some financial assets and liabilities.
These financial statements are prepared in £ sterling, which is DWP’s functional currency.
1.4. Basis of consolidation
These statements cover the whole departmental group, meaning the core department, which is supply financed (parliament has given statutory authority to utilise funding), plus all of DWP’s arm’s length bodies that fall within the departmental boundary. All material transactions between entities included in this consolidation have been eliminated.
1.5. Critical accounting judgements and key sources of estimation uncertainty
Critical judgements
In preparing the financial statements, DWP has to make critical judgements, apart from those involving estimations (which are presented separately below), that affect the application of policies and have impacts on the reported amounts of its assets and liabilities, income and expenditure.
Incorrect payments
DWP is responsible for paying claimants the right benefit at the right time. However, administrating over 25 different benefits is a complex business which may introduce a risk of fraud and error leading to some incorrect payments.
Incorrect payment estimates are produced to the standards of the UK Statistics Authority national statistics protocols. Further information on DWP’s estimation strategy can be found at GOV.UK (within the latest National Statistics publication, and the accompanying background information and methodology document).
A planned review of the ‘Fraud and error in the benefit system’ statistics determined that the estimates previously published as Claimant Error underpayments do not fit the legal definition of underpayments. In benefit legislation, claimants are not eligible for increases in their benefit until they accurately report changes in their circumstances to the Department. Due to this, estimates that were previously reported as Claimant Error underpayments have been removed from the ‘Fraud and error in the benefit system’ publication and are reported separately in a new ‘Unfulfilled eligibility in the benefit system’ publication. Further details are available in section 2 of the Fraud and Error in the benefit system background information document.
DWP estimates the level of overpayment and underpayments in benefit expenditure each year based on a sample of benefit records, and these are reported in the incorrect payments note (note 19). It is estimated that 96% of £266 billion of benefit payments were made correctly in this reporting year.
It is estimated that there was £3.1 billion of Unfulfilled Eligibility in this reporting year. This equates to 1.2% of £266 billion of benefit payments made in the year.
The overpayment debt and underpayment liabilities, along with the related movements in the SoCNE, implied by these estimates are not recognised in these financial statements because the specific rights of and obligations to individual claimants of potential overpayment and underpayments have not been identified. DWP corrects all individual cases sampled where overpayments or underpayments are identified.
Benefit expenditure
As there are no specific IFRS or FReM regulations regarding benefit expenditure, the Department has determined an appropriate policy to pay benefit claimants under relevant legislation.
The Department’s judgement is that expenditure in respect of social benefit payments is recognised at the point at which the claimant is deemed to be eligible to the social benefit or activity that gives rise to a liability (defined as the period of entitlement or in the case of new claims, the date of the first payment being made). Only the expenditure for the period of entitlement that falls within the accounting year should be recognised. Further details are contained in 1.7.
Expected credit loss
As the Department does not assess credit risk, the lifetime expected credit loss approach is adopted for benefit related receivables, further details on this approach is outlined in section 1.11.
Key sources of estimation uncertainty
The key assumptions concerning the future, and other key sources of estimation uncertainty at the reporting period may have a significant risk of causing a material adjustment to the carrying amounts of assets and liabilities within the next financial year, are discussed below.
Financial Assistance Scheme (FAS)
For the FAS provision (note 17), DWP estimatesthe net present value of the likely assistance payments, based onan actuarial model of likely caseload provided by the Pension Protection Fund who manage the scheme. Cash flows are discounted to give their present value at 31 March 2024. The rates used take account of the latest economic conditions and are updated annually.
The FAS assets, which are not recognised in the DWP balance sheet, are mostly held as annuities. The income streams from these are generally not affected by any market volatility, although the present value placed on them will depend on the discount rate, which could be impacted. The income streams, and therefore the present value, will also be impacted by the mortality experienced by the members the annuities relate to.
Due to the long-term nature of the liabilities and the assumptions on which the estimate of the provision is based, some uncertainty about the value of the liability remains. All key assumptions requiring some level of judgement are detailed in note 17 along with a sensitivity analysis table to demonstrate the impact on the estimate when key assumptions are adjusted.
Impairment of financial instruments
To calculate the impairment for benefit overpayments, DWP continues to review historic rates of debt recovery and write-off to give basis of future expected credit loss. Benefit overpayment debts are assumed to have an asset life of 20 years from the reporting date. The Department groups debts by benefit and age then forecasts recoveries and write-offs in a model which considers historical data. More detail is provided in note 1.11.1.
Benefit provisions and underpayments
Benefit provisions and underpayments arise from ongoing Legal Cases against the Department or are identified as a result of internal procedures such as Legal Entitlements and Administrative Practice (LEAP) exercises. These provisions are estimated using data provided by analysts which is based on sampling and other analytical data. The estimates are reviewed and updated regularly based on the latest data. DWP does not provide for benefit provisions or underpayments that are below a set de minimus limit (see note 1.12). The Department does not include an estimate within its accounts of general underpayments caused by official error. This is because the amount cannot be reliably measured. Instead, a contingent liability is disclosed in accordance with IAS 37 (Provisions, Contingent Liabilities and Contingent Assets) (see note 20).
State Pension underpayments
DWP discloses a provision for a liability in relation to two State Pension exercises to correct historic underpayment: State Pension Underpayment (SPU) and Home Responsibilities Protection (HRP). For both exercises the provision is calculated using analytical estimates of the number of people affected and the level of arrears. A description of the methodologies and further detail, including the impact of sensitivity analysis on the key assumptions, is in Note 17.
1.6. Revenue recognition (income)
DWP complies with IFRS 15 (Revenue from Contracts with Customers) for income streams and recognise revenue when earned. For the European Social Fund, where DWP acts as an agent, income is recognised in the accounting periods in which the EU sponsored projects are funded.
1.7. Benefit expenditure
Expenditure in respect of social benefit payments is recognised in the financial statements at the point at which the claimant is deemed to be eligible and the payment is due to the customer.
Payments made are structured into periods of entitlement. Customers are eligible for payment if they meet qualifying criteria throughout the entitlement period.
The majority of payments are made in arrears, by which time the entitlement period will have been fully completed. There are however certain options to receive payment in advance relating to specific circumstances predominately on the initial claim to people of pension age or to terminally ill customers.
The frequency of benefit payments can be seen online at How and when your benefits are paid - GOV.UK (www.gov.uk). Due to the frequency of the majority of payments being fortnightly or longer, it is common that an entitlement period will cross two financial years. In such a situation, accounting adjustments are made to ensure only the amount relating to each financial year is recognised within it. For example, when a payment made in April 2024 where an element of the entitlement period falls in March 2024, DWP has accrued expenditure relating to 2023 to 2024 to ensure it is recognised in the correct financial year.
Universal Credit is assessed and paid in arrears, on a monthly basis and in a single payment. State Pension is usually paid every 4 weeks in arrears. Universal Credit and State Pension equate to circa 81% of all arrears payments made. Other working-age benefits are paid a minimum of fortnightly in arrears and have a common payday.
Benefit advances are classed as financial assets rather than expenditure (see note 1.11.1). As such they are recognised in the SoFP at the time of payment. Repayments of the advance are deducted from future benefit payments. Deductions to repay advances and other receivables do not impact the total benefit expenditure which is recognised from the underlying entitlement.
1.8. Property, plant and equipment
Property, plant and equipment are stated at fair value. However, as permitted by the FReM, DWP has adopted a depreciated historical cost basis as a proxy for fair value where non-property assets have a short useful life or are of relatively low value. This applies to most IT hardware, motor vehicles, plant and machinery and furniture and fittings.
Assets are capitalised where they have an expected useful life of more than one year and where the original cost of the item exceeds the capitalisation threshold. Where appropriate, intangible assets are pooled. Current departmental policy does not allow for pooling of tangible assets. The following thresholds apply:
- Leasehold improvements £100,000
- Other tangible assets £5,000
- Information technology £5,000
All expenditure on repairs and maintenance is charged to the SoCNE during the financial year in which it’s incurred.
1.8.1. Land and buildings
DWP measures land and buildings initially at cost, restated to current value using external professional valuations. This is in accordance with IAS 16 (Property, Plant and Equipment), as interpreted by the FReM. Inspections of each property are performed at least every five years. In the intervening years, the valuers use an indexation model developed to be appropriate to the property location to value the land and building asset.
Health and Safety Executive (HSE) Assets like Redgrave Court are valued on an existing-use basis and Buxton laboratory site is an exception that is included at depreciated replacement cost as provided under IAS 16, adapted and interpreted for the public sector to limit the circumstances in which a valuation is prepared under IFRS 13 (Fair Value Measurement).
Spending on major refurbishment and improvement of properties is capitalised and reported as land and buildings or leasehold improvements, depending on its nature. This is appropriate because the expenditure provides a long-term continuing benefit.
Currently DWP do not own any Land and Buildings. However, independent valuations have been performed on Buxton and Redgrave land and buildings (owned by HSE). In each case, the valuations were performed on a fair-value basis by members of the Royal Institution of Chartered Surveyors, in accordance with their Appraisal and Valuation Standards.
The following independent valuations have been performed on land and buildings:
| Building | Valuations performed by | Date of last full valuation |
|---|---|---|
| HSE Redgrave Court, Bootle | Cushman and Wakefield | 31 January 2020 |
| HSE Health and Safety Laboratory, Buxton | Jones Lang LaSalle Ltd | 31 January 2020 |
1.9. Intangible assets
Whether intangible assets are acquired externally or generated internally, DWP measures them initially at cost, with subsequent measurement at fair value. Where an active market exists for the asset, it is carried at a revalued amount based on market value at the end of the reporting period. Where no active market exists, DWP revalues assets using appropriate indices to indicate depreciated replacement cost as an alternative for fair value.
DWP revalues internally developed software and software licences using the most recent Office for National Statistics published indices.
Purchased software licences
DWP capitalises software licences and applications at cost as intangible assets if they are in use for more than one year and cost more than £5,000.
Multi-year software as a service agreement, comprising software licence and service elements paid for on a subscription basis, are reviewed individually to determine the extent of the service provision. Any licencing component in the agreement is assessed against IAS 38 (Intangible Assets) to determine whether it meets the criteria for recognition as an intangible asset and where it does, a threshold of £1 million is applied.
DWP later revalues these using appropriate indices as a proxy for fair value. As DWP owns so many software licences, it accounts for them on a pooled basis.
IP addresses are held as a specific sub-category until the point they satisfy the criteria to be reclassified as assets held for sale. They are held at market value, based on an estimate of the income they would currently return in the emerging IP address market.
Spending on annual software licences is charged to the SoCNE when incurred.
Internally developed software
DWP capitalises internally developed software if it meets the criteria in IAS 38 (Intangible Assets). It classifies development costs as assets under the course of construction until the asset is available for use. At that point, it is transferred to the relevant asset class.
Website development costs
DWP capitalises website development costs in line with the requirements of SIC 32 (Intangible Assets – Web Site Costs).
1.10. Depreciation and amortisation
DWP charges depreciation on property, plant and equipment and calculate amortisation on intangible assets with a finite life using the straight-line method to reflect the consumption of economic benefits. Depreciation and amortisation is charged to either administration or programme costs in accordance with how the associated assets are being used.
Depreciation
No depreciation is charged on freehold land. Estimated useful asset lives are within these ranges:
| Asset | Depreciation |
|---|---|
| Freehold buildings | The shorter of 50 years or remaining life as assessed by valuers |
| Leasehold land and buildings | Period remaining on lease or to next rent review |
| Health and Safety Executive/Health and Safety Laboratory Private Finance Initiative (PFI) leasehold buildings | 60 years designated life |
| Leasehold improvements | Period remaining on lease (up to 20 years) |
| Information technology | 2 to 15 years |
| Plant and machinery | 5 to 10 years (5 to 20 years for HSE’s Science Division) |
| Furniture and fittings | >1 to 15 years (>1 to 30 years for HSE’s Science Division) |
| Motor vehicles | 3 to 10 years |
| Amortisation: Purchased software licences | The shorter of the licence period or a period from >1 to 15 years as aligned to the useful economic life (UEL) of the application/developed software the licence provides access to |
| Amortisation: Internally developed software | >1 to 20 years |
| Websites | 5 to 7 years |
1.11. Financial Instruments
In line with the government Financial Reporting Manual adaptation of IAS 32 (Financial Instruments: Presentation) and IFRS 9 (Financial Instruments), DWP recognises financial assets and liabilities when it becomes party to the contracts or legislation that give rise to them. For financial assets, this includes benefit overpayments, benefit advances and Tax Credits receivables.
1.11.1. Financial Assets
Financial assets include cash and cash equivalents, trade and other receivables, loans, benefit advances, benefit overpayments and Tax Credits receivables. The Department determines the classification of its financial assets at initial recognition. DWP’s policy is not to trade in financial instruments. The Department holds all assets in order to collect cash flows, there is no intention to sell financial assets. The contractual cash flows are solely repayments of principal debt and therefore the debt is measured at amortised cost.
Financial assets are recognised initially at fair value, normally being the transaction price plus, in the case of financial assets not at fair value through profit and loss (FVTPL), directly attributable costs. Further details on the recognition and measurement of specific classes of financial assets are included below.
Trade and other receivables, and loans
Trade and other receivables have fixed or determinable payments that are not quoted on an active market and they do not carry interest. The initial recognition of trade and other receivables is usually the original invoiced amount.
Subsequent recognition of the trade and other receivables is at amortised cost using the effective interest method. The appropriate impairment allowance is detailed below.
Benefit overpayments
As part of assessing and paying benefits, people can be paid more than they are legally entitled to under the relevant benefit legislation either due to fraud or error. Where overpayments to individuals are identified, and the Department has a legal right to recover the excess amount paid, the amount owed is recognised as a benefit overpayment receivable.
DWP holds all benefit overpayments to collect the cash flows due. Benefit overpayments are not quoted on any active market and do not carry interest. Cash flows consist of the repayment of principal only. They are therefore measured at amortised cost, less recoveries to date, and subject to impairment for expected credit losses.
The Secretary of State has an obligation to protect public funds and to ensure that, wherever possible, overpayments are recovered. DWP seeks to recover all benefit overpayments where it has the legal basis to do so unless it would cause financial hardship or would not be cost-effective. Where recovery isn’t cost-effective, DWP writes off overpayments, with the exception of fraud cases which are exhausted as far as possible. DWP’s write-off policy has been agreed with HM Treasury. Debts are normally recovered through deductions of voluntary agreements with debtors or deductions from earnings.
DWP does not recognise certain categories of identified benefit overpayment as receivables, including:
- those due to official error where there is no statutory right of recovery
- cases satisfying Secretary of State waiver policies
- where the claimant has died, and the estate isn’t large enough to recover the overpayment
These losses are included in the Losses and Special Payments note.
In addition to the above, the balance of gross benefit overpayments does not include all of the estimated overpayments reported in note 18, Incorrect Payments, based on the estimates arising from the annual Fraud and Error measurement exercise in this year (or prior years) because a receivable cannot be recognised if:
- the overpayment has not been identified by the Department
- an identified overpayment has not been properly referred for collection
- the referred overpayment has not been processed and communicated to the claimant
These overpayments are excluded from the financial statements because the relevant process - required under benefit legislation to establish the underlying rights for the receivable – is incomplete and an asset cannot be recognised (see note 1.5).
Benefit advances
Benefit advances mainly relate to Universal Credit and are, in effect, an advancement of a claimant’s first indicative award. They are intended to provide support for individuals in the period between a benefit claim and the first benefit payment. The cash advance paid is recognised as a benefit advance receivable.
DWP holds all benefit advances to collect the cash flows due. Benefit advances are not quoted on any active market and do not carry interest. Cash flows consist of the repayment of principal only. They are therefore measured at amortised cost, less recoveries to date, and subject to impairment for expected credit losses.
Benefit advances are subject to the same recovery and write-off policies as for benefit overpayments.
Tax Credits
In April 2016, DWP started to take on the receivables associated with HM Revenue and Customs Personal Tax Credits for customers who have made a claim to Universal Credit (UC) and have existing Tax Credits debt or have migrated from Tax Credits to UC. The transfer of receivables is planned to continue over the coming years as more customers move to UC. HM Revenue and Customs have also transferred additional Tax Credit receivables not related to UC claimants to make use of DWP’s recovery powers.
In line with the government Financial Reporting Manual adaptation of IAS 20 (Accounting for Government Grants and Disclosure of Government Assistance) this transfer has been treated as a donated asset capital grant in kind and disclosed as such throughout the Financial Statements. The receivables have been transferred to DWP at the carrying value which was calculated at the point of transfer by HM Revenue and Customs using their impairment rate applied to the gross debt.
DWP holds all Tax Credit receivables to collect the cash flows due. Tax Credit receivables are not quoted on any active market and do not carry interest. Cash flows consist of the repayment of principal only. They are therefore measured at amortised cost, less recoveries to date, and subject to impairment for expected credit losses.
Following the transfer, Tax Credit receivables are subject to the same policies as those set out for benefit overpayments.
Impairment of Financial Assets
Trade and other receivables
All departmental assets are impaired using the IFRS 9 (Financial Instruments) simplified approach, whereby a historical recovery rate is calculated and applied to the debts according to age profile. These have been detailed within Note 14. Within the Trade and other receivables category DWP has debts relating to Support for Mortgage Interest, other government departments, payroll overpayments, recovery of admin penalties and Independent Living Fund.
Benefit related financial assets
Unlike commercial credit arrangements, the assessment and payment of benefits occurs under specific legislation, without reference to credit risk and frequently without agreed contractual cash flows for repayment. Consequently, when these assets are assessed for impairment under IFRS 9 (Financial Instruments), changes in credit risk cannot be used to assess whether lifetime expected credit losses should be recognised and contractual cash flows cannot be used as an indicator of credit risk or default. The Department has therefore chosen to provide for lifetime expected credit losses for the following categories of benefit related financial assets:
- benefit overpayments
- benefit advances
- Tax Credit receivables
- Social Fund loans
Receivables are grouped by the benefit they relate to, with impairments calculated on a collective basis for each group. This approach reflects the different demographics and socio-economic backgrounds of claimants to different benefits.
DWP’s impairment calculation considers the expected recoveries over the lifetime of the debt and impairs the debt balance. It further discounts using the HM Treasury provided discount rate. The Department’s Impairment calculation:
1. Uses historic performance to assess future recoveries
2. Assumes recovery rates are linked to the age of the debt
3. Assumes that debts have a lifespan of 20 years
Further details are explained in Note 14a.
Cash and cash equivalents
Cash and cash equivalents comprise cash in hand, short term deposits with an initial maturity of three months or less and current balances with banks and similar institutions. For the purpose of the Consolidated Statement of Cash Flows, cash and cash equivalents are net of outstanding bank overdrafts. DWP includes bank overdrafts in current liabilities in the Statement of Financial Position.
Derecognition of Financial assets
Financial assets are derecognised when the rights to receive future cash flows have expired or are transferred and the risks and rewards of ownership have been substantially transferred.
1.11.2. Financial Liabilities
Financial liabilities are measured at amortised cost. Financial liabilities include trade and other payables and loans. The Department does not currently have financial liabilities measured at fair value through profit or loss and neither does it have complex derivative financial instruments.
Trade and other payables
Trade and other payables excluding accruals, are generally not interest bearing and are stated at their invoice value on initial recognition. Subsequently they are measured at amortised cost.
Accruals
Accruals are generally not interest bearing and are stated at their invoice value on initial recognition. Accrued benefit expenditure relates to benefit payments paid in April 2024 relating to entitlement weeks within 2023 to 2024 and are, therefore, recognised as accrued expenditure in these financial statements. These will fluctuate year-on-year depending on the specific benefit payday that the last working day falls.
Derecognition of financial liabilities
Financial liabilities are derecognised when the obligation is discharged, cancelled or expires.
1.12. Provisions
DWP recognises provisions in accordance with IAS 37 (Provisions, Contingent Liabilities and Contingent Assets). They are valued using the best estimate of the expenditure required to settle the obligation. Where the effect of the time value of money is significant, the estimated risk-adjusted cash flows are discounted using the real rate set by HM Treasury.
Financial Assistance Scheme (FAS) and other provisions
The de minimis threshold used for Benefit provisions does not apply to FAS and the Department’s other provisions (note 17a and 17e) although clearly immaterial items will not be provided for.
Benefit provisions and underpayments
Benefit provisions are in relation to ongoing legal cases against the Department or have been identified as a result of internal procedures such as Legal Entitlements and Administrative Practice (LEAP) exercises. These provisions are estimated using data provided by analysts which is based on sampling and other analytical data. The estimates are reviewed and updated regularly based on the latest data.
DWP applies a de minimis threshold for provisions and contingent liabilities associated with the social security benefits the Department administers.
The threshold of the de minimis is £10 million for individual liabilities and a £90 million de minimis is applied in aggregate. The thresholds will be reviewed annually to ensure they remain appropriate.
Distinct from legal cases, the Department acknowledges that official error by its staff will sometimes result in the underpayment of benefit. At present there is no mechanism by which DWP can calculate the value of historic official error corrected in year, to support an overall quantification of the outstanding liability. The Department therefore discloses a contingent liability, see note 20.
State Pension underpayment provisions
These are specific liabilities relating to underpayment of benefit. As such, DWP adopts the same policy as set out for Benefit provisions. These items however merit separate disclosure in Note 17 (Provisions for liabilities and charges) due to their materiality and likely interest to readers of the accounts.
1.13. Pensions
The provisions of the Principal Civil Service Pension Scheme (PCSPS) cover past and present employees. The defined benefit schemes are unfunded and are contributory public service occupational pension schemes made under the Superannuation Act 1972. In accordance with the FReM paragraph 8.2 adaptation of IAS 19, the Department accounts for these as defined contribution schemes and recognised contributions it pays as an expense in the year in which they are incurred. Liability for payment of future benefits is a charge on the civil service pension arrangements.
In respect of the defined contribution schemes, DWP recognises the contributions payable for the year.
Read full information about civil service pension arrangements
For information regarding DWP’s Remploy pension scheme, please see note 18.
1.14. Leases
DWP account for leases under IFRS 16 (Leases) which sets out the principles for the recognition, measurement, presentation and disclosure of leases. The objective is to ensure that lessees and lessors provide relevant information in a manner that faithfully represents those transactions. This information gives a basis for users of financial statements to assess the effect that leases have on the financial position, financial performance and cash flows of an entity.
IFRS 16 (Leases) requires recognition of all qualifying leases on the balance sheet.
The result is the recognition of a right to use asset, measured at the present value of future lease payments, with a matching lease liability.
IFRS 16 (Leases) defines a lease as a contract that ‘conveys the right to control the use of an identified asset for a period of time in exchange for consideration.’ This definition applies both to lessees and lessors.
Therefore, in order to contain a lease, a contract must:
- depend on the use of an identified asset and
- provide the customer with the right to control the use of that identified asset
IFRS 16 (Leases) defines the lease term as the non-cancellable period for which a lessee has the right to use an underlying asset, together with both i) periods covered by an option to extend the lease if the lessee is reasonably certain to exercise that option; and ii) periods covered by an option to terminate the lease if the lessee is reasonably certain not to exercise that option.
Lease liability
The lease liability is initially measured at the present value of the lease payments that are not paid at the commencement date, discounted using the interest rate implicit in the lease, or if that cannot be readily determined, the rate provided by HM Treasury. The HM Treasury discount rates were 3.51% for leases entered into prior to 31 December 2023, or 4.72% after 1 January 2024.
The lease liability is measured at amortised cost using the effective interest method. It is re-measured when there is a change in future lease payments arising from a change in the index or rate, if there is a change in the Department’s estimates of the amount expected to be payable under a residual value guarantee, or if the Department changes its assessment of whether it will exercise a purchase, extension, or termination option.
Lease payments included in the measurement of the lease liability comprise the following:
- fixed payments, including in-substance fixed payments
- variable lease payments that depend on an index or a rate, initially measured using the index rate as at the commencement date
- amounts expected to be payable under a residual value guarantee
The exercise price under a purchase option that the Department is reasonably certain to exercise, lease payments in an optional renewal period if the Department is reasonably certain to exercise an extension option, and penalties for early termination of a lease unless the Department is reasonably certain not to terminate early.
When the lease liability is re-measured, a corresponding adjustment is made to the right of use asset or recorded in the SoCNE if the carrying amount of the right of use asset is zero.
DWP presents right of use assets that do not meet the definition of investment properties per IAS 40 as right of use assets on the SoFP. The lease liabilities are included within Lease liabilities within current and non-current liabilities on the SoFP.
Right of use asset
The right of use asset is initially measured at cost, which comprises the initial amount of the lease liability adjusted for initial direct costs, prepayments or incentives, and costs related to restoration at the end of a lease.
The right of use assets are subsequently measured at either fair value or current value in existing use in line with property, plant, and equipment assets. The cost measurement model in IFRS 16 (Leases) is used as an appropriate proxy for current value in existing use or fair value for the majority of leases (consistent with the principles for subsequent measurement of property, plant, and equipment) except for those which meet one of the following:
- a longer-term lease that has no provisions to update lease payments for market conditions or if there is a significant period of time between those updates; and;
- the fair value or current value in existing use of the underlying asset is likely to fluctuate significantly due to changes in market prices.
The right of use asset is depreciated using the straight-line method from the commencement date to the earlier of the end of the useful life of the right of use asset or the end of the lease term. The estimated useful lives of the right of use assets are determined on the same basis of those of property, plant and equipment assets.
DWP include an estimate of known costs to be incurred in dismantling and removing the underlying asset, restoring the site on which it is located or restoring the underlying asset to the condition required by the terms and conditions of the lease, unless those costs are incurred to produce inventories. The obligations for such costs are recognised and measured applying IAS 37 Provisions, Contingent Liabilities and Contingent Assets.
Exemptions
- short-term leases (leases where the term is less than 12 months)
- low value assets (leases where the underlying asset value is less than £5,000)
- intangible assets
- extension and termination options reasonably certain to be exercised
- variable lease payments based on an index or rate
Subleases
At the commencement of a lease where a sub-leasing arrangement is present and DWP is the intermediate lessor, DWP recognises a lease receivable at an amount equal to the net investment in the lease (IFRS 16.67). The net investment in the lease is the sum of the following (discounted using HM Treasury discount rates as default):
- the lease payments receivable by DWP; and
- any unguaranteed residual value
- residual value guarantees (a guarantee made to a lessor that the value [or part of the value] of an underlying asset at the end of a lease will be at least a specified amount)
- advance payments
- previously included non-lease/service components (where possible DWP have separated lease and service components [maintenance, security etc.] and have only capitalised amounts relating to lease components)
1.15. Contingent liabilities
DWP discloses contingent liabilities in accordance with IAS 37 (Provisions, Contingent Liabilities and Contingent Assets). They are valued using the best estimate of the expenditure required to settle the obligation where it is possible to do so.
DWP applies the same de minimis threshold for recognition of contingent liabilities associated with the social security benefits the Department administers as a provision, see note 1.12.
For some statutory and non-statutory contingent liabilities, the likelihood of transfer of economic benefits is remote. However, DWP discloses these for parliamentary reporting and accountability purposes in the Remote Contingent Liabilities section within the accountability report.
1.16. Grant in aid
Grants in aid to DWP’s arm’s length bodies are treated as expenditure in its SoCNE. In the accounts of the arm’s length bodies, these grants are treated as financing, and are credited to their reserves. Grants in aid are accounted for on a cash basis.
2. Statement of operating costs by operating segment
DWP’s operating segments are reported to their respective decision-making committees based on the expenditure type.
Statement of Outturn Against Parliamentary Supply (SOPS) and supporting notes reflect the net resource and capital outturn in line with the control totals voted by Parliament. The totals in the operating segments align with the SOPS.
DWP has two types of expenditure – Departmental Expenditure Limit (DEL) and Annually Managed Expenditure (AME).
DEL: spending which is generally within the Department’s control and managed in fixed multi-year limits. Some elements may be demand led.
DWP’s Investment Committee is the chief decision making body within the Department for DEL expenditure and receives updates on the monthly management accounts which are based on the Department’ss DEL operating segments and detail its spending and any financial issues the Committee needs to be aware of.
This year the Department has disclosed its DEL segments as:
Service Excellence – Retirement Services, Child Maintenance, Customer Experience, Service Transformation and Service Planning and Delivery.
Work and Health Services – this brings together Disability Services, Working Age and Universal Credit Operations in the Department. Incorporates Counter Fraud Compliance and Debt following transfer from Service Excellence.
Corporate functions as follows:
Finance Group – core finance: Strategy; Payment Systems; Planning; Security and Risk Management and Commercial and Contract Management and Partner Delivery. Also, included are health and employment programmes and grants, and the Department’s DEL spend for local authorities.
Digital Group – IT Contracts and digital services for colleagues and customers.
Policy Group – policy functions supporting DWP’s Ministers and DWP ET. Policy Group also supports ALB’s including Health and Safety Executive, the Money and Pensions Service, the Pension’s Regulator and the Pension Protection Fund.
People and Capability – core HR functions.
Corporate Transformation – corporate function incorporating Estates contract management and Synergy.
Other corporate functions (Communications; Central Analysis, Science, Ministers, Governance and Strategy).
Change – investment programmes and projects. In 2023 to 2024 the largest programmes were Universal Credit, Workplace Transformation, Health Transformation and Service Modernisation. Also included were Enhanced Customer Support, Universal Support and Synergy.
Arm’s length bodies – the expenditure incurred by the bodies within DWP’s accounting boundary.
| Expenditure | 2023 to 2024 £000 | 2022 to 2023 re-stated[footnote 81] £000 | 2022 to 2023 £000 |
|---|---|---|---|
| Service Excellence | 753,477 | 1,105,877 | 1,105,877 |
| Work and Health Services | 2,615,449 | 2,036,563 | 2,036,563 |
| Corporate: Finance Group (excluding CMPD) | 139,237 | 132,350 | 132,350 |
| Corporate: Contract Management and Partner Delivery (CMPD) | 2,222,701 | 2,261,786 | 2,261,786 |
| Corporate: Digital Group | 996,500 | 924,195 | 924,195 |
| Corporate: Policy Group | 166,649 | 232,667 | 232,667 |
| Corporate: People and Capability | 198,505 | 158,260 | – |
| Corporate: People Capability and Place | – | – | 1,353,199 |
| Corporate: Corporate Transformation | 1,360,971 | 1,194,939 | – |
| Corporate: Other corporate (Communications; Central Analysis, Science, Ministers, Governance and Strategy) | (29,176) | 45,977 | 45,977 |
| Corporate: Change and Resilience | 658,723 | 598,958 | 598,958 |
| Corporate: Arm’s Length Bodies | 506,001 | 454,147 | 454,147 |
| Total resource and capital DEL | 9,589,037 | 9,145,719 | 9,145,719 |
AME: spending which is generally less predictable and controllable than spending in DEL. This covers expenditure on benefits for welfare, pensions and Social Fund.
DWP’s AME expenditure is managed jointly by the Department for Work and Pensions and HM Treasury and reported to the AME Board which is instrumental in the AME decision making process. Additionally, AME expenditure is subject to review within the monthly departmental management accounts review meeting chaired by the Finance Director General. This forum was used in 2023 to 2024 to review and approve the Department’s AME strategy for Supply Estimates and subsequently reviewed AME forecasts versus the funding granted by Parliament.
| Total | 2023 to 2024 £000 | 2022 to 2023 £000 |
|---|---|---|
| Total resource and capital AME | 266,080,320 | 230,540,927 |
| Total resource and capital DEL and AME | 275,669,357 | 239,686,646 |
SOPS notes 1.1 and 1.2 provide details of resource and capital.
SOPS 2 reconciles SOPS resource to the Statement of Consolidated Net Expenditure.
This note does not include assets and liabilities, as they are not included in the management information that is provided to the Department’s boards.
The reconciling difference between the total of reportable segments’ net outturn (£275.7 billion, representing total resource and capital DEL and AME) to net expenditure shown in the SoCNE (£274.7 billion) is made up of (i) Total Capital Outturn (£0.8 billion) (ii) Other immaterial reconciling items (£0.2 billion).
3. Staff expenditure
| Expenditure | 2023 to 2024: Core Department £000 | 2023 to 2024: Departmental group £000 | 2022 to 2023: Core Department £000 | 2022 to 2023: Departmental group £000 |
|---|---|---|---|---|
| Wages and salaries | 2,839,828 | 3,080,207 | 2,597,988 | 2,816,266 |
| Employers’ National Insurance | 276,423 | 301,600 | 247,209 | 270,755 |
| Superannuation and pension costs | 669,252 | 720,959 | 625,423 | 673,352 |
| Total staff costs | 3,785,503 | 4,102,766 | 3,470,620 | 3,760,373 |
See the full staff and related expenditure disclosure in the remuneration and staff report.
4. Expenditure
| Purchase of goods and services | Note | 2023 to 2024: Core Department £000 | 2023 to 2024: Departmental group £000 | 2022 to 2023: Core Department £000 | 2022 to 2023: Departmental group £000 |
|---|---|---|---|---|---|
| Goods and services | – | 1,028,290 | 1,134,425 | 868,113 | 928,930 |
| Accommodation expenditure | – | 597,083 | 616,364 | 626,040 | 639,201 |
| IT services | – | 535,223 | 563,808 | 513,523 | 540,499 |
| Grant in aid | – | 507,344 | – | 440,422 | – |
| Other costs | – | 119,716 | 177,432 | 93,299 | 185,727 |
| Non-cash goods and services | 6 | 4,689 | 6,698 | 14,845 | 14,852 |
| Rentals costs | – | 1,797 | 2,050 | 4,791 | 4,812 |
| Agency payments on behalf of EU to third-parties | – | 540,439 | 540,439 | 556,958 | 556,958 |
| Audit fee | – | – | 299 | – | 261 |
| Non-audit services fee | – | 87 | 87 | 87 | 87 |
| Purchase of goods and services total | – | 3,334,668 | 3,041,602 | 3,118,078 | 2,871,327 |
| Finance expense: PFI service charges[footnote 82] | – | – | 27,826 | – | 12,869 |
| Finance expense: Lease charges | – | 15,440 | 21,251 | 11,987 | 17,811 |
| Total finance expense | – | 15,440 | 49,077 | 11,987 | 30,680 |
During the year the Department paid £87,360 for other audit services not relating to the statutory audit of these accounts. These services were to provide a non-statutory audit opinion to the Department on benefit expenditure recharged to Social Security Scotland in relation to devolved benefits administered by the Department under Agency Agreements. This opinion will be shared with Social Security Scotland.
The audit fee for the Department and its agencies of £1.7 million is shown in non-cash expenditure, see note 6.
5. Benefit and Social Fund expenditure
| Expenditure | Note | 2023 to 2024: Core Department £000 | 2023 to 2024: Departmental group £000 | 2022 to 2023: Core Department £000 | 2022 to 2023: Departmental group £000 |
|---|---|---|---|---|---|
| Voted expenditure | 5a | 133,564,101 | 133,564,101 | 114,614,086 | 114,614,086 |
| Non-voted expenditure | 5b | 129,856,181 | 129,856,181 | 115,097,546 | 115,097,546 |
| Social Fund expenditure[footnote 83] | – | 4,705,045 | 4,705,045 | 4,728,411 | 4,728,411 |
| Programme balances written off | – | 391,314 | 391,314 | 384,787 | 384,787 |
| Total | – | 268,516,641 | 268,516,641 | 234,824,830 | 234,824,830 |
5a. Voted expenditure
| Expenditure | 2023 to 2024: Core Department £000 | 2023 to 2024: Departmental group £000 | 2022 to 2023: Core Department £000 | 2022 to 2023: Departmental group £000 |
|---|---|---|---|---|
| Universal Credit | 51,771,738 | 51,771,738 | 42,556,701 | 42,556,701 |
| Personal Independence Payment | 21,688,359 | 21,688,359 | 17,430,389 | 17,430,389 |
| Amounts paid to local authorities | 16,385,857 | 16,385,857 | 16,111,245 | 16,111,245 |
| Employment and Support Allowance | 7,629,516 | 7,629,516 | 7,408,425 | 7,408,425 |
| Disability Living Allowance | 6,844,935 | 6,844,935 | 5,967,372 | 5,967,372 |
| Cost of Living Payment[footnote 83] | 7,790,417 | 7,790,417 | 5,665,483 | 5,665,483 |
| Attendance Allowance | 6,653,415 | 6,653,415 | 5,630,352 | 5,630,352 |
| Pension Credit | 5,409,928 | 5,409,928 | 4,858,644 | 4,858,644 |
| Carer’s Allowance | 3,711,255 | 3,711,255 | 3,264,970 | 3,264,970 |
| Statutory Sick Pay and Statutory Maternity Pay | 2,881,000 | 2,881,000 | 2,628,923 | 2,628,923 |
| Income Support | 649,030 | 649,030 | 698,078 | 698,078 |
| Industrial Injuries Benefits Scheme | 734,977 | 734,977 | 694,164 | 694,164 |
| Jobseeker’s Allowance | 149,285 | 149,285 | 199,982 | 199,982 |
| Employment Programmes – Kick Start[footnote 84] | (1,197) | (1,197) | 222,430 | 222,430 |
| Employment Programmes – Restart | 367,805 | 367,805 | 435,053 | 435,053 |
| Employment Programmes – Other | 418,019 | 418,019 | 392,698 | 392,698 |
| Severe Disablement Allowance | 56,155 | 56,155 | 57,642 | 57,642 |
| Other expenditure | 423,607 | 423,607 | 391,535 | 391,535 |
| Total | 133,564,101 | 133,564,101 | 114,614,086 | 114,614,086 |
5b. Non-voted expenditure (financed by the National Insurance Fund)
| Expenditure | 2023 to 2024: Core Department £000 | 2023 to 2024: Departmental group £000 | 2022 to 2023: Core Department £000 | 2022 to 2023: Departmental group £000 |
|---|---|---|---|---|
| State Pension | 123,912,730 | 123,912,730 | 109,570,914 | 109,570,914 |
| Employment and Support Allowance | 4,904,163 | 4,904,163 | 4,535,219 | 4,535,219 |
| Bereavement Benefits | 330,353 | 330,353 | 363,430 | 363,430 |
| Maternity Allowance | 412,038 | 412,038 | 389,691 | 389,691 |
| Christmas Bonus | 127,934 | 127,934 | 125,836 | 125,836 |
| Jobseeker’s Allowance | 168,377 | 168,377 | 111,876 | 111,876 |
| Incapacity Benefit | 586 | 586 | 580 | 580 |
| Total | 129,856,181 | 129,856,181 | 115,097,546 | 115,097,546 |
6. Non-cash expenditure
| Expediture | Note | 2023 to 2024: Core Department £000 | 2023 to 2024: Departmental group £000 | 2022 to 2023: Core Department £000 | 2022 to 2023: Departmental group £000 |
|---|---|---|---|---|---|
| Auditor’s remuneration | – | 1,691 | 1,691 | 1,587 | 1,587 |
| Loss on disposal of assets | – | 1,273 | 1,480 | 6,955 | 6,962 |
| Revaluation (gain)/loss | – | (41) | 1,761 | (163) | (163) |
| Movements on pension liability | – | 1,766 | 1,766 | 1,747 | 1,747 |
| ESF Foreign Exchange Loss | – | – | – | 4,719 | 4,719 |
| Sub-total | – | 4,689 | 6,698 | 14,845 | 14,852 |
| Depreciation and amortisation of non-current assets | 9 and 10 | 474,968 | 490,487 | 546,617 | 562,244 |
| Impairment of non-current assets | – | 69,805 | 69,876 | 12,027 | 12,027 |
| Movement in impairment of receivables[footnote 85] | 14 | 131,857 | 132,234 | (1,484,964) | (1,484,836) |
| Sub-total | – | 676,630 | 692,597 | (926,320) | (910,565) |
| Movement in provisions | 17 | (754,671) | (754,605) | (458,399) | (458,742) |
| Borrowing costs of provisions | 17 | 245,818 | 245,818 | 62,718 | 62,718 |
| Sub-total | – | (508,853) | (508,787) | (395,681) | (396,024) |
| Total | – | 172,466 | 190,508 | (1,307,156) | (1,291,737) |
ESF foreign exchange gains relate to the European Social Fund (ESF) 2014-20. The ESF programme has a net unrealised gain in 2023 to 2024 shown in note 7 income.
7. Income
| Expediture | 2023 to 2024: Core Department £000 | 2023 to 2024: Departmental group £000 | 2022 to 2023: Core Department £000 | 2022 to 2023: Departmental group £000 |
|---|---|---|---|---|
| HSE income | – | 110,601 | – | 89,347 |
| Pension levy receipts | 110,467 | 110,467 | 108,006 | 108,006 |
| EU income | 540,693 | 540,693 | 556,118 | 556,118 |
| Other income | 81,266 | 82,143 | 65,948 | 66,189 |
| Mesothelioma recoveries | 50,931 | 50,931 | 47,607 | 47,607 |
| Income from other government departments | 64,173 | 64,173 | 105,328 | 105,328 |
| CFER income | 22,389 | 22,389 | 18,013 | 18,013 |
| Total operating income | 869,919 | 981,397 | 901,020 | 990,608 |
| Investment income | 34,255 | 34,958 | 26,754 | 27,117 |
| ESF foreign exchange gain | 2,044 | 2,044 | – | – |
| Total financial income | 36,299 | 37,002 | 26,754 | 27,117 |
| Total income | 906,218 | 1,018,399 | 927,774 | 1,017,725 |
EU income relates to the European Social Fund (ESF) 2014 to 2020 programme which funds projects across the UK. The Department’s income from the EU is included within other income.
ESF foreign exchange gains relate to the European Social Fund (ESF) 2014 to 2020. The ESF programme has a net unrealised loss in 2022 to 2023 shown in note 6 non-cash expenditure.
Income from other government departments has reduced as Scottish claimant health assessment contracts migrate to Scottish Government.
8. Donated assets
| Asset | 2023 to 2024: Core Department £000 | 2023 to 2024: Departmental group £000 | 2022 to 2023: Core Department £000 | 2022 to 2023: Departmental group £000 |
|---|---|---|---|---|
| Gross Tax Credits transfer | (301,714) | (301,714) | (285,971) | (285,971) |
| Tax Credits transfer impairment | 149,315 | 149,315 | 151,794 | 151,794 |
| Total | (152,399) | (152,399) | (134,177) | (134,177) |
| Transfer of Assets | 3,948 | 3,948 | – | – |
| Total | 3,948 | 3,948 | – | – |
| Total Capital Grants in Kind | (148,451) | (148,451) | (134,177) | (134,177) |
In April 2016 the Department started to take on the debt associated with HM Revenue and Customs personal Tax Credits for customers who have made a claim to Universal Credit and have existing Tax Credits debt or have migrated from Tax Credits to Universal Credit. This was planned to continue to transfer over the coming years, as more customers move to Universal Credit.
Whilst DWP regularly agrees Tax Credits debt to transfer with HM Revenue and Customs, the amounts that are disclosed in the respective accounts may not agree due to timing differences. See note 1.11 for more information on Tax Credits receivables.
The transfer of assets relates to leasehold improvement works completed at Caxton House, management of this property has now been taken on by the Government Property Agency (GPA), which is an executive agency of the Cabinet Office
9. Property, plant and equipment
Consolidated property, plant and equipment
| Land and buildings £000 | Leasehold improvements £000 | Information Technology £000 | Plant and machinery £000 | Furniture and fittings £000 | Motor vehicles £000 | Payments on account and assets under construction £000 | Total | ||||||||||
|---|---|---|---|---|---|---|---|---|---|---|---|---|---|---|---|---|---|
| Cost or valuation: At 1 April 2023 | 1,166,377 | 521,781 | 412,588 | 33,201 | 66,905 | 885 | 155,818 | 2,357,555 | |||||||||
| Cost or valuation: IFRS 16 Adjustments | 1,295 | – | – | – | – | – | – | 1,295 | |||||||||
| Cost or valuation: Additions[footnote 86] | 278,319 | 914 | 21,838 | 8,573 | 1,587 | 43 | 212,515 | 523,789 | |||||||||
| Cost or valuation: Disposals | (36,365) | (210,435) | (185,561) | (8,042) | (2,049) 120 | – | (442,332) | ||||||||||
| Cost or valuation: Modifications | (86,168) | – | (978) | – | – | – | – | (87,146) | |||||||||
| Cost or valuation: Impairment | (23,969) | – | – | – | – | – | (22,833) | (46,802) | |||||||||
| Cost or valuation: Reclassifications | (77) | 62,976 | 629 | 27,338 | 460 | – | (93,901) | (2,575) | |||||||||
| Cost or valuation: Revaluations | (3,007) | – | – | – | – | – | – | (3,007) | |||||||||
| At 31 March 2024 | 1,296,405 | 375,236 | 248,516 | 61,070 | 66,903 | 1,048 | 251,599 | 2,300,777 | |||||||||
| Depreciation: At 1 April 2023 | 219,334 | 324,981 | 340,133 | 22,817 | 32,613 | 591 | – | 940,469 | |||||||||
| Depreciation: Charged in year | 206,804 | 117,148 | 52,536 | 10,805 | 6,601 | 74 | – | 393,968 | |||||||||
| Depreciation: Disposals | (33,757) | (206,388) | (185,381) | (6,982) | (2,004) | 120 | – | (434,392) | |||||||||
| Depreciation: Impairment | – | 21,718 | 72 | – | – | – | – | 21,790 | |||||||||
| Depreciation: Reclassification | (1) | – | – | 2 | 1 | (2) | – | – | |||||||||
| Depreciation: Revaluations | (3,446) | – | – | – | – | – | – | (3,446) | |||||||||
| At 31 March 2024 | 388,934 | 257,459 | 207,360 | 26,642 | 37,211 | 783 | 0 | 918,389 | |||||||||
| Carrying amount at 31 March 2023 | 947,043 | 196,800 | 72,455 | 10,384 | 34,292 | 294 | 155,818 | 1,417,086 | |||||||||
| Carrying amount at 31 March 2024 | 907,471 | 117,777 | 41,156 | 34,428 | 29,692 | 265 | 251,599 | 1,382,388 | |||||||||
| Asset financial: Owned | 10,417 | 117,777 | 30,078 | 30,793 | 28,634 | 265 | 251,599 | 469,563 | |||||||||
| Asset financial: Leased | 823,491 | – | 11,078 | 3,635 | – | – | – | 838,204 | |||||||||
| Asset financial: PFI contracts | 73,563 | – | – | – | 1,058 | – | – | 74,621 | |||||||||
| Carrying amount at 31 March 2024 | 907,471 | 117,777 | 41,156 | 34,428 | 29,692 | 265 | 251,599 | 1,382,388 | |||||||||
| Of the total: Department | 798,945 | 110,610 | 32,473 | 29,905 | 26,056 | 4 | 249,721 | 1,247,714 | |||||||||
| Of the total: Arm’s length bodies | 108,526 | 7,167 | 8,683 | 4,523 | 3,636 | 261 | 1,878 | 134,674 | |||||||||
| Carrying amount at 31 March 2024 | 907,471 | 117,777 | 41,156 | 34,428 | 29,692 | 265 | 251,599 | 1,382,388 | |||||||||
| Cost or valuation: At 1 April 2022 | 151,186 | 502,296 | 445,654 | 27,355 | 66,734 | 1,510 | 87,119 | 1,281,854 | |||||||||
| Cost or valuation: IFRS 16 Adjustments | 999,903 | – | – | 2,373 | – | – | – | 1,002,276 | |||||||||
| Cost or valuation: Additions | 59,439 | 7 | 16,685 | 2,150 | 495 | – | 92,244 | 171,020 | |||||||||
| Cost or valuation: Disposals | (33,718) | – | (49,414) | (637) | (324) | (625) | – | (84,718) | |||||||||
| Cost or valuation: Impairment | (7,325) | – | (106) | – | – | – | – | (7,431) | |||||||||
| Cost or valuation: Reclassifications | 20 | 19,478 | (231) | 1,960 | – | – | 23,545) | (2,318) | |||||||||
| Cost or valuation: Revaluations | (3,128) | – | – | – | – | – | – | (3,128) | |||||||||
| At 31 March 2023 | 1,166,377 | 521,781 | 412,588 | 33,201 | 66,905 | 885 | 155,818 | 2,357,555 | |||||||||
| Depreciation: At 1 April 2022 | 13,055 | 128,817 | 332,123 | 19,419 | 26,455 | 1,003 | – | 520,872 | |||||||||
| Depreciation: Charged in year | 208,819 | 196,164 | 57,243 | 3,463 | 6,482 | 98 | – | 472,269 | |||||||||
| Depreciation: Disposals | (2,540) | – | (49,233) | (65) | (324) | (510) | – | (52,672) | |||||||||
| At 31 March 2023 | 219,334 | 324,981 | 340,133 | 22,817 | 32,613 | 591 | – | 940,469 | |||||||||
| Carrying amount at 31 March 2022 | 138,131 | 373,479 | 113,531 | 7,936 | 40,279 | 507 | 87,119 | 760,982 | # Carrying amount at 31 March 2023 | 947,043 | 196,800 | 72,455 | 10,384 | 34,292 | 294 | 155,818 | 1,417,086 |
| Asset financing: Owned | 9,257 | 196,800 | 64,288 | 9,046 | 33,133 | 294 | 155,818 | 468,636 | |||||||||
| Asset financing: Finance leased | 862,777 | – | 8,167 | 1,338 | 1,159 | – | – | 873,441 | |||||||||
| Asset financing: PFI contracts | 75,009 | – | – | – | – | – | – | 75,009 | |||||||||
| Carrying amount at 31 March 2023 | 947,043 | 196,800 | 72,455 | 10,384 | 34,292 | 294 | 155,818 | 1,417,086 | |||||||||
| Department | 836,974 | 194,064 | 63,585 | 5,888 | 30,719 | 6 | 151,775 | 1,283,011 | |||||||||
| Arm’s length bodies | 110,069 | 2,736 | 8,870 | 4,496 | 3,573 | 288 | 4,043 | 134,075 | |||||||||
| Carrying amount at 31 March 2023 | 947,043 | 196,800 | 72,455 | 10,384 | 34,292 | 294 | 155,818 | 1,417,086 |
a. Right of use assets
The figures in the table below are included within the consolidated property, plant and equipment note above.
| Land and buildings £000 | Information Technology £000 | Plant and machinery £000 | Total £000 | |
|---|---|---|---|---|
| Cost or valuation: At 1 April 2023 | 1,071,232 | 8,826 | 2,024 | 1,082,082 |
| Cost or valuation: IFRS 16 Adjustments | 1,295 | – | – | 1,295 |
| Cost or valuation: Additions | 279,774 | 15,289 | 3,596 | 298,659 |
| Cost or valuation: Disposals | (36,364) | – | (930) | (37,294) |
| Cost or valuation: Modifications | (86,168) | (978) | – | (87,146) |
| Cost or valuation: Impairment | (23,969) | – | – | (23,969) |
| At 31 March 2024 | 1,205,800 | 23,137 | 4,690 | 1,233,627 |
| Depreciation: At 1 April 2023 | 215,327 | 982 | 496 | 216,805 |
| Depreciation: Charged in year | 201,804 | 11,078 | 916 | 213,798 |
| Depreciation: Disposals | (33,757) | – | (357) | (34,114) |
| At 31 March 2024 | 383,374 | 12,060 | 1,055 | 396,489 |
| Carrying amount at 31 March 2023 | 855,905 | 7,844 | 1,528 | 865,277 |
| Carrying amount at 31 March 2024 | 822,426 | 11,077 | 3,635 | 837,138 |
b. Cash flow reconciliation
| Cash flow | 2023 to 24 £000 | 2022 to 23 £000 |
|---|---|---|
| Capital payables and accruals at 1 April | 10,255 | 12,576 |
| Capital additions | 523,789 | 171,020 |
| Less: leased capital additions | (296,372) | (68,558) |
| Capital payables and accruals at 31 March | (39,113) | (10,255) |
| Purchases of property, plant and equipment as per Statement of Cash Flows | 198,559 | 104,783 |
| Department | 189,722 | 96,792 |
| Arm’s length bodies | 8,837 | 7,991 |
| Total | 198,559 | 104,783 |
10. Intangible assets
| Websites £000 | Purchased software licences £000 | Internally developed software £000 | Payments on assets under construction £000 | Total £000 | |
|---|---|---|---|---|---|
| Cost or valuation: At 1 April 2023 | 41,996 | 176,794 | 827,062 | 103,680 | 1,149,532 |
| Cost or valuation: Additions | 81 | 44,987 | 2,837 | 95,541 | 143,446 |
| Cost or valuation: Disposals | (41,196) | (87,421) | (128,933) | – | (257,550) |
| Cost or valuation: Impairments | – | (9) | – | (1,275) | (1,284) |
| Cost or valuation: Reclassifications | – | 1,833 | 28,806 | (57,587) | (26,948) |
| Cost or valuation: Revaluations | – | 1,335 | 81,124 | – | 82,459 |
| At 31 March 2024 | 881 | 137,519 | 810,896 | 140,359 | 1,089,655 |
| Amortisation: At 1 April 2023 | 41,877 | 136,502 | 487,848 | – | 666,227 |
| Charged in year | 74 | 31,212 | 65,233 | – | 96,519 |
| Amortisation: Disposals | (41,196) | (87,405) | (128,914) | – | (257,515) |
| Revaluations | – | 513 | 25,031 | – | 25,544 |
| At 31 March 2024 | 755 | 80,822 | 449,198 | – | 530,775 |
| Carrying amount at 31 March 2024 | 126 | 40,292 | 339,214 | 103,680 | 483,305 |
| Department | – | 43,578 | 355,867 | 118,063 | 517,508 |
| Arm’s length bodies | 126 | 13,119 | 5,831 | 22,296 | 41,372 |
| Carrying amount at 31 March 2024 | 126 | 56,697 | 361,698 | 140,359 | 558,880 |
| Cost or valuation: At 1 April 2022 | 39,516 | 162,479 | 780,047 | 59,669 | 1,041,711 |
| Cost or valuation: Additions | 89 | 20,367 | 2,616 | 99,364 | 122,436 |
| Cost or valuation: Disposals | – | (10,182) | (54,735) | (2,263) | (67,180) |
| Cost or valuation: Impairments | – | – | – | (4,596) | (4,596) |
| Cost or valuation: Reclassifications | – | 227 | 50,585 | (48,494) | 2,318 |
| Cost or valuation: Revaluations | 2,391 | 3,903 | 48,549 | – | 54,843 |
| At 31 March 2023 | 41,996 | 176,794 | 827,062 | 103,680 | 1,149,532 |
| Amortisation: At 1 April 2022 | 39,363 | 115,733 | 455,866 | – | 610,962 |
| Amortisation: Charged in year | 124 | 28,346 | 61,505 | – | 89,975 |
| Amortisation: Disposals | – | (10,182) | (54,675) | – | (64,857) |
| Amortisation: Revaluations | 2,390 | 2,605 | 25,152 | – | 30,147 |
| At 31 March 2023 | 41,877 | 136,502 | 487,848 | – | 666,227 |
| Carrying amount at 31 March 2023 | 119 | 40,292 | 339,214 | 103,680 | 483,305 |
| Carrying amount at 31 March 2022 | 153 | 46,746 | 324,181 | 59,669 | 430,749 |
| Department | – | 39,643 | 333,315 | 90,795 | 463,753 |
| Arm’s length bodies | 119 | 649 | 5,899 | 12,885 | 19,552 |
| Carrying amount at 31 March 2023 | 119 | 40,292 | 339,214 | 103,680 | 483,305 |
a. Intangible asset cash flow reconciliation
| Cash flow | 2023 to 2024 £000 | 2022 to 2023 £000 |
|---|---|---|
| Capital payables and accruals at 1 April | 9,686 | 10,281 |
| Capital additions | 143,446 | 122,436 |
| Capital payables and accruals at 31 March | (22,875) | (9,686) |
| Purchases of intangible assets as per Statement of Cash Flows | 130,257 | 123,031 |
| Department | 109,818 | 108,633 |
| Arm’s length bodies | 20,439 | 14,398 |
| Total | 130,257 | 123,031 |
11. Commitments under non-PFI leases
Leases
Total future minimum lease payments are given in the table below for each of the following periods:
| Obligations under lease for the following period comprise: | 31 March 2024: Core Department £000 | 31 March 2024: Departmental group £000 | 31 March 2023: Core Department £000 | 31 March 2023: Departmental group £000 |
|---|---|---|---|---|
| Buildings: Not later than one year | 209,546 | 213,446 | 193,168 | 199,269 |
| Buildings: Later than one year and not later than five years | 467,394 | 480,387 | 582,387 | 595,241 |
| Buildings: Later than five years | 361,368 | 375,725 | 334,371 | 348,896 |
| Total | 1,038,308 | 1,069,558 | 1,109,926 | 1,143,406 |
| Buildings: Less interest element | (78,988) | (85,583) | (70,146) | (76,809) |
| Buildings: Present value of obligations | 959,320 | 983,975 | 1,039,780 | 1,066,597 |
| Other: Not later than one year | 6,145 | 6,145 | 4,442 | 4,442 |
| Other: Later than one year and not later than five years | 9,460 | 9,460 | 6,770 | 6,770 |
| Other: Later than five years | – | – | – | – |
| Total | 15,605 | 15,605 | 11,212 | 11,212 |
| Less interest element | (565) | (565) | (72) | (72) |
| Present value of obligations | 15,040 | 15,040 | 11,140 | 11,140 |
12. Other financial commitments
The Department has entered into non-cancellable contracts (which are not leases, PFI contracts or other service concession arrangements), for the provision of goods and services. The payments to which the Department are committed are as follows.
| Other financial commitment | 31 March 2024: Core Department £000 | 31 March 2024: Departmental group £000 | 31 March 2023: Core Department £000 | 31 March 2023: Departmental group £000 |
|---|---|---|---|---|
| Not later than one year | 1,871,093 | 1,884,942 | 1,610,990 | 1,623,047 |
| Later than one year and not later than five years | 2,556,449 | 2,567,661 | 1,594,143 | 1,605,644 |
| Later than five years | 153,886 | 162,225 | 6,366 | 13,390 |
| Total | 4,581,428 | 4,614,828 | 3,211,499 | 3,242,081 |
Total commitments include some volume and/or results driven contracts where actual expenditure may be lower than the estimated commitment.
13. Cash and cash equivalents
| 31 March 2024: Core Department £000 | 31 March 2024: Departmental group £000 | 31 March 2023: Core Department £000 | 31 March 2023: Departmental group £000 | |
|---|---|---|---|---|
| Balances at 1 April | (1,211,956) | (1,202,889) | (1,093,666) | (1,092,564) |
| Net change in cash and cash equivalent balances | 5,375 | (1,466) | (118,290) | (110,325) |
| Balances at 31 March | (1,206,581) | (1,204,355) | (1,211,956) | (1,202,889) |
| Cash and cash equivalents | 379,949 | 382,251 | 982,565 | 991,742 |
| Bank overdraft | (1,586,530) | (1,586,606) | (2,194,521) | (2,194,631) |
| Total | (1,206,581) | (1,204,355) | (1,211,956) | (1,202,889) |
The following balances were held at:
| 31 March 2024: Core Department £000 | 31 March 2024: Departmental group £000 | 31 March 2023: Core Department £000 | 31 March 2023: Departmental group £000 | |
|---|---|---|---|---|
| Government Banking Services | (1,206,614) | (1,206,698) | (1,211,991) | (1,212,101) |
| Commercial banks and cash in hand | 33 | 2,343 | 35 | 9,212 |
| Total | (1,206,581) | (1,204,355) | (1,211,956) | (1,202,889) |
The bank overdraft relates to cash-in-transit due to a timing difference between the payment being processed and the date that customers are paid.
14. Trade receivables, financial and other assets
| Amounts falling due within one year | Note | 31 March 2024: Core Department £000 | 31 March 2024: Departmental group £000 | 31 March 2023: Core Department £000 | 31 March 2023: Departmental group £000 |
|---|---|---|---|---|---|
| Trade receivables | – | 167,749 | 198,218 | 276,056 | 302,694 |
| Benefit overpayments | – | 1,037,252 | 1,037,252 | 987,936 | 987,936 |
| Benefit advances | – | 694,086 | 694,086 | 654,291 | 654,291 |
| Housing Benefit subsidy | – | 369,114 | 369,114 | 385,184 | 385,184 |
| Prepayments and accrued income | – | 880,049 | 915,168 | 1,073,829 | 1,104,761 |
| Social Fund loans | – | 94,297 | 94,297 | 120,267 | 120,267 |
| Tax Credits | – | 337,144 | 337,144 | 367,487 | 367,487 |
| European Social Fund | – | 441,115 | 441,115 | 368,456 | 368,456 |
| Value Added Tax | – | 56,920 | 63,522 | 59,832 | 64,211 |
| CFERS receivable | – | 2,350 | 2,350 | 2,867 | 2,867 |
| Other receivables | – | 21,538 | 22,157 | 25,506 | 26,225 |
| Gross receivables | – | 4,101,614 | 4,174,423 | 4,321,711 | 4,384,379 |
| Less: impairment of receivables | 14a | (233,776) | (244,542) | (185,740) | (196,129) |
| Net receivables | – | 3,867,838 | 3,929,881 | 4,135,971 | 4,188,250 |
| Amounts falling due after more than one year | Note | 31 March 2024: Core Department £000 | 31 March 2024: Departmental group £000 | 31 March 2023: Core Department £000 | 31 March 2023: Departmental group £000 | |
|---|---|---|---|---|---|---|
| Trade receivables | – | 42,748 | 42,748 | – | – | |
| Benefit overpayments | – | 3,870,948 | 3,870,948 | 3,434,171 | 3,434,171 | |
| Benefit advances | – | 963,248 | 963,248 | 815,425 | 815,425 | |
| Loans and investments | – | 14b | 1,361,641 | 1,361,641 | 1,270,073 | 1,270,073 |
| Social Fund loans | – | 98,805 | 98,805 | 124,542 | 124,542 | |
| Tax Credits | – | 2,064,165 | 2,064,165 | 2,145,475 | 2,145,475 | |
| Prepayments and accrued income | – | – | 135 | – | 657 | |
| Other receivables | – | 126,324 | 128,429 | 135,329 | 136,836 | |
| Gross receivables | – | 8,527,879 | 8,530,119 | 7,925,015 | 7,927,179 | |
| Less: impairment of receivables | 14a | (1,770,104) | (1,770,104) | (1,537,382) | (1,537,382) | |
| Net receivables | – | 6,757,775 | 6,760,015 | 6,387,633 | 6,389,797 | |
| Total net receivables | – | 10,625,613 | 10,689,896 | 10,523,604 | 10,578,047 |
a. Impairment of receivables
| Impairment of receivables <1 year | 31 March 2024: Core Department £000 | 31 March 2024: Departmental group £000 | 31 March 2023: Core Department £000 | 31 March 2023: Departmental group £000 |
|---|---|---|---|---|
| Benefit overpayments | (192,986) | (192,986) | (130,365) | (130,365) |
| Tax Credits | (16,857) | (16,857) | (26,406) | (26,406) |
| Benefit advances | (5,511) | (5,511) | (4,084) | (4,084) |
| Social Fund | (5,774) | (5,774) | (8,712) | (8,712) |
| Other | (12,648) | (23,414) | (16,173) | (26,562) |
| Total | (233,776) | (244,542) | (185,740) | (196,129) |
Impairment of receivables – continued
| Impairment of receivables >1 year | 31 March 2024: Core Department £000 | 31 March 2024: Departmental group £000 | 31 March 2023: Core Department £000 | 31 March 2023: Departmental group £000 |
|---|---|---|---|---|
| Benefit overpayments | (988,568) | (988,568) | (870,974) | (870,974) |
| Tax Credits | (545,593) | (545,593) | (490,023) | (490,023) |
| Benefit advances | (159,473) | (159,473) | (104,971) | (104,971) |
| Social Fund | (43,631) | (43,631) | (44,967) | (44,967) |
| Other | (32,839) | (32,839) | (26,447) | (26,447) |
| Total | (1,770,104) | (1,770,104) | (1,537,382) | (1,537,382) |
DWP’sImpairment measurement approach reflects its experience of recovering a developing portfolio of debts. For the most significant benefit related financial instruments (benefit overpayments, benefit advances and Tax Credits) the following table provides a reconciliation of the movements in impairment from March 2023 to March 2024.
| Movement in impairment due to | Benefit overpayments (excluding Universal Credit) £000 | Benefit overpayment – Universal Credit £000 | Benefit Advances £000 | Tax Credit £000 | Social Fund Loans £000 | Total £000 |
|---|---|---|---|---|---|---|
| Impairment at 1 April 2023 | (799,054) | (202,285) | (109,055) | (516,429) | (53,679) | (1,680,502) |
| Impairment of debts recognised in 2023 to 2024 | (198,192) | (37,942) | (43,889) | (39,094) | (61,345) | (380,462) |
| Reduction in level of debts written off | 89,455 | 669 | 259 | 3,020 | 10,493 | 103,896 |
| Increase in level of debt recoveries and other movements | 111,993 | 16,798 | 36,527 | 50,541 | 61,007 | 276,866 |
| Change in rate utilised | (31,352) | (69,007) | (31,631) | (58,205) | (11,440) | (201,635) |
| Change in Discount Rate utilised | (6,546) | (56,091) | (17,195) | (2,283) | 5,559 | (76,556) |
| Impairment at 31 March 2024 | (833,696) | (347,858) | (164,984) | (562,450) | (49,405) | (1,958,393) |
The Department continues to:
Review historic rates of debt recovery and write-off to estimate future Expected Credit Loss.
Apply a discount rate provided by HM Treasury to future recoveries.
Group debts by benefit and age within the model.
Annually consider forward-looking events in determining Expected Credit Loss.
The potential impact of wider economic and social factors on future recoveries is assessed by exploring the relationship between recoveries and the following indicators: inflation, interest rates, unemployment rate, and mortality rate. Based on the latest analysis, theDepartment is satisfied that historic rates provide the most reliable estimate for future impairment.
b. Financial assets
DWP’s financial assets of £1.4 billion consist of loans to organisations within its departmental family, and Support for Mortgage Interest loans.
National Employment Savings Trust Corporation (NEST)
This loan provides ongoing funding to NEST Corporation for the administration and operation of the NEST pension scheme. The scheme’s income and assets under management continue to grow, as scheme membership increases, and will eventually be sufficient to fund NEST Corporation’s ongoing costs and repay the loan. DWP loaned a further £63 million to NEST in 2023 to 2024 (2022 to 2023: £138 million), bringing the total loan balance to £1.195 billion (2022 to 2023: £1.132 billion). NEST will begin repayment of the loan from 2024 to 2025 and is expected to be fully repaid by January 2038.
Office for Nuclear Regulation (ONR)
The Department has provided the ONR with a working capital loan and a short-term loan facility to provide them with adequate working capital to discharge their statutory obligations. The amount outstanding is £9.9 million (2022 to 2023: £11.4 million).
Support for Mortgage Interest (SMI)
The value of SMI loans now stands at £156.7 million (2022 to 2023: £126.6 million).
15. Trade payables and other liabilities
| Amounts falling due within one year | 31 March 2024: Core Department £000 | 31 March 2024: Departmental group £000 | 31 March 2023: Core Department £000 | 31 March 2023: Departmental group £000 | |
|---|---|---|---|---|---|
| Taxation and social security | – | 64,262 | 69,349 | 55,851 | 61,308 |
| Superannuation | – | 69,993 | 74,963 | 61,665 | 66,814 |
| Trade payables | – | 182,379 | 191,346 | 205,181 | 224,108 |
| Accruals and deferred income | – | 8,368,404 | 8,417,885 | 6,925,181 | 6,976,720 |
| Capital payables and accruals | 9,10 | 41,867 | 48,716 | 12,851 | 15,181 |
| Bank overdrafts | 13 | 1,586,530 | 1,586,606 | 2,194,521 | 2,194,631 |
| Imputed finance lease element of on-Statement of Financial Position PFI contracts | – | 3,832 | – | 3,685 | |
| Lease obligations | – | 197,494 | 200,851 | 185,040 | 189,961 |
| CFERs due to be paid to the Consolidated Fund – Received | – | 8,491 | 8,491 | 6,013 | 6,013 |
| CFERs due to be paid to the Consolidated Fund – Receivable | – | 2,350 | 2,350 | 2,867 | 2,867 |
| Amounts issued from the Consolidated Fund for supply but not spent at year end | – | 88,583 | 88,583 | 33,427 | 33,427 |
| Third-party payments | – | 48,795 | 48,795 | 43,202 | 43,202 |
| European Social Fund | – | 59,626 | 59,626 | 61,307 | 61,307 |
| Other payables | – | 65,138 | 64,607 | 92,346 | 92,668 |
| Total | – | 10,783,912 | 10,866,000 | 9,879,452 | 9,971,892 |
| Amounts falling due after more than one year | 31 March 2024: Core Department £000 | 31 March 2024: Departmental group £000 | 31 March 2023: Core Department £000 | 31 March 2023: Departmental group £000 | |
|---|---|---|---|---|---|
| Imputed finance lease element of on-Statement of Financial Position PFI contracts | – | – | 67,226 | – | 71,058 |
| Lease obligations | – | 777,182 | 798,482 | 865,880 | 887,776 |
| European Social Fund | – | 164,322 | 164,322 | 172,269 | 172,269 |
| Accruals and Deferred Income | – | 1,446 | 1,446 | 1,845 | 1,845 |
| Capital Accruals | 9,10 | 13,272 | 13,272 | 4,760 | 4,760 |
| Sub-total | – | 956,222 | 1,044,748 | 1,044,754 | 1,137,708 |
| Total payables | – | 11,740,134 | 11,910,748 | 10,924,206 | 11,109,600 |
16. Financial instruments
DWP’s financial instruments include loans and receivables.
| Financial assets | Note | 31 March 2024: Core Department £000 | 31 March 2024: Departmental group £000 | 31 March 2023: Core Department £000 | 31 March 2023: Departmental group £000 |
|---|---|---|---|---|---|
| Loans and investments | 14 | 1,361,641 | 1,361,641 | 1,270,073 | 1,270,073 |
| Benefit advances | 14 | 1,657,334 | 1,657,334 | 1,469,716 | 1,469,716 |
| Other receivables | – | 227,324 | 258,214 | 296,568 | 323,668 |
| Cash and cash equivalents | 13 | 379,949 | 382,251 | 982,565 | 991,742 |
| Housing Benefit subsidy | 14 | 369,114 | 369,114 | 385,184 | 385,184 |
| Benefit overpayments | 14 | 4,908,200 | 4,908,200 | 4,422,107 | 4,422,107 |
| Tax Credits | 14 | 2,401,309 | 2,401,309 | 2,512,962 | 2,512,962 |
| Social Fund loans | 14 | 193,102 | 193,102 | 244,809 | 244,809 |
| European Social Fund | 14 | 441,115 | 441,115 | 368,456 | 368,456 |
| Total | – | 11,939,088 | 11,972,280 | 11,952,440 | 11,988,717 |
| Less: impairment of financial instruments | – | (2,003,880) | (2,014,646) | (1,723,122) | (1,733,511) |
| Sub-total | – | 9,935,208 | 9,957,634 | 10,229,318 | 10,255,206 |
| Financial liabilities | Note | 31 March 2024: Core Department £000 | 31 March 2024: Departmental group £000 | 31 March 2023: Core Department £000 | 31 March 2023: Departmental group £000 |
|---|---|---|---|---|---|
| Other payables[footnote 87] | 15 | 9,582,044 | 9,671,998 | 8,194,133 | 8,293,747 |
| Bank overdraft | 13 | 1,586,530 | 1,586,606 | 2,194,521 | 2,194,631 |
| European Social Fund | 15 | 223,948 | 223,948 | 233,576 | 233,576 |
| Total | 11,392,522 | 11,482,552 | 10,622,230 | 10,721,954 |
Fair value
The carrying value of trade receivables and payables less impairment is assumed to approximate their fair value. The book values of DWP’s financial assets and liabilities at 31 March 2024 aren’t materially different from their fair values, so are not shown separately.
Exposure to risks
There are no material liquidity, market and credit risks associated with DWP’s financial instruments.
17. Provisions for liabilities and charges
| Provision | Note | 31 March 2024: Core Department £000 | 31 March 2024: Departmental group £000 | 31 March 2023: Core Department £000 | 31 March 2023: Departmental group £000 |
|---|---|---|---|---|---|
| Financial Assistance Scheme (FAS) provision | 17a | 3,830,144 | 3,830,144 | 4,349,512 | 4,349,512 |
| Benefit provisions | 17b | 755,672 | 755,672 | 1,163,536 | 1,163,536 |
| State Pension | 17c | 368,621 | 368,621 | 835,039 | 835,039 |
| Home Responsibilities Protection (HRP) | 17d | 1,152,624 | 1,152,624 | 1,043,245 | 1,043,245 |
| Other provisions | 17e | 103,723 | 104,394 | 55,930 | 57,136 |
| Sub-total | 6,210,784 | 6,211,455 | 7,447,262 | 7,448,468 |
Analysis by type
a. FAS provision
| FAS provision (a) | 31 March 2024: Core Department £000 | 31 March 2024: Departmental group £000 | 31 March 2023: Core Department £000 | 31 March 2023: Departmental group £000 |
|---|---|---|---|---|
| Balance at 1 April | 4,349,512 | 4,349,512 | 6,254,247 | 6,254,247 |
| Provided in year | 100,093 | 100,093 | 44,477 | 44,477 |
| Provisions not required written back | – | – | – | – |
| Change in discount rate | (520,770) | (520,770) | (1,764,581) | (1,764,581) |
| Utilised in year | (248,511) | (248,511) | (240,740) | (240,740) |
| Borrowing costs (unwinding of discount) | 149,820 | 149,820 | 56,109 | 56,109 |
| Balance at 31 March | 3,830,144 | 3,830,144 | 4,349,512 | 4,349,512 |
The Financial Assistance Scheme (FAS) provides assistance to members of defined benefit occupational pension schemes that were wound up under-funded when their employers became insolvent during the period 1 January 1997 to 5 April 2005.
The FAS provision has been created to fund the liabilities arising from those qualifying schemes once the assets from such schemes have transferred to government. The provision is an estimate of the current liability required to make payments to pensioners under the FAS scheme.
The provision is calculated by using a long-term cash forecast model provided by Pension Protection Fund (PPF) who manage the administration of FAS. The cash flows are then discounted, at rates provided by HM Treasury, to give their present value at the year end.
The long-term cash forecast provided by PPF includes actuarial assumptions such as future rates of price inflation, potential life span and ill health of scheme members as well as adjustments to reflect the impact of legal judgements where they may affect the payments made to pensioners under the scheme. Some members benefits have already been uplifted to reflect the outcome of various legal judgements, and their revised benefits are included in the data. Approximate loadings (expressed as a fixed multiple of the cashflows) are applied for the estimated impact where the actual impact is not yet included in the data or is not yet known (explained in more detail below).
Movement in provision from prior year (2022 to 2023)
Movement from prior year of £0.5 billion (reduction) is due to increased discount rates as issued by HM Treasury, partially offset by higher cashflow projections relating to forecasted increased allowances for the Hampshire Judgement and marginally higher inflation assumptions.
Sensitivities for 2023 to 2024
The FAS provision is long-term and is therefore more sensitive to changes in economic and demographic conditions.
The table below sets out a sensitivity analysis for the most significant assumptions used to estimate the FAS provision. It illustrates the potential impact of changes in assumptions on the value of the provision.
| Original £ million | Discount rate £ million | Mortality rate £ million | Pension payments £ million | Deferred pension revaluation rate £ million | |
|---|---|---|---|---|---|
| Assumption | – | 0.5% decrease | 10% increase p.a. | 0.5% increase p.a. | 0.5% increase p.a. |
| Provision as at 31 March 2024 | 3,830 | 4,045 | 3,731 | 3,896 | 3,873 |
| Increase/(decrease) in provision | – | 215 | (99) | 66 | 43 |
| Percentage change | – | 5.61% | (2.58%) | 1.72% | 1.12% |
Original – This is the actual FAS provision which has been posted into DWP’s accounts and is used as the “baseline” position for the other scenarios. Discount rate decrease – This scenario assumes that cash flows remain the same and only the discount rates (as advised by HM Treasury) change (decrease of 0.5%). The impact would create an increase in the provision of £215 million (5.61%).
Mortality increase – The assumption in this scenario is that there is a 10% increase to the mortality rates after allowing for projected mortality improvements, rather than applying the 10% increase to the current mortality rate. This has the impact of reducing the amount of cash flows as pensioner numbers reduce – creating a £99 million (2.58%) reduction in the provision.
Pension increase – This scenario assumes that pensions will increase by 0.5% per annum for all future years where the actual rates are not yet known. Where the actual rates are known then these actual rates have been used. This has the impact of increasing the amount of cash flows – generating a £66 million (1.72%) increase in the provision.
Deferred revaluation increase – The assumption in this scenario is that there is a change to the revaluation rate in deferment of people’s pensions and this will increase by 0.5% per annum for all future years where the actual rates are not yet known. Where the actual rates are known then these actual rates have been used. This has the impact of increasing the amount of cash flows – causing a £43 million (1.12%) increase in the provision.
There are other assumptions included in the cash flows which are not considered to be significant. These include the age difference between male and female survivors and the original member; the proportion that are married and potential impacts of ill health.
Legal Cases
There have been a number of legal challenges to pension entitlements in recent years. Where relevant to the FAS, these are reflected in the assumptions which underpin the cash flow. This includes allowances for judgements made in the ‘Hampshire’, ‘Hughes’ and ‘Bauer’ cases.
The Hampshire Judgement - In September 2018 the Court of Justice of the European Union (CJEU) ruled in the case of Hampshire v PPF that, in the event of employer insolvency, individual members should receive at least 50% of the value of their accrued old age pension in their former scheme.
The adjustments for the Hampshire judgement in the cashflow projections are made partly through updated membership data, as uplifts have already been applied for some members. In addition, where uplifts are yet to be applied, PPF have calculated approximate Hampshire loadings by looking at the total remaining uplifts to be implemented as a proportion of the total benefits in payment (for in-payment members) or the total deferred benefits at the calculation date (for not-in-payment members). The Hampshire adjustments are higher than last time.
The Hughes Judgement – In June 2020 the Administrative Court ruled in the case of Hughes v PPF that in calculating the minimum 50% value the PPF needs to make sure that over the course of their lifetime each member, and separately each survivor, receives at least 50% on a cumulative basis of the actual value of the benefits that their scheme would have provided.
As part of the further Hughes judgement, it was judged that the PPF compensation cap, in its current form, is age discriminatory and should be removed. As agreed with DWP, PPF assume that the FAS cap remains unchanged but this should be kept under review for future exercises.
The Bauer Judgement - In December 2019 the CJEU ruled in the case of ‘Bauer’ that a reduction in the amount of occupational old age pension benefits paid to a member on account of his or her employer’s insolvency is manifestly disproportionate where, as a result of the reduction, the member is living below the at-risk-of-poverty threshold determined by Eurostat.
The Bauer adjustments are made entirely through loadings and is necessarily approximate as PPF do not have access to all the data needed to make an accurate adjustment, nor has an agreed implementation approach been decided by DWP and PPF. The methodology for calculating the Bauer impact on PPF members (on which the FAS methodology is based) has not changed since last time and no updated figures have been calculated. Therefore, PPF have used the same Bauer loadings as last time. This allowance may be refined in future as more information and an agreed approach becomes available. Arrears may also be payable in respect of Bauer, which are not included in the projected cashflows.
Hampshire Judgement Further Detail
Hampshire calculations have now been completed for the vast majority of FAS members but not all uplifts had been implemented by 30 November 2023 (the date of the data extract), therefore the loading factors are now based on actual uplifts that will be paid to FAS members after 30 November 2023.
PPF have calculated the Hampshire loadings by looking at the total uplifts yet to be applied as a proportion of the total benefits in payment (for in-payment members) or the total deferred benefits at the calculation date (for not-in-payment members). The resulting loadings are 1.006 for in-payment members and 1.007 for not-in-payment members.
The uplifts are higher than the loadings applied previously (1.001 for in-payment members and 1.003 for not-in-payment members) partly because the actual benefits provided to FAS members by their former pension schemes (for example pension increases) differed to PPF assumptions. The loadings the Department had used were very approximate and largely based on analysis for PPF (rather than FAS) members.
Work on the remaining members is underway, and PPF expect the remaining Hampshire uplifts to be implemented in FY 2024 to 2025 (i.e. by 31 March 2025). Therefore, DWP does not expect there to be any Hampshire loading applied in next year’s PPF report.
In addition, arrears are payable to in-payment members who are due an uplift. Around £16 million of arrears had been paid by 31 March 2023 (£11 million by 31 March 2022 and £5 million in FY 2022 to 2023). A further £10 million of arrears was paid in FY 2023 to 2024 and a further £6 million of arrears is expected to be paid in FY 2024 to 2025. These amounts are not included in the PPF cashflow projections.
Bauer Judgement Further Detail
The Bauer allowance is necessarily approximate as PPF do not have access to all the data needed in order to make an accurate adjustment, nor has an agreed implementation approach been decided by DWP and PPF. The methodology for calculating the Bauer impact on PPF members (and hence FAS members) has not changed since last year and no updated figures have been calculated.
In addition, the Bauer judgement only applies to FAS schemes where the employer was insolvent when the scheme started to wind up. PPF made an adjustment to the Bauer loading factors based on the proportion of FAS assistance which relates to members of schemes whose employer was insolvent. This proportion has not changed significantly over the year.
PPF also adjusted the Bauer loading factors to reflect that some FAS members receive external annuities from insurance companies, so while PPF estimate that total FAS assistance will increase by the same multiple as PPF compensation (subject to the other adjustments outlined above), the amount payable by FAS will increase more (as the external annuities will not change).
Therefore PPF have used the same Bauer loadings as last time (1.008 for in-payment members and 1.017 for not-in-payment members).
‘Shape’ of the additional liabilities for Hampshire and Bauer judgements
For simplicity, PPF have assumed that the loadings for Hampshire and Bauer (for in-payment and not-in-payment members) apply evenly each year. However, this is a simplification in terms of the ‘shape’ of the individual cashflows. In reality, the impact would be larger in some years than others.
The Department would not expect this limitation to have a material impact on the final liability figures calculated and used, but it may mean the later years cashflow projections are slightly understated, with earlier year projections slightly overstated.
b. Benefit provisions
| Benefit provisions (b) | 31 March 2024: Core Department £000 | 31 March 2024: Departmental group £000 | 31 March 2023: Core Department £000 | 31 March 2023: Departmental group £000 |
|---|---|---|---|---|
| Balance at 1 April | 1,163,536 | 1,163,536 | 952,298 | 952,298 |
| Provided in year | 136,904 | 136,904 | 498,933 | 498,933 |
| Provisions not required written back | (315,621) | (315,621) | (560) | (560) |
| Utilised in year | (252,338) | (252,338) | (289,114) | (289,114) |
| Borrowing costs (unwinding of discount) | 23,191 | 23,191 | 1,979 | 1,979 |
| Balance at 31 March | 755,672 | 755,672 | 1,163,536 | 1,163,536 |
These provisions arise from liabilities relating to benefit payments. These liabilities are in respect of:
Legal cases
In the course of administering a complex benefit system across Great Britain it is inevitable that the Department will face legal challenge, which may result in liabilities. Where future economic outflow is probable, but the final verdict has not been heard, DWP has estimated a provision. In order to avoid prejudicing continuing legal matters, separate disclosure is not provided. In aggregate DWP considers £279 million to be its best estimate.
Legal Entitlement and Administrative Practice (LEAP) Exercises
DWP is continuously learning and improving but from time to time, it becomes aware of situations where customers have not been paid the right amount of money. This could be because of an official error or as a result of a court ruling which widens benefit entitlement. In these circumstances it is necessary to conduct a LEAP exercise to correct customer underpayments. In aggregate DWP considers £301 million to be its best estimate.
ESA SDP Corrective Exercise
Some income-related ESA claimants should receive an additional element called a Severe Disability Premium if they are eligible. A claimant cannot apply for these as they are part of the benefit. To enable payment, claimants are required to provide up-to-date information that the Department requests on their individual circumstances. As a result of a combination of information not being provided, not being held and the Department not effectively assessing entitlement, some customers have missed out on additional premiums alongside their benefit award. The Department is currently working to correct existing errors on live premia cases. The estimated value of underpayments existing on live claims at 31 March is £175 million.
Benefit provisions are estimated using detailed forecasting data and established methodology.
This section excludes DWP’s provision for State Pension underpayments which, although a benefit provision, merits separate disclosures in Note 17c and Note 17d due to its materiality and likely interest to readers of the accounts.
c. State Pension Underpayment provision
| State Pension Underpayment provision (c) | 31 March 2024: Core Department £000 | 31 March 2024: Departmental group £000 | 31 March 2023: Core Department £000 | 31 March 2023: Departmental group £000 |
|---|---|---|---|---|
| Balance at 1 April | 835,039 | 835,039 | 1,349,073 | 1,349,073 |
| Provided in year | 26,662 | 26,662 | 138,767 | 138,767 |
| Provisions not required written back | (228,965) | (228,965) | (439,106) | (439,106) |
| Utilised in year | (270,317) | (270,317) | (218,230) | (218,230) |
| Borrowing costs (unwinding of discount) | 6,202 | 6,202 | 4,535 | 4,535 |
| Balance at 31 March | 368,621 | 368,621 | 835,039 | 835,039 |
Background
The Department commenced a formal Legal Entitlements and Administrative Practices (LEAP) exercise in January 2021 to address State Pension cases where people were being underpaid – specifically some people married or in a civil partnership (Category BL), widows (Missed Conversions) and people aged 80 years and over (Category D). Correcting these underpayments remains a key priority for the Department. The CAT D and CAT BL exercises have completed. The estimated outstanding provision is for the Missed Conversion (widows) category only.
Significant progress has been made by the Department over the past year to refine the information and assumptions that the provision is based on. The provision is prepared using:
- Baseline scan information from the Pension Strategy Computer System (PSCS) and the General Matching Service (GMS)
- Sampling of pensioners and reviewing their current entitlement for underpayment
- Actual data from the correction activity
As with any LEAP exercise, the estimate contains significant uncertainty and will continue to be refined as further information becomes available, with the final value of underpayments only being confirmed once the LEAP exercise has been completed.
Methodology and data
The methodological approach for estimating Missed Conversions provisions is similar to last year.
The Department has estimated the value of this provision using the best available data it held as at the end of March 2024.
The extrapolation of a sample to a whole population is subject to statistical uncertainty, with a confidence interval around the central estimate. The Missed Conversions sample data has been supplemented with actual data from the cases being worked through the ongoing LEAP exercise.
The arrears value is adjusted for the expected timing of clearances, so that the final value accounts for any additional arrears which may accrue up to the point of correction.
Sample
The Department has conducted a sample of 1,500 individuals from the Missed Conversions PSCS scan. It was run between April 2021 and September 2022. The sample informed the estimated provision last year but has been updated for the latest estimate.
Further spouse tracing success
The Department wrote out to approximately 159,000 individuals being reviewed for potential Category BL underpayment. The letters asked for more information about their spouse to enable a review of their award. The response rates for this exercise have been used to estimate the Missed Conversions exercise, where approximately 49,000 letters will be sent out to seek further spouse information.
No liability is included for customers where the Department does not hold sufficient information after attempting to trace the spouse.
PSCS refinement
The Department has also refined the PSCS scan to ensure only individuals needing review are being reviewed.
Value and volume estimate
The Department estimates that approximately 55,000 widows (missed conversions) have been underpaid. This latest estimate is a reduction from 64,000 underpayments reported last year. This fall is due to a combination of factors, most notably:
1. The response rate to the Category BL further spouse tracing exercise which have been used to inform the Missed Conversions estimates.
2. Further work refining the volume of individuals needing a review.
The total undiscounted provision is estimated to be £369 million, a reduction in the provision for Missed Conversions of £136 million from last year. Since last year the Department has paid out £160 million in missed conversion arrears.
Table 1 – Value and volume estimates
| Value of Provision of Unpaid Arrears as at 31 March 2024 £million | Remaining volume of customers affected as at 31 March 2024 000’s | Value of Provision of Unpaid Arrears as at 31 March 2023 £million | Remaining volume of customers affected as at 31 March 2023 000’s | |
|---|---|---|---|---|
| Missed Conversions | 369 | 33 | 505 | 54 |
In total the Department estimates it underpaid £650 million (arrears only) to 55,000 pensioners for the Missed Conversions category of the SPU LEAP exercise.
When calculating any arrears owed in State Pension, the case is also reviewed to identify where an individual may have been overpaid any other benefit because of now receiving their correct State Pensions entitlement. Arrears values reported are net of any abatement of overpaid benefits.
Uncertainties and sensitivity analysis
The sensitivity analysis is conducted using Monte Carlo analysis. This statistical method allows DWP to simultaneously randomly vary the most uncertain assumptions between a low and high range and measure the total impact. By running 1,000 scenarios the Department can get a range of outputs that shows the range of uncertainty/variation built into the modelling.
The outputs of the Monte Carlo are sensitive to the chosen low and high assumptions.
DWP’s central assumptions are based on the best available evidence. Low and high ranges are based on three methods:
- where sufficient LEAP data exists, using evidence gained whilst clearing actual cases during the LEAP exercise.
- where sufficient LEAP exercise data does not exist, using statistical data available to the Department that is regularly extracted as part of the Work and Pensions Longitudinal Study.
- where limited or no evidence is available, internal DWP stakeholders agreed logic-based assumptions have been used.
Only the assumptions with the highest degree of uncertainty are included in the sensitivity analysis.
Table 1: High and low assumptions
| Assumptions | Low | Central | High |
|---|---|---|---|
| Traceability of Next of Kin | 23% | 62% | 92% |
| Traceability of Alive at scan | 75% | 99% | 100% |
| Mortality | 12% | 9% | 6% |
| Rate of underpayment | 85% | 100% | 115% |
| Average arrears | 85% | 100% | 115% |
| Letter Response rate – GB Alive | 4.5% | 28% | 45% |
| Letter Response rate – IG Alive | 4.5% | 30% | 45% |
| Letter Response rate – GB Dead | 4.5% | 23% | 45% |
| Letter Response rate - IG Dead | 4.5% | 16% | 45% |
A higher mortality rate leads to a lower expenditure forecast as an individual with an increased ongoing State Pension award will cease at death.
The assumptions that have the greatest impact on the forecast are the rate of underpayment and average arrears.
Results
The 1,000 simulations produced by the Monte Carlo allows the Department to summarise the uncertainty in the forecast.
Table 2: Sensitivity analysis results – total arrears
| Sensitivity Analysis | Low | Central | High | Min | Max |
|---|---|---|---|---|---|
| MC | £537 million | £650 million | £741 million | £413 million | £894 million |
The low and high estimates show the range within which the Department can be 95% confident the final value will fall between.
The min and max estimates are if all the assumptions are equal to their minimum and maximum value at the same time, respectively.
d. Home Responsibilities Protection provision
| Home Responsibilities Protection (d) | 31 March 2024: Core Department £000 | 31 March 2024: Departmental group £000 | 31 March 2023: Core Department £000 | 31 March 2023: Departmental group £000 |
|---|---|---|---|---|
| Balance at 1 April | 1,043,245 | 1,043,245 | – | – |
| Provided in year | 45,145 | 45,145 | 1,043,245 | 1,043,245 |
| Provisions not required written back | – | – | – | – |
| Utilised in year | (2,195) | (2,195) | – | – |
| Borrowing costs (unwinding of discount) | 66,429 | 66,429 | – | – |
| Balance at 31 March | 1,152,624 | 1,152,624 | 1,043,245 | 1,043,245 |
Missing Home Responsibilities Protection (HRP) Provision
Home Responsibilities Protection (HRP) was available between 1978 and 2010 for people in receipt of Child Benefit and those caring for sick and disabled people.
The value of the provision reflects DWP’s current estimate of the amount that will be paid out to correct State Pension underpayments due to missing Home Responsibilities Protection (HRP). The HRP underpayment exercise is complex, requiring first HM Revenue and Customs to correct the National Insurance records and then DWP to correct State Pension entitlement. As with any corrective activity, this estimate is subject to significant uncertainty which will continue to be refined as further information becomes available, with the final value of underpayments only being confirmed once the exercise has been completed.
The final value of the missing HRP provision could range from £520 million to £1,220 million. This range is driven by uncertainty surrounding the value of underpayments and the volume of cases that will be corrected.
Value and Volume estimate
DWP’s current central estimate of underpayments is £1,153 million, with around 194,000 cases who may have an underpayment of State Pension and for whom the Department expects to correct. This increase in the Department’s estimate from 187,000 last year is due to additional affected people reaching State Pension age during 2023 to 2024, before the exercise commenced. Table 1 below shows the split of the overall provision relating to each group and the Department’s estimate of the number of individuals at 31 March 2024 who may still be affected and which may result in an arrears underpayment being identified.
Table 1 – Volume and arrears value estimates for each underpayment group
| Number of State Pension customers affected: 31 March 2024 000’s | Value of provision of | |
|---|---|---|
| unpaid arrears: 31 March 2024 £ million | ||
| Alive | 151 | 1,026 |
| Deceased | 43 | 127 |
| Total | 194 | 1,153 |
Totals are expressed to the nearest 1,000 customers or £1 million.
When calculating arrears owed in State Pension, the case is reviewed to identify where an individual may have been overpaid any other departmental benefit. Arrears values reported are therefore net of overpaid Pension Credit or any other income related benefit, such as Carer’s Allowance, or Severe Disablement Allowance.
Methodology and Data
The HRP exercise started at the end of 2023, and DWP has used the small amount of Management Information to inform this year’s estimates where appropriate. To estimate the provision, different groups potentially affected by missing HRP were identified, and the impact for each group separately assessed. DWP is currently aware of just two remaining groups[footnote 88] to be costed but it expects the cumulative impacts to be small.
Live Cases
To estimate the liability, DWP has calculated the potential volumes of people impacted who are alive above State Pension age using the error rate identified by the 2021 to 2022 DWP Fraud and Error exercise[footnote 89]. Applying this error rate to the State Pension population at the start of the 2022 to 2023 financial year gives a central estimate of volume for live cases above State Pension age of 150,000. The 95% confidence interval around this central estimate gives DWP a large range of 90,000 to 240,000 potentially affected cases. With Fraud and Error rates maintained across years since 2021 to 2022, the central volumes estimate of 150,000 remains one of the Department’s more confident assumptions.
DWP continues to assume it will be successful in paying arrears due to 90% of eligible customers who are alive. Applying this take up assumption to the central estimate of scale volume of 150,000 gives an estimate of 136,000 live individuals to be paid arrears. Lack of sufficient evidence from the exercise to inform this take up assumption is a significant driver of uncertainty in the estimates.
Using latest data from HM Revenue and Customs’ 2022 pilot exercise, the average arrears amount due to those potentially impacted who were alive above State Pension age is now estimated as £5,400. This estimate continues to be based on a small pilot sample and there is considerable uncertainty in the assumed average arrears amount.
Deceased Cases
To estimate the liability in 2023 to 2024, the Department has calculated the potential volumes of people impacted between 1978 to 1979 to 2023 to 2024 who are deceased above State Pension age by calculating the average mortality rate for the impacted population from HM Revenue and Customs targeted scan[footnote 90] data. This average mortality rate was calculated by weighting the mortality rates in the scan data by age. This gives a central estimate of scale volume for deceased cases above State Pension age of 60,000. The 95% confidence interval around this central estimate is 30,000 to 90,000.
Where a customer is deceased, State Pension arrears accrued up to death may be owed to their Next of Kin, but the Department does not currently have any evidence to estimate the success rate in contacting those Next of Kin. Therefore, in the absence of this, the Department assumes – as per the State Pension Underpayment LEAP exercise assumption for deceased CAT BL cases[footnote 91] – that the Next of Kin will be traceable for, and it will pay arrears to, 75% of these cases. Applying this take up assumption to the central estimate of volume above gives an estimate of 43,000 Next of Kin to be paid arrears. As with live cases, the lack of evidence surrounding the take up assumption among the Next of Kin for deceased cases is a significant driver of uncertainty in the estimates.
From analysis of a 2022 HM Revenue and Customs targeted scan, the average arrears amount due to those impacted in this group is now estimated as £3,300.For the same reasons outlined above, there is considerable uncertainty in the assumed average arrears amount.
Delivery Timetable
Work has now completed to determine and agree an appropriate delivery plan which accounts for HM Revenue and Customs’ actions to identify and contact customers and to acknowledge the relative vulnerability of customers impacted. This ensures DWP can address underpayments as quickly as possible. The timetable aligns with the forecasted case clearance profile in DWP’s delivery model produced by DWP Operational analysts and assumed a four year delivery (completion in the tax year 2027 to 2028). Compared to last year’s provisional profile, a lower number of applications were received in the first months of the exercise than previously estimated in 2023 to 2024 resulting in a lower utilisation.
Sensitivity Analysis
Where limited or no evidence is available, DWP has based assumptions on what it knows so far of the HRP exercise and the impact on individuals in scope. These assumptions were agreed by expert DWP and HM Revenue and Customs Governance Groups and are intended to reflect the uncertainty in the estimates. Monte Carlo simulation[footnote 92] has been used to compute the most robust range around the central estimates. Only the assumptions with the highest degree of uncertainty are included in the sensitivity analysis. The following table 2 shows the key modelling assumptions impacting liability.
Table 2[footnote 93]: Assumptions used to inform Monte Carlo simulations
| Group | Uncertainty | Low Scenario | Central Assumption[footnote 94] | High Scenario |
|---|---|---|---|---|
| Above State Pension age | Volumes | 90,000 | 150,000 | 240,000 |
| Above State Pension age | Average Arrears | £3,500 | £5,400 | £7,300 |
| Above State Pension age | Take Up | 30% | 90% | 90% |
| Deceased | Volumes | 30,000 | 60,000 | 90,000 |
| Deceased | Average Arrears | £1,400 | £3,300 | £5,300 |
| Deceased | Take Up | 19% | 75% | 75% |
As the exercise is in its early days, with only early data available, assumptions continue to be uncertain on the average arrears due and the volume of cases that will be corrected. The consistency of the results from the latest Fraud and Error data provides some assurance over the underlying volume of cases affected. The Department therefore considers that overall uncertainty is best represented by varying the average arrears, volumes and take up variables between their low and high values, as outlined above in Table 2.
Table 3 below sets out the central arrears estimate with its sensitivity range from low to high. Min and max estimates are derived when all assumptions are set to their minimum and maximum values at the same time, respectively.
Table 3 – Sensitivity analysis results for total arrears
| Low | Central | High | Min | Max | |
|---|---|---|---|---|---|
| Present Value (£ million)[footnote 95] | 520 | 1,153 | 1,220 | 263 | 1,614 |
Volumes
The sensitivity ranges for volumes comes from the 95% confidence intervals set around the central estimates obtained from the Fraud and Error 2021 to 2022 sample.
Average Arrears
The sensitivity ranges for average arrears comes from the 95% confidence intervals set around the central estimates obtained from the HM Revenue and Customs 2022 sample exercise.
Take Up
In the absence of any robust data on take up the Department has modelled a large range for both live and deceased cases; recognising deceased cases is likely to be lower. The lower levels of 30% among live cases and 19% among deceased are drawn from the State Pension Underpayment LEAP exercise data.
e. Other provisions
| Other provisions (d) | 31 March 2024: Core Department £000 | 31 March 2024: Departmental group £000 | 31 March 2023: Core Department £000 | 31 March 2023: Departmental group £000 |
|---|---|---|---|---|
| Balance at 1 April | 55,930 | 57,136 | 30,112 | 31,207 |
| Provided in year | 52,930 | 53,214 | 42,307 | 42,772 |
| Provisions not required written back | (291) | (416) | (11,977) | (12,331) |
| Change in discount rate | (464) | (464) | (2,651) | (2,651) |
| Utilised in year | (4,558) | (5,252) | (1,956) | (1,956) |
| Borrowing costs (unwinding of discount) | 176 | 176 | 95 | 95 |
| Balance at 31 March | 103,723 | 104,394 | 55,930 | 57,136 |
The remaining other provisions comprise:
- Onerous contracts and refurbishment work required on vacation of leased properties
- Expected future costs of Industrial Injuries Benefits permanent allowance payments to DWP employees who are injured at work and cannot perform their job as a result
- Expected future costs of work coaches recruitment exercise performed by SSCL
Analysis of expected timing of discounted flows
| FAS provisions: Core Department £000 | FAS provisions: Departmental group £000 | Benefit provisions: Core Department £000 | Benefit provisions: Departmental group £000 | State Pension provisions: Core Department £000 | State Pension provisions: Departmental group £000 | |
|---|---|---|---|---|---|---|
| Not later than one year | 244,613 | 244,613 | 397,341 | 397,341 | 368,621 | 368,621 |
| Later than one year and not later than 5 years | 920,244 | 920,244 | 358,331 | 358,331 | – | – |
| Later than 5 years | 2,665,287 | 2,665,287 | – | – | – | – |
| Balance at 31 March 2024 | 3,830,144 | 3,830,144 | 755,672 | 755,672 | 368,621 | 368,621 |
| HRP: Core Department £000 | HRP: Departmental group £000 | Other provisions: Core Department £000 | Other provisions: Departmental group £000 | Total: Core Department £000 | Total: Departmental group £000 | |
|---|---|---|---|---|---|---|
| Not later than one year | 128,875 | 128,875 | 47,168 | 47,293 | 1,186,618 | 1,186,743 |
| Later than one year and not later than 5 years | 1,023,749 | 1,023,749 | 52,660 | 52,660 | 2,354,984 | 2,354,984 |
| Later than 5 years | – | – | 3,895 | 4,441 | 2,669,182 | 2,669,728 |
| Balance at 31 March 2024 | 1,152,624 | 1,152,624 | 103,723 | 104,394 | 6,210,784 | 6,211,455 |
18. Remploy Pension Scheme
The Secretary of State for the Department of Work and Pensions (the Sponsor) operates a defined benefit pension arrangement called the Remploy Limited Pension and Assurance Scheme (the Scheme). The Scheme provides benefits based on final salary and length of service on retirement, leaving service or death. The balances relating to the Remploy pension scheme are recognised within the core department.
The Scheme is subject to the Statutory Funding Objective under the Pensions Act 2004. A valuation of the Scheme is carried out at least once every three years to determine whether the Statutory Funding Objective is met. As part of the process the Sponsor must agree with the Trustees of the Scheme the contributions to be paid to meet the Statutory Funding Objective. The Sponsor considers that it does not have an unconditional right to a future refund of any surplus built up in the Scheme and the present value future contributions required to meet the Statutory Funding Objective is recognised as an additional liability in these disclosures.
The Scheme is managed by a corporate Trustee appointed in part by the Sponsor and in part from elections by members of the Scheme. The Trustee has responsibility for obtaining valuations of the fund, administering benefit payments and investing the Scheme’s assets. The Trustees delegate some of these functions to their professional advisers where appropriate.
The Scheme exposes the Sponsor to a number of risks:
- investment risk. The Scheme holds investments in asset classes, such as equities, which have volatile market values and, while these assets are expected to provide real returns over the long-term, the short-term volatility can cause additional funding to be required if deficits emerge.
- interest rate risk. The Scheme’s liabilities are assessed using market yields on high quality corporate bonds to discount the liabilities. As the Scheme holds assets that are different to corporate bonds, the value of the assets and liabilities may not move in the same way. The interest rate risk is hedged to a certain extent via the Scheme’s Liability Driven Investment (LDI) strategy.
- inflation risk. A significant proportion of the benefits under the Scheme are linked to inflation. Although the Scheme’s assets are expected to provide a good hedge against inflation over the long-term, movements over the short-term could lead to deficits emerging. The inflation risk is hedged to a certain extent via the Scheme’s LDI strategy.
- mortality risk. In the event that members live longer than assumed deficits may emerge in the Scheme. There were no plan amendments, curtailments or settlements during the period.
- liquidity risk. The Scheme is holding significant portions of illiquid assets (such as property, direct lending, and semi-illiquid credit) in addition to leveraged LDI funds. The Scheme monitors liquidity requirements to ensure any collateral calls and benefit payments can be met when required.
Risk mitigation strategies
The Trustee, in conjunction with the Sponsor, has reviewed the investment strategy of the Scheme. This process entailed reviewing the liability profile of the Scheme and the Scheme’s investments. The Trustee has previously undertaken such a review which has resulted in the investment managers being instructed as to permissible ranges for asset allocations as set out in the Scheme’s current Statement of Investment Principles. The Scheme has no other asset-liability strategies in place.
Effect of the Scheme on Sponsor’s future cashflows
The Sponsor must agree a Schedule of Contributions with the Trustee of the Scheme following a valuation which must be carried out at least once every three years.
The most recent comprehensive actuarial valuation of the Scheme was carried out as at 31 March 2022 and the next valuation of the Scheme is due as at 31 March 2025. The Trustees and Sponsor agreed no further contributions were required as the funding level would reach 100% via investment returns alone. In the event that the 2025 valuation reveals a larger deficit than expected the Sponsor may be required to recommence contributions.
The Scheme currently has a surplus on the IAS19 basis. The Sponsor does not consider that it has an unconditional right to a future refund of this surplus, so an asset ceiling applies under IFRIC14 and the balance sheet asset is restricted to be nil. As no further contributions are due under the current Schedule of Contributions the Sponsor is not required to recognise any additional liabilities under IFRIC14.
The Sponsor expects to pay no contributions in the year to 31 March 2025. The weighted average duration of the defined benefit obligation is 12 years.
Guaranteed Minimum Pension (GMP) equalisation
Previous disclosures have included an allowance for GMP equalisation for the liabilities of the current members of the Scheme. This allowance was equivalent to around 1.0% of the value of the liabilities. The same allowance has been made this year.
In addition, an allowance for top-ups to previous transfers, has been included in the liabilities, of £246,000 at the Review Date.
Scheme surplus
At the Review Date there was a surplus in the Scheme of £26,795,000. This compares to a surplus of £43,253,000 at the previous review date. Although the surplus at the Review Date is £26,795,000, the final figure to be disclosed in the accounts is a net liability of £0. This is due to the effect of an asset ceiling.
The main reasons for the change in the surplus over the period are:
- an increase in the discount rate and decrease in future inflation assumptions has reduced the liabilities by £12 million
- changes to the Scheme’s mortality improvement assumptions has reduced the liability value by £6 million
- this has been more than offset by asset returns being lower than interest on the assets by £36 million
Pension Protection Fund levies
At present the Scheme remains exempt from paying the Pension Protection Fund levy, therefore there is no allowance in the calculation of the Scheme’s liability or service cost for any amounts payable in respect of Pension Protection Fund levies.
Virgin Media vs NTL Trustees High Court judgement
A potentially landmark judgement in the High Court case of Virgin Media vs NTL Trustees was handed down on 16 June 2023. The judge in this case ruled that, where benefit changes were made without a valid ‘section 37’ certificate from the Scheme Actuary, those changes could be considered void. The judgement could have material consequences for some defined benefit schemes which previously contracted-out of the State Pension system. These disclosures have been calculated assuming that this ruling will not affect the Scheme’s benefits.
Disclosures for IAS19 (Employee Benefits) Table of assumptions used in calculations
Figures for disclosure in accounts for period ending 31 March 2024 under IAS19. Results are shown in pounds, rounded to the nearest £1,000.
| Principal actuarial assumptions | At 31 Mar 2024 | At 31 Mar 2023 |
|---|---|---|
| Discount rate | 4.85% p.a. | 4.80% p.a. |
| Inflation (RPI) | 3.20% p.a. | 3.20% p.a. |
| Inflation (CPI) | 2.70% p.a. | 2.85% p.a. |
| Pension increase (Pre 1 April 1997 excess – CPI uncapped) | 2.70% p.a. | 2.85% p.a. |
| Pension increase (1 April 1997 – 1 April 2005 – CPI (capped at 5%)) | 2.65% p.a. | 2.85% p.a. |
| Pension increase (Post 1 April 2005 – RPI (capped at 5%)) | 3.10% p.a. | 3.10% p.a. |
| Principal actuarial assumptions | At 31 Mar 2024 | At 31 Mar 2023 |
|---|---|---|
| Post-retirement mortality | Remploy-specific table based on Remploy experience between 2007 and 2012 with CMI 2022 projections using a long-term improvement rate of 1.25% p.a. | Remploy-specific table based on Remploy experience between 2007 and 2012 with CMI 2021 projections using a long-term improvement rate of 1.25% p.a. |
| Commutation | 75% of members are assumed to take the maximum tax free cash possible | 75% of members are assumed to take the maximum tax free cash possible |
| Early Retirement | Non-pensioners over age 50 at 31 March 2016 retire at age 63, under age 50 retire at age 65 | Non-pensioners over age 50 at 31 March 2016 retire at age 63, under age 50 retire at age 65 |
| Ill health retirements | 0.25% loading (non-pensioners) | 0.25% loading (non-pensioners) |
| Allowance for GMP equalisation | Uplift to liabilities of approx 1% | Uplift to liabilities of approx 1% |
| Life expectancy at age 65 of male aged 45 | 19.8 | 20.0 |
| Life expectancy at age 65 of male aged 65 | 18.1 | 18.2 |
| Life expectancy at age 65 of female aged 45 | 22.9 | 23.1 |
| Life expectancy at age 65 of female aged 65 | 21.0 | 21.2 |
| The current asset split is as follows: | Asset allocation at 31 March 2024 £ |
|---|---|
| Property | 75,826,000 |
| Buy and Maintain Bonds | 288,650,000 |
| LDI | 201,416,000 |
| Multi Asset Credit | 56,531,000 |
| Renewable infrastructure | 38,149,000 |
| Direct lending | 34,976,000 |
| Cash | 3,210,000 |
| Insured assets | 2,069,000 |
| Defined benefit assets | 700,827,000 |
| Money purchase assets | 7,499,000 |
| Total assets | 708,326,000 |
Note that the Assets labelled “LDI” actually include a number of different assets types, including derivatives.
| SoFP | At 31 March 2024 £ | At 31 March 2023 £ |
|---|---|---|
| Fair value of assets | 708,326,000 | 747,927,000 |
| Present value of funded obligations | (681,531,000) | (704,674,000) |
| Surplus/(deficit)* in scheme | 26,795,000 | 43,253,000 |
| Effect of asset ceiling | (26,795,000) | (43,253,000) |
| Net defined benefit asset/(liability) | 0 | 0 |
*Surplus/(deficit) shown prior to deferred taxation
| Amount recognised in Profit and Loss | At 31 March 2024 £ | At 31 March 2023 £ |
|---|---|---|
| Current service cost | 0 | 0 |
| Administration costs | 1,725,000 | 1,698,000 |
| Interest on liabilities | 32,600,000 | 24,767,000 |
| Interest on assets | (34,635,000) | (25,061,000) |
| Past service costs | 0 | 0 |
| Settlement and curtailment cost | 0 | 0 |
| Interest on effect of asset ceiling | 2,076,000 | 343,000 |
| Total charge to Profit and Loss | 1,766,000 | 1,747,000 |
| Re-measurements over the period | Period to 31 March 2024 £ | Period to 31 March 2023 £ |
|---|---|---|
| Loss/(gain) on assets in excess of interest | 36,444,000 | 231,433,000 |
| Experience losses/(gains) on liabilities | (1,697,000) | 52,685,269 |
| Losses/(gains) from changes to demographic assumptions | (6,062,000) | (21,335,000) |
| Losses/(gains) from changes to financial assumptions | (11,917,000) | (295,293,269) |
| Losses/(gains) from change in effect of asset ceiling | (18,534,000) | 29,723,000 |
| Total re-measurements | (1,766,000) | (2,787,000) |
| Change in value of assets | Period to 31 March 2024 £ | Period to 31 March 2023 £ |
|---|---|---|
| Fair value of assets at start | 747,927,000 | 989,000,000 |
| Money Purchase assets at start | (7,898,000) | (7,997,000) |
| Interest on assets | 34,635,000 | 25,061,000 |
| Company contributions | 0 | 0 |
| Contributions by Scheme participants | 0 | 0 |
| Benefits paid | (35,668,000) | (32,904,000) |
| Administration costs | (1,725,000) | (1,698,000) |
| Change due to settlements and curtailments | 0 | 0 |
| Return on assets less interest | (36,444,000) | (231,433,000) |
| Money Purchase assets at end | 7,499,000 | 7,898,000 |
| Fair value of assets at end | 708,326,000 | 747,927,000 |
| Actual return on assets | (1,809,000) | (206,372,000) |
| Change in value of the DB liabilities | Period to 31 March 2024 £ | Period to 31 March 2023 £ |
|---|---|---|
| Defined benefit obligation at start | 704,674,000 | 976,853,000 |
| Money Purchase liabilities at start | (7,898,000) | (7,997,000) |
| Current service cost | 0 | 0 |
| Contributions by Scheme Participants | 0 | 0 |
| Past service costs | 0 | 0 |
| Interest on liabilities | 32,600,000 | 24,767,000 |
| Benefits paid | (35,668,000) | (32,904,000) |
| Change due to settlements and curtailments | 0 | 0 |
| Experience (gain)/loss on liabilities | (1,697,000) | 52,685,269 |
| Changes to demographic assumptions | (6,062,000) | (21,335,000) |
| Changes to financial assumptions | (11,917,000) | (295,293,269) |
| Money Purchase liabilities at end | 7,499,000 | 7,898,000 |
| Defined benefit obligation at end | 681,531,000 | 704,674,000 |
| Reconciliation of effect of asset ceiling | Period to 31 March 2024 £ | Period to 31 March 2023 £ |
|---|---|---|
| Effect of asset ceiling at start | 43,253,000 | 13,187,000 |
| Interest on effect of asset ceiling | 2,076,000 | 343,000 |
| Actuarial losses/(gains) | (18,534,000) | 29,723,000 |
| Effect of asset ceiling at end | 26,795,000 | 43,253,000 |
| Reconciliation of net defined benefit liability (asset) | Period to 31 March 2024 £ | Period to 31 March 2023 £ |
|---|---|---|
| Net defined benefit liability (asset) at start | 0 | 1,040,000 |
| Current service cost | 0 | 0 |
| Past service cost and settlement and curtailment cost | 0 | 0 |
| Net interest expense (income) | 41,000 | 49,000 |
| Remeasurements | (1,766,000) | (2,787,000) |
| Administration costs | 1,725,000 | 1,698,000 |
| Employer contributions | 0 | 0 |
| Net defined benefit liability (asset) at end | 0 | 0 |
| Sensitivity of the value placed on the liabilities | Approximate effect on liability £ |
|---|---|
| Discount rate +0.50% | (38,889,000) |
| Discount rate -0.50% | 43,171,000 |
| Inflation +0.50% | 30,612,000 |
| Inflation -0.50% | (28,491,000) |
| Decrease mortality rates by a factor of 10% | 26,684,000 |
| Increase mortality rates by a factor of 10% | (23,936,000) |
19. Incorrect payments
Overview
DWP is responsible for paying claimants the right benefit at the right time. Social security legislation sets out the basis on which DWP calculates and pays benefits. The purpose of this legislation is to provide a regulatory framework within which the Department operates to support those in need.
In many instances Parliament has targeted specific benefits to claimants’ needs and circumstances to ensure an efficient use of overall resources. However, this can introduce complexity and an attendant risk of fraud and error, leading to some incorrect payments. DWP administers over 25 benefits, ensuring that the very different conditions of entitlement are met in each individual instance. The Department takes tackling incorrect payments seriously and pays around 96% of its £266 billion[footnote 96] benefit expenditure correctly.
Reclassification of Claimant Error Underpayments
DWP carried out a planned review of the Fraud and Error in the Benefit System statistics that are referred to in its publication strategy when it published its 2022 to 2023 statistics. This review determined that the estimates previously published as claimant error underpayments do not fit the legal definition of underpayments. In benefit legislation, claimants are not eligible for increases in their benefit until they accurately report changes in their circumstances to the Department.
Due to the outcome of this review, estimates that were previously reported as claimant error underpayments have been removed from the Fraud and Error in the Benefit System statistics publication from 2023 to 2024 onwards. These estimates have been reclassified as unfulfilled eligibility, and this information has been reported separately in a new Unfulfilled Eligibility in the Benefit System publication.
Unfulfilled eligibility refers to claimants who are already in receipt of a certain benefit but may not be getting the full award they could be eligible for. Unfulfilled Eligibility in the Benefit System estimates the percentage of benefit expenditure that could have been paid to people with unfulfilled eligibility, if they had provided the correct information. The proportion of benefit claims with unfulfilled eligibility will also be estimated.
These new estimates are calculated using very similar methodology to that used previously for claimant error underpayments. However, when these estimates were classified as claimant error underpayments, a netting adjustment was made to the data where overpayments and underpayments on the same claim were netted off each other, to calculate the net effect of each claim. Following the reclassification, fraud and error and unfulfilled eligibility are defined and published separately, so there is no longer a netting adjustment that can be made to unfulfilled eligibility claims. This has led to an increase in the unfulfilled eligibility estimates, when compared to claimant error underpayment estimates. It also leads to an increase in the fraud and error overpayment estimates since unfulfilled eligibility cannot be netted off from overpayments.
To allow for a direct comparison, the 2022 to 2023 figures for all benefits have been revised in both publications to account for this difference. On overpayments Universal Credit and Housing Benefit were the most affected with the amount overpaid increasing by £70 million and £50 million respectively.
Rate of fraud and error in 2023 to 2024
For this financial year DWP has carried out full reviews on Universal Credit, Pension Credit, Housing Benefit (pension age client groups), Personal Independence Payments and State Pension. DWP has also carried out a full review of Disability Living Allowance for the first time since 2004 to 2005. For benefits not measured this year the Department either rolls forward rates from when the benefit was last measured or applies a proxy rate to the 2023 to 2024 expenditure. For more information, please see the benefit fraud and error estimation uncertainty and assumptions section.
The 2023 to 2024 statistics (published in May 2024) indicate that fraud and error overpayments increased to 3.7% from 3.6%. This amounts to a monetary value of £9.7 billion overpaid from a total expenditure of £266 billion this year. Fraud accounts for overpayments of 2.8% (£7.4 billion) of expenditure, whilst claimant error is 0.6% (£1.6 billion) and official error is 0.3% (£0.8 billion)[footnote 97].
DWP has an obligation to ensure that any overpaid benefit is recovered from the debtor in accordance with the appropriate social security legislation. The Department estimates £1.1 billion was recovered in 2023 to 2024[footnote 98]. The money recovered this year relates to overpayments this year and in prior periods[footnote 99].
The 2023 to 2024 statistics estimate that the proportion of benefit underpaid from official error decreased to 0.4% (£1.1 billion) from 0.5% (£1.2 billion).
Where DWP has been notified about an underpayment, and where there is a legal obligation, it will pay any arrears due. Where underpayments are identified because of official error, the Department will pay arrears in full at the earliest opportunity, subject to any legal considerations. The Department’s fraud, error and debt strategy requires it to minimise underpayments and ensure that it pays claimants their full entitlement.
In 2020 to 2021 the Department became aware of an underpayment issue affecting State Pension. The types of errors leading to these underpayments had been identified in cases reviewed to estimate MVFE, therefore in year underpayments are included in the MVFE estimate. More information on this State Pension provision can be found in Note 17d.
Last year, whilst contacting claimants as part of the full review of State Pension DWP identified an area of official error that it was not capturing in previous years. The Department has continued to find errors of this nature in 2023 to 2024. This related to Home Responsibilities Protection. For people reaching State Pension age before 6 April 2010, Home Responsibilities Protection (HRP) reduced the number of qualifying years needed for a basic State Pension where someone stayed at home to care for children for whom they received Child Benefit or a person who was sick or disabled. For people reaching State Pension age since 6 April 2010, previously recorded periods of HRP were converted into National Insurance credits. Errors occurred where periods when HRP was due, were not accurately recorded on their National Insurance record. More information on this can be found in Note 17.
Further details on DWP’s fraud and error strategy are included in the performance report.
Fraud and Error Statistics
Table 1. Overall 2023 to 2024 fraud and error estimates
| Fraud | Claimant Error | Official Error | Total | |
|---|---|---|---|---|
| Overpayments | 2.8% | 0.6% | 0.3% | 3.7% |
| Overpayments | (£7.4bn) | (£1.6 billion) | (£0.8 billion) | (£9.7 billion) |
| Underpayments | 0.0% | 0.0% | 0.4% | 0.4% |
| Underpayments | (£0.0 billion) | (£0.0 billion) | (£1.1 billion) | (£1.1 billion) |
| Total Expenditure | – | – | – | £266.2 billion |
Table 2. Estimates for benefits reviewed in 2023 to 2024
| Benefit | Overpayments: Fraud | Overpayments: Claimant Error | Overpayments: Official Error | Overpayments: Total | Underpayments: Official Error | Underpayments: Total Expenditure |
|---|---|---|---|---|---|---|
| Universal Credit | 10.9% | 0.8% | 0.7% | 12.4% | 0.3% | – |
| Universal Credit | (£5.7 billion) | (£0.4 billion) | (£0.4 billion) | (£6.5 billion) | (£0.2 billion) | £51.9 billion |
| State Pension | 0.1% | 0.1% | 0.0% | 0.1% | 0.4% | |
| State Pension | (£0.1 billion) | (£0.1 billion) | (£0.0 billion) | (£0.2 billion) | (£0.5 billion) | £123.9 billion |
| PIP | 0.0% | 0.3% | 0.1% | 0.4% | 0.4% | |
| PIP | (£0.0 billion) | (£0.1 billion) | (£0.0 billion) | (£0.1 billion) | (£0.1 billion) | £21.6 billion |
| Housing Benefit | 3.9% | 2.0% | 0.5% | 6.3% | 0.4% | |
| Housing Benefit | (£0.6 billion) | (£0.3 billion) | (£0.1 billion) | (£1.0 billion) | (£0.1 billion) | £15.5 billion |
| Disability Living Allowance | 0.1% | 0.2% | 0.2% | 0.5% | 1.0% | |
| Disability Living Allowance | (£0.0 billion) | (£0.0 billion) | (£0.0 billion) | (£0.0 billion) | (£0.1 billion) | £6.8 billion |
| Pension Credit | 3.9% | 3.8% | 1.9% | 9.7% | 1.0% | |
| Pension Credit | (£0.2 billion) | (£0.2 billion) | (£0.1 billion) | (£0.5 billion) | (£0.1 billion) | £5.4 billion |
Table 3. Estimates for benefits reviewed in previous years
| Benefit | Overpayments: Fraud | Overpayments: Claimant Error | Overpayments: Official Error | Overpayments: Total | Underpayments: Official Error | Underpayments: Total Expenditure |
|---|---|---|---|---|---|---|
| Employment and Support Allowance | 1.5% | 1.6% | 0.4% | 3.4% | 1.1% | |
| ESA | (£0.2 billion) | (£0.2 billion) | (£0.1 billion) | (£0.4 billion) | (£0.1 billion) | £12.7 billion |
| Attendance Allowance | 0.0% | 1.9% | 0.3% | 2.2% | 0.1% | |
| Attendance Allowance | (£0.0 billion) | (£0.1 billion) | (£0.0 billion) | (£0.2 billion) | (£0.0 billion) | £6.7 billion |
| Carer’s Allowance | 3.0% | 2.0% | 0.1% | 5.2% | 0.0% | |
| Carer’s Allowance | (£0.1 billion) | (£0.1 billion) | (£0.0 billion) | (£0.2 billion) | (£0.0 billion) | £3.7 billion |
| Jobseeker’s Allowance | 3.1% | 0.3% | 1.2% | 4.6% | 1.2% | |
| Jobseeker’s Allowance | (£0.0 billion) | (£0.0 billion) | (£0.0 billion) | (£0.0 billion) | (£0.0 billion) | £0.3 billion |
| Income Support | 2.4% | 1.0% | 0.4% | 3.9% | 0.3% | |
| Income Support | (£0.0 billion) | (£0.0 billion) | (£0.0 billion) | (£0.0 billion) | (£0.0 billion) | £0.6 billion |
| Incapacity Benefit | 0.3% | 0.9% | 1.2% | 2.4% | 0.7% | |
| Incapacity Benefit | (£0.0 billion) | (£0.0 billion) | (£0.0 billion) | (£0.0 billion) | (£0.0 billion) | £0.0 billion |
Table 4. Estimates for benefits never reviewed and interdependencies
| Overpayments: Fraud | Overpayments: Claimant Error | Overpayments: Official Error | Overpayments: Total | Underpayments: Official Error | Underpayments: Total Expenditure | |
|---|---|---|---|---|---|---|
| Unreviewed benefits | 2.8% | 0.3% | 0.3% | 3.4% | 0.1% | |
| Unreviewed benefits | (£0.5 billion) | (£0.1 billion) | (£0.0 billion) | (£0.6 billion) | (£0.0 billion) | £17.0 billion |
| Interdependencies | z | z | z | z | z | |
| Interdependencies | (£0.0 billion) | (£0.0 billion) | (£0.0 billion) | (£0.1 billion) | z |
Notes to tables 1 to 4:
1. The 2023 to 2024 data comes from DWP National Statistics: Fraud and Error in the Benefit System: financial year 2023 to 2024 Estimates. Fraud and error rates for Universal Credit, Pension Credit, Housing Benefit, State Pension are based on cases sampled in the period November 2022 to October 2023. Personal Independence Payments rates are based on cases sampled in the period September 2022 to August 2023. Disability Living Allowance rates are based on cases sampled in the period February 2023 to September 2023.
2. Estimates for all benefits are based on estimated benefit expenditure for 2023 to 2024. These are consistent with Spring Budget 2024 and were the latest available for the financial year at the time of producing the fraud and error estimate.
3. All expenditure values in the table are rounded to the nearest £100 million and monetary estimates are rounded to the nearest £10 million.
4. Figures expressed as percentages (6) give the overpayments and underpayments as a % of the benefit paid out in the year (expenditure).
5. Rows and columns may not equal the totals due to rounding.
6. Carer’s Allowance underpayment estimates are zero as no underpayment cases were found in the sample.
7. The overpayment and underpayment figures above are central estimates and therefore there is a degree of uncertainty around them. The full statistical tables are available at GOV.UK on the “Fraud and Error in the Benefit System financial year 2023 to 2024” page and show the 95% confidence intervals for all the figures above. These confidence intervals allow for statistical uncertainty caused by the sampling approach. Further uncertainties arise from imperfections in the review process. Where possible the Department has quantified these and incorporated them into the 95% confidence intervals.
8. Any figure marked with a * means that it has a statistically significant difference (at a 95% level of confidence) when comparing to the last time it was measured. Where changes are not statistically significant, differences are likely to be due to sampling variation. This suggests that these estimates are stable over time with little change year-on-year. For Disability Living Allowance no comparison has been carried out as the benefit is very different to when it was last measured in 2004 to 2005. All other benefits are compared to the 2022 to 2023 statistics. For the previous year figures please see the “Fraud and Error in the Benefit System financial year 2023 to 2024” page on GOV.UK
9. DWP reviews a selection of benefits for fraud and error each year. Estimates for other benefits come from previous review exercises, or proxies. Please refer to the latest National Statistics publication for further details. (See ‘Benefit fraud and error estimation and uncertainty assumptions’ section below for details).
10. “Interdependencies” is an estimate of the knock-on effects of DLA/PIP overpayments on caring and disability premiums on income-related benefits, which depend on the rate of DLA/PIP in payment.
11. A ‘z’ indicates not applicable.
Unfulfilled Eligibility Statistics
Table 5. Estimates for benefits reviewed in 2023 to 2024
| Benefit | Unfulfilled Eligibility | Last measured | Total Expenditure |
|---|---|---|---|
| All Benefit | 1.2% | 1.0% | – |
| All Benefit | (£3.1 billion) | (£2.3 billion) | £266.2 billion |
| Universal Credit | 1.4% | 1.4% | – |
| Universal Credit | (£0.7 billion) | (£0.6 billion) | £51.9 billion |
| State Pension | 0.0% | 0.1% | – |
| State Pension | (£0.0 billion) | (£0.1 billion) | £123.9 billion |
| Personal Independence Payments | 4.0% | 4.8% | – |
| Personal Independence Payments | (£0.9 billion) | (£0.9 billion) | £21.6 billion |
| Housing Benefit | 1.1% | 1.0% | – |
| Housing Benefit | (£0.2 billion) | (£0.2 billion) | £15.5 billion |
| Disability Living Allowance | 11.1% | 2.4% | – |
| Disability Living Allowance | (£0.8 billion) | (£0.1 billion) | £6.8 billion |
| Pension Credit | 1.5% | 1.1% | – |
| Pension Credit | (£0.1 billion) | (£0.1 billion) | £5.4 billion |
| Employment and Support Allowance | 1.4% | 1.4% | – |
| Employment and Support Allowance | (£0.2 billion) | (£0.2 billion) | £12.7 billion |
| Attendance Allowance | 4.2% | 4.2% | – |
| Attendance Allowance | (£0.3 billion) | (£0.2 billion) | £6.7 billion |
| Carer’s Allowance | 0.0% | 0.0% | – |
| Carer’s Allowance | (£0.0 billion) | (£0.0 billion) | £3.7 billion |
| Jobseeker’s Allowance | 0.3% | 0.3% | – |
| Jobseeker’s Allowance | (£0.0 billion) | (£0.0 billion) | £0.3 billion |
| Income Support | 0.4% | 0.4% | – |
| Income Support | (£0.0 billion) | (£0.0 billion) | £0.6 billion |
| Incapacity Benefit | 0.0% | 0.0% | – |
| Incapacity Benefit | (£0.0 billion) | (£0.0 billion) | £0.0 billion |
| Unreviewed benefits | 0.2% | 0.2% | – |
| Unreviewed benefits | (£0.0 billion) | (£0.0 billion) | £17.0 billion |
Notes to table 5:
1. The 2023 to 2024 data comes from DWP Official Statistics: Unfulfilled Eligibility in the Benefit System: financial year 2023 to 2024 Estimates. Unfulfilled Eligibility rates for Universal Credit, Pension Credit, Housing Benefit and State Pension are based on cases sampled in the period November 2022 to October 2023. Personal Independence Payments rates are based on cases sampled in the period September 2022 to August 2023. Disability Living Allowance rates are based on cases sampled in the period February 2023 to September 2023.
2. Estimates for all benefits are based on estimated benefit expenditure for 2023 to 2024. These are consistent with Spring Budget 2024 and were the latest available for the financial year at the time of producing the fraud and error estimate.
3. All expenditure values in the table are rounded to the nearest £100 million and monetary estimates are rounded to the nearest £10 million.
4. Figures expressed as percentages (%) give the unfulfilled eligibility as a % of the benefit paid out in the year (expenditure).
5. Rows and columns may not equal the totals due to rounding.
6. There is no unfulfilled eligibility on Carer’s Allowance.
7. The Unfulfilled Eligibility figures above are central estimates and therefore there is a degree of uncertainty around them. The full statistical tables are available at GOV.UK on the “Unfulfilled Eligibility in the Benefit System financial year 2023 to 2024” page and show the 95% confidence intervals for all the figures above. These confidence intervals allow for statistical uncertainty caused by the sampling approach. Further uncertainties arise from imperfections in the review process. Where possible DWP has quantified these and incorporated them into the 95% confidence intervals.
8. Any figure marked with a * means that it has a statistically significant difference (at a 95% level of confidence) when comparing to the last time it was measured. Where changes are not statistically significant, differences are likely to be due to sampling variation. This suggests that these estimates are stable over time with little change year-on-year. For Disability Living Allowance no comparison has been carried out as the benefit is very different to when it was last measured in 2004 to 2005. All other benefits are compared to the 2022 to 2023 statistics. For the previous year figures please see the “Unfulfilled Eligibility in the Benefit System financial year 2023 to 2024” page on GOV.UK
9. The Unfulfilled Eligibility rates are derived from the same sample that underpins the Fraud and Error National Statistics publication. This means that only a selection of benefits are reviewed each year for Unfulfilled Eligibility. Estimates for other benefits come from previous review exercises, or proxies. Please refer to the latest National Statistics publication for further details. (See ‘Benefit fraud and error estimation and uncertainty assumptions’ section below for details).
10. A ‘z’ indicates not applicable.
How each benefit contributes to the overall level of overpayments and underpayments
Individual benefits make varying contributions to the overall fraud and error rate, and changes in the rates for each benefit from year to year have different impacts on the overall rate of fraud and error. The table below illustrates how each of the benefits contribute to the overall overpayment value (of £9.7 billion benefit expenditure, equating to an overall rate of 3.7%) and overall underpayment amount (of £1.1 billion benefit expenditure, equating to an overall rate of 0.4%). The table also shows how changes to the overpayment and underpayment rates for the individual benefits could affect the overall figures.
Table of the proportion each benefit contributes to the overall overpayment rate
| Reviewed in 2023 to 2024 | UC | SP | HB | DLA | PC | PIP |
|---|---|---|---|---|---|---|
| Expenditure (£ billion) | 51.9 | 123.9 | 15.5 | 6.8 | 5.4 | 21.6 |
| Overpayment rate | 12.4% | 0.1% | 6.3% | 0.5% | 9.7% | 0.4% |
| Overpayment value (£ million) | 6460 | 170 | 980 | 30 | 520 | 90 |
| Contribution to overall OPs | 66% | 2% | 10% | 0% | 5% | 1% |
| Impact of a 10% change in monetary value of overpayment on the overall overpayment rate | 0.24% | 0.01% | 0.04% | 0.0% | 0.02% | 0.00% |
| Previously reviewed | ESA | AA | CA | JSA | IS |
|---|---|---|---|---|---|
| Expenditure (£ billion) | 12.7 | 6.7 | 3.7 | 0.3 | 0.6 |
| Overpayment rate | 3.4% | 2.2% | 5.2% | 4.6% | 3.9% |
| Overpayment value (£ million) | 430 | 150 | 190 | 10 | 30 |
| Contribution to overall OPs | 4% | 2% | 2% | 0% | 0% |
| Impact of a 10% change in monetary value of overpayment on the overall overpayment rate | 0.02% | 0.01% | 0.01% | 0.00% | 0.00% |
| Previously reviewed | ESA | AA | CA | JSA | IS | IB | Unreviewed |
|---|---|---|---|---|---|---|---|
| Expenditure (£ billion) | 12.7 | 6.7 | 3.7 | 0.3 | 0.6 | 0.0 | 17.0 |
| Overpayment rate | 3.4% | 2.2% | 5.2% | 4.6% | 3.9% | 2.4% | 3.4% |
| Overpayment value (£ million) | 430 | 150 | 190 | 10 | 30 | 0 | 570 |
| Contribution to overall OPs | 4% | 2% | 2% | 0% | 0% | 0% | 6% |
| Impact of a 10% change in monetary value of overpayment on the overall overpayment rate | 0.02% | 0.01% | 0.01% | 0.00% | 0.00% | 0.00% | 0.02% |
For example, Universal Credit currently contributes 66% of the overall overpayment value, the highest of all individual benefits. If the monetary value of overpayment on Universal Credit (currently £6,460 million) changed by 10%, this would lead to the overall overpayment rate of 3.7% changing by 0.24% (equating to around £650 million).
Table of the proportion each benefit contributes to the overall official error underpayment rate
| Reviewed in 2023 to 2024 | UC | SP | HB | DLA | PC | PIP |
|---|---|---|---|---|---|---|
| Expenditure (£ billion) | 51.9 | 123.9 | 15.5 | 6.8 | 5.4 | 21.6 |
| Underpayment rate | 0.3% | 0.4% | 0.4% | 1.0% | 1.0% | 0.4% |
| Underpayment value (£ million) | 180 | 470 | 50 | 70 | 50 | 80 |
| Contribution to overall UPs | 17% | 44% | 5% | 6% | 5% | 8% |
| Impact of a 10% change in monetary value of underpayment on the overall underpayment rate | 0.01% | 0.02% | 0.00% | 0.00% | 0.00% | 0.00% |
| Previously reviewed | ESA | AA | CA | JSA | IS | IB | Unreviewed |
|---|---|---|---|---|---|---|---|
| Expenditure (£ billion) | 12.7 | 6.7 | 3.7 | 0.3 | 0.6 | 0.0 | 17.0 |
| Underpayment rate | 1.1% | 0.1% | 0.0% | 1.2% | 0.3% | 0.7% | 0.1% |
| Underpayment value (£ million) | 140 | 10 | 0 | 0 | 0 | 0 | 20 |
| Contribution to overall UPs | 13% | 1% | 0% | 0% | 0% | 0% | 2% |
| Impact of a 10% change in monetary value of underpayment on the overall underpayment rate | 0.01% | 0.00% | 0.00% | 0.00% | 0.00% 0.00% | 0.00% |
For example, State Pension currently contributes 44% of the overall official error underpayment value, the highest of all individual benefits measured this year. If the monetary value of official error underpayment on State Pension (currently £470 million) changed by 10%, this would lead to the overall official error underpayment rate of 0.4% changing by 0.02% (equating to around £50 million).
Table of the proportion each benefit contributes to the overall unfulfilled eligibility rate
| Reviewed in 2023 to 2024 | UC | SP | HB | DLA | PC | PIP |
|---|---|---|---|---|---|---|
| Expenditure (£ billion) | 51.9 | 123.9 | 15.5 | 6.8 | 5.4 | 21.6 |
| Unfulfilled Eligibility rate | 1.4% | 0.0% | 1.1% | 11.1% | 1.5% | 4.0% |
| Unfulfilled Eligibility value (£ million) | 730 | 20 | 180 | 750 | 80 | 870 |
| Contribution to overall UE | 23% | 1% | 6% | 24% | 3% | 28% |
| Impact of a 10% change in monetary value of unfulfilled eligibility on the overall unfulfilled eligibility rate | 0.03% | 0.00% | 0.01% | 0.03% | 0.00% | 0.03% |
| Previously reviewed | ESA | AA | CA | JSA | IS | IB | Unreviewed |
|---|---|---|---|---|---|---|---|
| Expenditure (£ billion) | 12.7 | 6.7 | 3.7 | 0.3 | 0.6 | 0.0 | 17.0 |
| Unfulfilled Eligibility rate | 1.4% | 4.2% | 0.0% | 0.3% | 0.4% | 0.0% | 0.2% |
| Unfulfilled Eligibility value (£ million) | 180 | 280 | 0 | 0 | 0 | 0 | 30 |
| Contribution to overall UE | 6% | 9% | 0% | 0% | 0% | 0% | 1% |
| Impact of a 10% change in monetary value of unfulfilled eligibility on the overall unfulfilled eligibility rate | 0.01% | 0.01% | 0.00% | 0.00% | 0.00% | 0.00% | 0.00% |
For example, Personal Independence Payment currently contributes 28% of the overall unfulfilled eligibility value, the highest of all individual benefits measured this year. If the monetary value of unfulfilled eligibility on Personal Independence Payment (currently £870 million) changed by 10%, this would lead to the overall unfulfilled eligibility rate of 1.2% changing by 0.03% (equating to around £90 million).
Benefit fraud and error estimation uncertainty and assumptions
DWP is rigorous in estimating levels of fraud and error. Its estimates are produced to the exacting standards of the UK Statistics Authority protocols for National Statistics, ensuring their production is independent of departmental and ministerial influence.
DWP’s strategy for estimating the level of incorrect payments considers the value of the benefit, its risk profile and previous experience of measuring the benefit. The Department’s estimates are based on around 13,300 reviews of a random sample[footnote 100] of claimants on certain benefits.
Table of the number of cases reviewed for each benefit this year
| Benefit | Sample size | Percentage of claimant population reviewed |
|---|---|---|
| Universal Credit | 3,986 | 0.09% |
| State Pension | 1,557 | 0.01% |
| Housing Benefit | 3,001 | 0.13% |
| Pension Credit | 1,989 | 0.15% |
| Disability Living Allowance | 1,385 | 0.11% |
| Personal Independence Payment | 1,395 | 0.06% |
| Total | 13,313 | 0.06% |
Further information on DWP’s estimation strategy can be found at GOV.UK (within the latest Fraud and Error in the benefit system National Statistics publication, and the Background Information document).
When interpreting the statistics, please bear in mind that the Department only samples cases that are in receipt of benefit. The figures do not include, for example, people who are entitled to benefit but don’t apply, those whose applications are incorrectly rejected, or benefit advances. One of the largest of these omissions is advances relating to Universal Credit. Analysis carried out by the Department, estimates that the monetary value of fraud and error on Universal Credit Advances is between £0m and £60m.
Sampling uncertainty and confidence intervals
The above tables contain estimates based on a sample of benefit claims and are therefore subject to a degree of statistical uncertainty. They are prepared to within a stated range of accuracy, described as confidence intervals. The estimates are provided to a 95% confidence level. For 2023 to 2024, the rates of total overpayment lie in the range from 3.4% to 3.9% (monetary value £9.0 billion to £10.5 billion), whilst the corresponding range for Official Error underpayments is 0.3% to 0.5% (£0.9 billion to £1.3 billion) and Unfulfilled Eligibility is 1.1% to 1.3% (£2.9 billion to £3.4 billion).
When rolling forward historic rates of Fraud and Error or Unfulfilled Eligibility, the level of uncertainty associated with those estimates increases. To reflect this rise in uncertainty, for any benefit that has rolled forward rates due to not being measured in the current year, the confidence intervals from the rates found when it was last measured are widened by a factor of 2. Due to the benefits measured this year making up around 85% of all expenditure, the impact this has had on the All Benefits Confidence intervals is minimal.
Further information on these figures can be found at GOV.UK (within the latest Fraud and Error National Statistics publication, the latest Unfulfilled Eligibility Official Statistics publication, the Fraud and Error Background Information document and the Unfulfilled Eligibility Background Information document).
‘Cannot Review’ assumption
‘Cannot Review’ cases are those that do not engage with the Performance Measurement review of their benefit award, resulting in their benefit being suspended. Prior to 2019 to 2020 DWP classified all these cases as fraud. The Department now looks at each of these cases individually and classifies them as follows:
- benefit correct – if they come back on to benefit within four months with the same circumstances;
- fraud – if there is a suspicion of fraud raised following initial data gathering prior to review;
- inconclusive – where there is no information to suggest a suspicion of fraud or that the claimant has reclaimed benefit.
Inconclusive cases are removed from the main fraud and error estimate and footnoted separately in the fraud and error statistical publication.
Inconclusive cases accounted for £1,440 million of expenditure in 2023 to 2024. Had all these cases been instead classed as fraud, then the total monetary value of overpayments would rise from £9.7 billion to £11.2 billion, and the overall overpayment rate would rise from 3.7% to 4.2%. Carrying out the same calculation to include the inconclusive expenditure on 2022 to 2023, the overpayment rate would have been 4.0%.
Further information on this assumption and the impact can be found at GOV.UK (within the latest Fraud and Error in the benefit system National Statistics publication, and the supporting background information document).
Move to telephony
From 2021 to 2022, DWP reviews all benefits via telephone. This is the first time that the Housing Benefit pension age client group reviews have been carried out via telephone, in previous years they were carried out by home visits. The Department is making the assumption that this change to the review process has no impact on the Fraud and Error rate.
State Pension
As the reviews for State Pension only cover cases from Great Britain, DWP also includes an additional amount of Claimant Error to estimate the impact of non-notification of death on State Pension cases who live overseas. This adjustment is based on life certificate data from 2006. The Department is currently reviewing the best method of updating this figure.
For the first time cases were selected in the 2023 to 2024 State Pension sample from the new Get Your State Pension (GYSP) system. The proportion of cases from GYSP included in the sample was 5.0%. The average proportion of the caseload that was GYSP over the sampling period was 8.0%. Although GYSP cases were included in the sample, it wasn’t equal to the proportion that GYSP makes of the whole State Pension caseload.
Cost of Living Payments
For the first time last year the Department made extra payments, called Cost of Living Payments to claimants on certain benefits. This was to give claimants extra support during the current cost of living crisis. These continued into the 2023 to 2024 financial year.
Cost of Living Payments have not been measured directly for fraud and error so a proxy measure has been derived to estimate the amount of the benefit that was incorrectly paid.
The main reason that Cost of Living Payments would be incorrectly paid would be because the claimant was ineligible to receive the qualifying benefit. Therefore the proxy measure for the fraud and error rate on Cost of Living Payments is based on the rates of entitlement loss from the last time the Department measured the benefits that qualify claimants for a Cost of Living Payment.
Table showing the qualifying benefits for Cost of Living Payments, their loss of entitlement rate used and where/when the rate came from
| Qualifying Benefit | Loss of Entitlement Rate | Rate used |
|---|---|---|
| Universal Credit | 10.2% | From 2023 to 2024 Work Programme |
| Disability Living Allowance | 0.5% | From 2023 to 2024 Work Programme |
| Pension Credit | 4.7% | From 2023 to 2024 Work Programme |
| Personal Independence Payments | 2.1% | From 2023 to 24 Work Programme |
| Winter Fuel Payments | 0.5% | From 2022 to 2023 service centre measurement |
| Employment and Support Allowance | 1.7% | From 2022 to 2023 Work Programme |
| Attendance Allowance | 2.3% | From 2021 to 22 Work Programme |
| Jobseeker’s Allowance | 3.3% | From 2018-19 Work Programme |
| Armed Forces Independence Payments | 2.1% | Proxy – PIP rate from 2023 to 2024 Work Programme |
| Income Support | 3.3% | Proxy – JSA rate from 2018 to 2019 Work Programme |
These loss of entitlement rates are then applied to the Cost of Living Payment expenditure related to the relevant qualifying benefit, to generate an amount of Cost of Living Payments overpaid for each of the benefits above. The MVFE related to each benefit is summed and then divided by the total Cost of Living Payment to generate the rates.
Within DWP’s estimates it has not taken account of Official Error overpayments and underpayments that happened directly on Cost of Living Payments (Fraud and Claimant Error cannot happen directly on Cost of Living Payments). These include:
- unsuccessfully delivered payments
- a small number of Cost of Living Payments paid in error to the wrong person
However, the Department estimates that the impact of this on its estimates is minimal. For more information, please see the background information document that accompanies the statistics.
Cost of Living Payments are included in the unreviewed benefits line and account for 96% (£550 million) of the total unreviewed overpayments this year.
Currently there are no plans for Cost of Living Payments to continue after the 2023 to 2024 financial year.
New adjustment to Failure to Provide Evidence cases
This relates to cases where the claimant has participated in the benefit review but has then failed to send in the requested evidence and subsequently had their claim to benefit terminated for failing to comply.
Last year DWP brought in an adjustment to these cases where it looks four months after their claim was terminated to see if it can find any evidence that would allow it to reclassify the fraud to a known error reason. This year the Department expanded this adjustment to see if it can find any evidence that would allow it to remove the fraud entirely on some of these cases (for example if it can see evidence of earnings coming through RTI the month after the benefit was terminated, which would have nulled the claim).
Although this change impacts all benefits, for 2022 to 2023 it was only Universal Credit that needed to be revised, where around £100 million was removed from the Failure to Provide Evidence Fraud.
20. Contingent liabilities
Benefit underpayments
Distinct from legal cases, the Department acknowledges that administrative errors (termed official error) by its staff will sometimes result in the underpayment of benefit. Where underpayments relating to official error are identified, DWP pays arrears in full at the earliest opportunity.
Through annual review of fraud and error statistics, the Department has an estimate of official error both for the current year (see note 18), and prior years from equivalent exercises. These estimates are based on statistical samples; as a result the Department does not hold a full list of underpaid benefits cases that it can correct. The Department cannot quantify the cumulative historic liability which may exist due to limitations in data. Therefore, a contingent liability exists for underpayments not yet found and corrected. The measures reported in the Incorrect Payments notes show an estimate of underpayments made in the reporting year. At present there is no mechanism by which DWP can calculate the value of historic official error corrected in year, to support an overall quantification of the outstanding liability. The Department will review processes and data sources available with a view to quantify this liability in future.
Legal cases
The ongoing legal cases (judicial reviews and appeals) may lead to possible obligations where the Department is facing legal challenge to the policy behind the legislation through the courts and the outcomes depend on the court rulings. In some early stage cases the legal challenges include numerous arguments that require a decision to be made by the Courts. In these cases, until further rulings are received, a reliable estimate is not always possible. However, there will be underpinning analysis done by the Department to support a number of estimates based on a range of different scenarios. However, further disclosure of the details of the cases or the ranges is not provided as, in accordance with IAS 37 (Provisions, Contingent Liabilities and Contingent Assets), the Department considers that the disclosure of values for any legal contingent liabilities could be expected to seriously prejudice ongoing litigation.
Compensation recovery
DWP recognises recoveries from insurance companies for compensation claims made by benefit recipients. Once the recovery is made the insurance company has the right to mandatory reconsideration or appeal within a set time period. If the reconsideration or appeal is successful recoveries are refunded to the insurance company.
European Social Fund (ESF) repayments
The ESF Audit Authority is required to provide opinions on the 2014 to 2020 ESF programme. This is largely based on the level of errors identified during the audit of claims submitted by projects to the Managing Authority of the ESF England programme (on behalf of DWP). If this exceeds the EU-defined 2% tolerance error rate, the audit opinion is defined as ‘qualified’ by the ESF Audit Authority, with the risk that the EU can impose a financial correction. The 2022 to 2023 rate was 0.4%, (0.3% for 2021 to 2022), a risk remains that the 2% error tolerance level may be breached in future years.
The Rent Service employee pensions
The Rent Service transferred from DWP to the Valuation Office Agency on 1 April 2009. The Rent Service employed around 400 staff, who were members of the Local Government Pension Scheme, following the transfer they could continue to participate in the scheme. Whilst the scheme is currently balanced, if there is a pension deficit DWP will be liable to meet the shortfall, it is not practical to disclose an estimate of the financial effect or the timing of any outflow.
Compensation claims
Compensation payments may become due because of claims against DWP by staff and members of the public. Claims relate to employment tribunal, personal injury and Civil Service Appeals Board cases. There is significant uncertainty around the estimated liability and the timing of payments. This uncertainty can fluctuate based on factors such as medical evidence received, witness statements and whether claims proceed to trial or are settled early. Therefore, it is not practical to disclose an estimate of the financial effect or the timing of any outflow.
Dilapidation liabilities for leased property
The Department is obligated to reimburse some Landlords for any dilapidations incurred during DWP’s tenure on property leased from them. The timing and amount of these liabilities is presently unquantifiable. Where it has been established that an outflow of resources will be required to settle an obligation and a reliable estimate can be made of the amount of the obligation, the amount is recognised in the dilapidations provision.
Document and Data Management Services (DDMS) Indemnity
The DDMS Contract delivers a business critical service for post opening, scanning, email ingestion and indexing across DWP. The Department have extended the contract to allow sufficient time to transition the services to a replacement contract. In the unlikely event that TUPE will not apply at the end of the current contract, the indemnity protects the supplier against redundancy costs, creating a contingent liability with a value of c£1.9 million. The likelihood of utilising the indemnity is low, as TUPE is expected to apply and is being actively managed, so the staff are expected to transfer to the new contract.
Capital Diminution
Universal Credit regulations set out rules for how much capital a claimant can have and still be eligible for the benefit. Where a claimant has capital over this limit and has not declared it, this can result in an overpayment. In working out the value of the overpayment, the Department considers how that capital would have reduced had the claimant used it to support themselves. The process for calculating that is called diminution.
In some historic UC capital overpayments, the Department identified that the diminution calculation was not correctly applied when calculating the amount of the recoverable overpayment. This has led to some recoverable overpayment values being determined at a higher amount than they should have been. In some cases a refund has been due to the claimant where they had made repayments against this debt. Corrective action continues for the affected cases, as further refunds may be needed the Department is disclosing a contingent liability. Restrictions in data in some cases due to the length of time passed can make it difficult to estimate the value of any potential future refunds which could be owed; as a result this liability is not quantified.
21. Related party transactions
DWP sponsors the arm’s length bodies listed in this report. These include three public corporations: Pension Protection Fund, National Employment Savings Trust and Office for Nuclear Regulation.
In addition, the Department had a significant number of transactions with other government departments. Most of these transactions have been with HM Revenue and Customs, Cabinet Office, Department for Communities - Northern Ireland, Ministry of Justice, Office for National Statistics, Scottish Government and HM Treasury. The Department also has transactions with other public bodies such as local authorities and NHS Foundation Trusts.
During the year the Department also entered into transactions worth £22.6 million with Credera Limited, a related party of an Executive Director. The transactions related to the purchase of services for digital transformation and are conducted at an arm’s length basis. As at 31 March 2024, £0.9 million was still owed to Credera Limited and included in the Department’s accruals.
No minister, board member or other related parties has undertaken any material transactions with the Department during the year. A register of interests for DWP’s board members and a list of ministerial board members’ interests are published on GOV.UK
Details of remuneration for key management personnel can be found in the remuneration and staff report within the Accountability report.
22. Events after the reporting period
There have been no events after the reporting period.
This Annual Report and Accounts was authorised by the Accounting Officer for issue on the date of the Comptroller and Auditor General’s audit certificate.
Annex 1
(This information is not subject to audit)
Disaggregated information on arm’s length bodies
DWP’s departmental family is shown within the Accountability report, the following bodies are those within DWP’s accounting boundary for 2023 to 2024 that contribute to the departmental group.
| Bodies | Total operating income £000 | Total operating expenditure £000 | Net expenditure for the year (including finance) £000 | Number of permanently employed staff | Staff costs | Number of other staff | Staff costs |
|---|---|---|---|---|---|---|---|
| Health and Safety Executive | (111,478) | 266,581 | 188,540 | 2,776 | 182,609 | 78 | 10,009 |
| The Pensions Ombudsman | – | 16,765 | 16,784 | 157 | 10,201 | – | – |
| The Pensions Regulator | – | 99,633 | 99,083 | 856 | 69,076 | 135 | 6,209 |
| The Money and Pensions Service | – | 164,595 | 164,623 | 459 | 36,219 | 24 | 2,940 |
| Total | (111,478) | 547,574 | 469,030 | 4,248 | 298,105 | 237 | 19,158 |
| Health and Safety Executive £000 | The Pensions Ombudsman £000 | The Pensions Regulator £000 | The Money and Pensions Service £000 | |
|---|---|---|---|---|
| Total operating income | (111,478) | – | – | – |
| Total operating expenditure | 266,581 | 16,765 | 99,633 | 164,595 |
| Total Net Operating Expenditure | 155,103 | 16,765 | 99,633 | 164,595 |
| Finance Income | – | – | (703) | – |
| Finance Expense | 33,437 | 19 | 153 | 28 |
| Net Expenditure for the Year | 188,540 | 16,784 | 99,083 | 164,623 |
All tabled information was correct and accurate as at the approval date of the accompanying Annual Report and Accounts.
Also included within the departmental family are:
- Industrial Injuries Advisory Council (staff and costs are included in DWP’s core department figures)
- Social Security Advisory Committee (staff and costs are included in DWP’s core department figures)
- Disabled People’s Employment Corporation (GB) Ltd (entered voluntary liquidation in 2017 and was dissolved in June 2024)
- Remploy Pension Scheme Trustees Ltd is registered on Companies House as a dormant company. The pension liability belongs to DWP and is shown in Note 18.
The following are arm’s length bodies of DWP outside its accounting boundary:
- Office for Nuclear Regulation
- Pension Protection Fund
- National Employment Savings Trust Corporation
-
This figure cannot be directly compared to the spending to support people with a disability or health condition disclosed in the 2022 to 2023 Annual Report of £65.2 billion. This is due to the use of a broader Housing Benefit (HB) disability definition in 2023 to 2024 which includes disabled and carers HB expenditure in addition to incapacity expenditure. This change has been made to be consistent with the definition used in DWP’s Expenditure and Caseload tables and associated briefing. ↩
-
For further information see The Government Efficiency Framework – GOV.UK (www.gov.uk) ↩
-
DWP commercial teams work to detailed guidance covering the identification, measurement and reporting of savings. This guidance reflects the guidance issued by the Government Commercial Function, last updated in July 2023. ↩
-
Restart Scheme statistics to April 2024 – GOV.UK (www.gov.uk) ↩
-
The Evaluation of the Restart Scheme – GOV.UK (www.gov.uk) ↩
-
Progress in implementing Universal Credit - NAO report. Progress in implementing Universal Credit (parliament.uk) ↩
-
For an explanation of the Barnett formula see Devolved administration funding and the Barnett formula (gov.uk) ↩
-
Reducing Parental Conflict programme 2018 to 2022: an evaluation of the effects of interventions – GOV.UK (www.gov.uk) ↩
-
Workplace pension participation and savings trends of eligible employees: 2009 to 2022 – GOV.UK (www.gov.uk) ↩
-
The table includes complaints about the Pension Protection Fund (PPF) but excludes complaints about providers as they are responsible for managing complaints about their service. DWP and its associate bodies play no role in considering or responding to such complaints (which escalate directly to the ICE Office). ↩
-
This figure differs from the 2021 to 2022 “Cleared By ICE” figure previously reported which included provider, NISSA and NI CMS cases (212 cases) ↩
-
Figures include DWP and other relevant organisations. For a breakdown of complaints by organisation see UK Government Departments and Agencies tables 2022 to 2023 published on the PHSO website ↩
-
The figure excludes financial redress paid for loss of statutory entitlement because it is not an extra cost arising from maladministration, but payment of benefit that should have been made anyway. ↩
-
The term “maladministration” is not defined but is sometimes used to describe when the Department’s actions or inactions result in a customer experiencing a service which does not match the Department’s aims or the commitments it has given. It applies to situations in which DWP has not acted properly or provided a poor service. For example: wrong advice, discourtesy, mistakes and delays. ↩
-
Number of earnings details successfully retrieved from HM Revenue and Customs’ Real Time Information system. ↩
-
RTI disputes can be raised manually, or automatically where a claimant’s earnings from RTI are higher than expected. ↩
-
RTI disputes processed and logged as completed within the Financial Year. ↩
-
More complex RTI disputes are processed by the specialised RTI disputes team, the outcomes of these disputes are not logged in structured data and cannot be reported on at this time. ↩ ↩2
-
In 2022, DWP increased the number of hub sites from 7 to 10, through designating 3 existing back‑office sites as hubs. The hub sites are used by a number of business functions; however, the majority are predominantly used by those in corporate function roles with a smaller number used predominantly by those in service delivery roles. ↩
-
An overpayment happens when people are paid too much benefit, which happens in instances where fraud is being committed, where DWP has made an error or the customer has made an error. An underpayment happens when people are not paid enough benefit, which happens in instances where DWP has made an error, classified as official error. ↩
-
Most benefits are measured across Great Britain, but for devolved benefits Scotland is excluded. For PIP and DLA it is England and Wales only. ↩
-
Crime in England and Wales, Appendix tables – year ending December 2023 ↩
-
Annual Report and Accounts 2019/20 (print-ready PDF) (publishing.service.gov.uk) ↩
-
Data for each year held in separate tables. Crime in England and Wales: Appendix tables – Office for National Statistics (ons.gov.uk) ↩
-
UKCrimeStats.com - The Leading Independent Crime Data Platform ↩
-
Fraud and Error in Welfare Benefits, 2016 to 2022: British Social Attitudes survey – GOV.UK (www.gov.uk) ↩
-
New YouGov findings show growing number of young adults tempted by insurance fraud (insurancefraudbureau.org) ↩
-
Shepherd, D., Button, M., & Hawkins, C. (2024). The dishonest disposition and everyday economic criminality of the British public [manuscript in preparation] ↩
-
[Reports and Trends Growing Threat of Fraud & Financial Crime](https://www.cifas.org.uk/insight/reports-trends) – Cifas -
Aviva reports 16% rise in application fraud over same period in 2021 – Aviva plc ↩
-
Figures are rounded to the nearest £10 million so totals may not sum due to rounding. Data sourced from Department for Work & Pensions management information ↩
-
Personal information charter – Department for Work and Pensions – GOV.UK (www.gov.uk) ↩
-
Claims where the claimant has participated in the benefit review but has then failed to provide the requested evidence, subsequently having their claim terminated, and there was no previous suspicion around the area the evidence was requested for, are categorised as fraud due to ‘Failure to Provide Evidence’. There is already an adjustment made where DWP looks four months after a claim was terminated to see if there is any evidence that would allow a reclassification of the fraud to a known reason. This year this adjustment was expanded to see if any evidence could be found that would allow the fraud to be removed entirely (for example, evidence of earnings coming through in the month after the benefit was terminated, which would result in a nil award). ↩
-
Note that an improvement in the measurement methodology used to categorise cases where the claimant failed to fully engage with the measurement process has led to the 2022 to 2023 level being restated as 12.7% rather than the originally published figure of 12.8%. ↩
-
Note that the 2023 Spring Budget forecast for the overpayment rate in Universal Credit, as published in the NAO’s Report on Accounts last year, was significantly lower. The rise in the forecast level of overpayments in the 2024 Spring Budget is partly due to improvements in DWP’s forecasting model; and partly due to the final out-turn for the 2022 to 2023 financial year being higher than had been anticipated from early results observed three-quarters through the sampling exercise which informs the annual published National Fraud and Error Statistics. ↩
-
All figures supplied are still subject to DEFRA Greening Government Commitments quality assurance checks, which will follow later in 2024 to 2025. ↩
-
Figures include End User Computing laptop and desktop devices only. 2022 to 2023 data restated due to a change in methodology. ↩
-
2021 to 2022 and 2022 to 2023 data restated due to a change in methodology. ↩
-
Waste expenditure figures include waste disposal contracts, specialist waste arising and the purchase of licenses for waste. ↩ ↩2
-
The Pensions Ombudsman is a single public body which supports the two legally separate roles of the Pensions Ombudsman and the Pensions Protection Fund Ombudsman. Both Ombudsman roles are held by the same person. A further body, the Disabled People’s Employment Corporation (GB) Ltd, entered members’ solvent liquidation in October 2017 was due to be dissolved in June 2024. ↩
-
Excluding public corporations which fall outside the Department’s accounting boundary. ↩
-
To calculate the pension benefits accrued during the year, DWP first takes the real increase in pension and multiplies it by 20 and adds the real increase in any lump-sum. Then it subtracts the contributions made by the individual. The real increase excludes increases due to inflation or any increase or decrease due to a transfer of pension rights ↩
-
Totals may not sum due to rounding on pension and totals column ↩
-
The pension benefits of any members affected by the public service pensions remedy which were reported in 2022 to 2023 on the basis of alpha membership for the period between 1 April 2015 and 31 March 2022 are reported in 2023 to 2024 on the basis of PCSPS membership for the same period. ↩
-
CETV at the end of 2022 to 2023 has been re-calculated using updated rates effective at 31 March 2023 as provided by the Government Actuary’s Department (GAD). This has led to an increase in the CETV at 31 March 2023 from the value disclosed in the prior year’s accounts. ↩
-
Re-stated amount. Disclosed as £17,442 in 2022 to 2023 ↩
-
To calculate the pension benefits accrued during the year, DWP first takes the real increase in pension and multiplies it by 20 and adds the real increase in any lump-sum. Then it subtracts the contributions made by the individual. The real increase excludes increases due to inflation or any increase or decrease due to a transfer of pension rights. ↩ ↩2
-
Totals may not sum due to rounding on pension and totals columns ↩ ↩2
-
Sophie Dean and Katherine Green job share, working 0.6 FTE each ↩
-
Taking account of inflation, the CETV funded by the employer has decreased in real terms ↩ ↩2
-
How the public service pensions remedy affects your pension – GOV.UK (www.gov.uk) ↩
-
Value for highest paid director in 2022 to 2023 was £0, therefore % change undefinable ↩
-
CETV at the end of 2022 to 2023 has been re-calculated using updated rates effective at 31 March 2023 as provided by the Government Actuary’s Department (GAD). This has led to an increase in the CETV at 31 March 2023 from the value disclosed in the prior year’s accounts. ↩
-
The pension benefits of any members affected by the public service pensions remedy which were reported in 2022 to 2023 on the basis of alpha membership for the period between 1 April 2015 and 31 March 2022 are reported in 2023 to 2024 on the basis of PCSPS membership for the same period. ↩
-
How the public service pensions remedy affects your pension – GOV.UK (www.gov.uk) ↩
-
How the public service pensions remedy affects your pension – GOV.UK (www.gov.uk) ↩
-
The figures in the table above show the average number of whole-time equivalent people employed during the year, in the Performance report and the Accountability report the Department discloses both the number of whole-time equivalent people employed at the end of the year (as at the 31 March) and the number of actual people (rather than whole-time equivalents). ↩
-
All of the compulsory redundancies relate to Inefficiency Dismissal With Compensation (IDWCs)cases. ↩
-
This figure includes the voted non-budget amount of £4.66 billion ↩
-
HM Treasury’s Managing Public Money ↩
-
HM Treasury’s Managing Public Money (with annexes) ↩
-
Compensation Recovery – Liability revised after Supply Estimate submission ↩
-
Legal Cases – Liability revised after Supply Estimate submission ↩
-
DDMS – Liability revised after Supply Estimate submission ↩
-
NEST – Remote Contingent Liability ↩
-
SMI loans moved from loans to other bodies to receivables. Loans to other bodies restated in 2022 to 2023 from (163,184) to (139,500). Receivables restated from 771,121 to 754,943. ↩
-
Difference between cash and cash equivalents at the end of the period and the cash reported in the SoFP is the overdraft contained within Note 15. ↩
-
2022 to 2023 figures have been restated to reflect the restructuring of People Capability and Place to People and Capability, and Corporate Transformation. ↩
-
2023 to 2024 includes £5 million HSE expenditure relating to 2022 to 2023. ↩
-
In total in 2023 to 2024 the Department made £10.4 billion Cost of Living Payments (2022 to 2023: £8.3 billion). Social Fund Expenditure includes £2.6 billion (2022 to 2023: £2.6 billion) relating to Pensioner Cost of Living Payments paid alongside their Winter Fuel Payment. ↩ ↩2
-
Credit balance due to recoveries of overpayments following scheme end. ↩
-
Note 14 includes non-cash expenditure (note 6) and donated assets (note 8) impairment ↩
-
Land and buildings additions value includes upwards modifications of £183m relating to lease end date extensions, rent reviews and capitalised dilapidations provisions ↩
-
Accruals and deferred income, capital payables and accruals, trade payables and lease obligations ↩
-
The two additional groups still to be included represent a) those who become newly eligible to the State Pension – due to an HRP adjustment they will attain minimum qualification status and b) those inheriting State Pension due to added HRP. ↩
-
HRP error rates found in subsequent Fraud and Error samples since 2021 to 2022 show sufficient similarity across the years which do not materially impact the estimate. ↩
-
A scan of the HM Revenue and Customs National Insurance (NPS) system was developed with criteria that filtered the scan to identify potential cases missing HRP from their National Insurance records. ↩
-
Cases missing HRP are expected to be most similar to CAT BL cases from the State Pension Underpayment LEAP exercise. ↩
-
The 5,000 simulations produced by the Monte Carlo allows DWP to summarise the uncertainty in the forecast. Monte Carlo is a statistical method that allows DWP to simultaneously randomly vary the most uncertain assumptions between a low and high range to measure the impact. ↩
-
Monetary estimates in table 2 are shown in pre-discounted values, with all values rounded to the nearest 10,000 or £100. ↩
-
The central assumption represents how each element has been treated in the provision posted in the Department’s accounts for missing HRP. The low and high scenarios inform Monte Carlo simulations with high take up scenarios held constant with the central as take up higher than 90%/75% is not considered to be plausible with available evidence for live take up showing a plateauing. ↩
-
The low and high estimates are produced using Monte Carlo simulations. The min and max estimates are produced by setting all assumptions to their minimum and maximum values at the same time, respectively. These values are all expressed in discounted terms. ↩
-
Benefit expenditure stated within this note is based on the latest available forecast expenditure for 2023 to 2024, at the time the estimate was prepared. For this reason, it does not agree to that seen in the Statement of Comprehensive Net Expenditure (SoCNE) of £268.5 billion, or the Statement of Outturn against Parliamentary Supply (SOPS) of £266.0 billion. The difference between these values is due to disaggregation in the SOPS between DEL and AME, resource and capital expenditure. ↩
-
DWP defines fraud as where claimants deliberately claim money they aren’t entitled to. The Department splits error into two categories: claimant error, which occurs when claimants provide inaccurate information, and official error, which occurs when the Department processes information incorrectly or fail to apply rules. ↩
-
Benefit recovery is through the Department’s debt management function and local authorities. ↩
-
Money recovered this year comprises in-year 2023 to 2024 figures for directly administered benefits plus figures for Housing Benefit for the period October 2022 to September 2023. Further information can be found at www.gov.uk by searching for Fraud and Error in the Benefit System 2023 to 2024. ↩
-
Housing Benefit is a random sample stratified by local authority ↩