How low income is measured in households below average income
Updated 26 September 2016
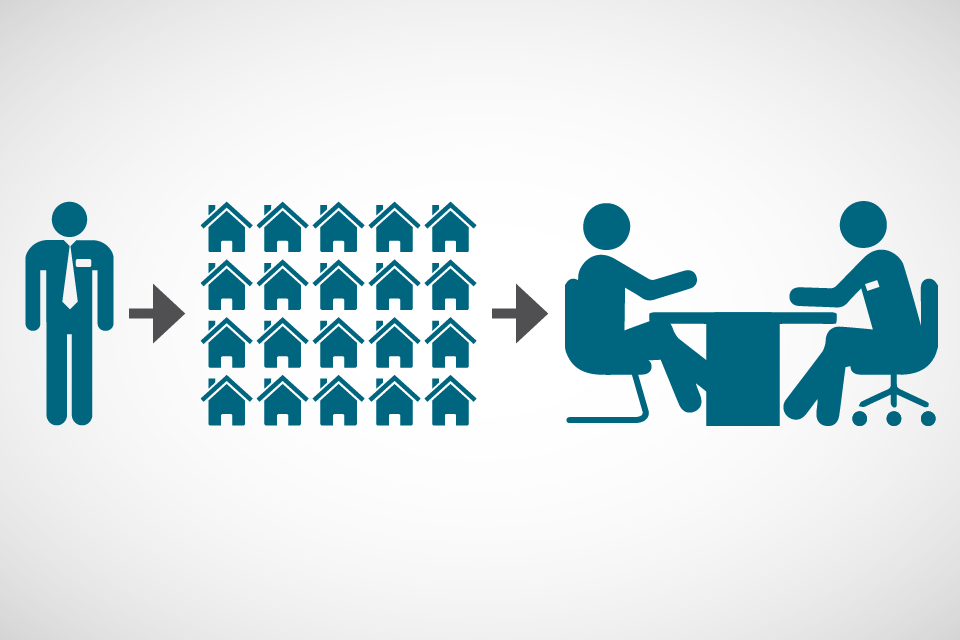
1. The Family Resources Survey is carried out with a sample of approximately 20,000 households around the UK

Symbols representing an interviewer, a sample of households and an interview setting
Questions
Questions on household characteristics, earnings, benefits and housing costs are asked in an interview.
Sample
A selection of the overall population. Twenty thousand households give results we can be confident reflect the whole population without surveying everyone in the UK.
Key definitions
Household
One person living alone or a group of people (not necessarily related) living at the same address who share cooking facilities and share a living room, sitting room, or dining area. A household will consist of one or more benefit units/families.
Family or benefit unit
A single adult or a couple living as married and any dependent children.
2. Income data undergoes equivalisation
Equivalisation allows comparisons to be made of individuals of different ages from different sized households.
| Step of equivalisation | Example household: a couple | Example household: a couple with 2 children under 14 | Example household: a single person |
|---|---|---|---|
| Each household member is given a standard weighting which is summed together | 0.67 (first adult) + 0.33 (second adult) = 1 | 0.67 (first adult) + 0.33 (second adult) + 0.2 (child under 14) + 0.2 (child under 14) = 1.4 | 0.67 (first adult) |
| Weekly net income before equivalisation | £300 ÷ 1 | £300 ÷ 1.4 | £300 ÷ 0.67 |
| Weekly net income after equivalisation | £300 | £214 | £448 |
| What equivalisation means for the household | A couple with no children is the reference point | Income has decreased as a couple with children need a higher income to enjoy the same living standard | Income has increased as a single person needs a lower income to enjoy the same living standard |
Key
| Individual | Score value |
|---|---|
| First adult | 0.67 |
| Other adult | 0.33 |
| Children 14 yrs and over | 0.33 |
| Children under 14 yrs | 0.2 |
3. Housing costs can be considered
Household income
This includes benefits and earnings, and after tax deductions.
Before housing costs (BHC)
Housing costs (such as rent and mortgage interest payments) have not been deducted.
After housing costs (AHC)
Housing costs (such as rent and mortgage interest payments) have been deducted.
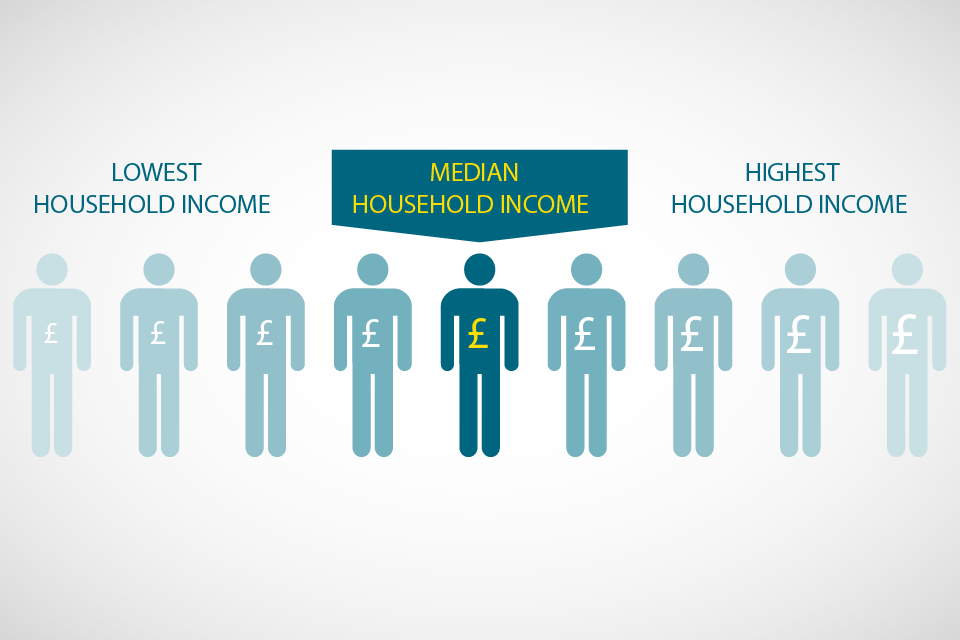
4. The median household income is used to find the number of people in low-income households

Symbols representing an scale of incomes, ranging from low to high, with the median value highlighted
Low income threshold = 60% of median
Relative vs absolute low income
Relative low income: comparison to median of the current year.
Absolute low income: comparison to median of the 2010/11 year which allows comparisons over time.
Threshold
A threshold for low income is used for comparing sections of the income distribution over time.
Why not the mean average?
Mean: sum of all incomes, divided by the number of people whose incomes were included.
The median income is the amount which divides the income distribution into 2 equal groups, half having income above that amount, and half having income below that amount.
In unequal distributions, the mean is likely to be influenced by high values, so it does not reflect the experience of most individuals. The median is not affected by a few very high values.
5. Inequality measures are produced
It is important to measure inequality as it shows how income is distributed across the population of the UK.
The Gini coefficient measures inequality: the distribution of household income across the population of the UK. The higher the number, the greater the inequality.
If every household had an equal share of the total income the Gini coefficient would be 0.
A higher Gini coefficient indicates greater inequality (the maximum Gini coefficient is 100).
6. Confidence intervals show the uncertainty around the estimates
As a sample of the population is used, estimates of household income are produced. As a result, there is uncertainty around these figures.
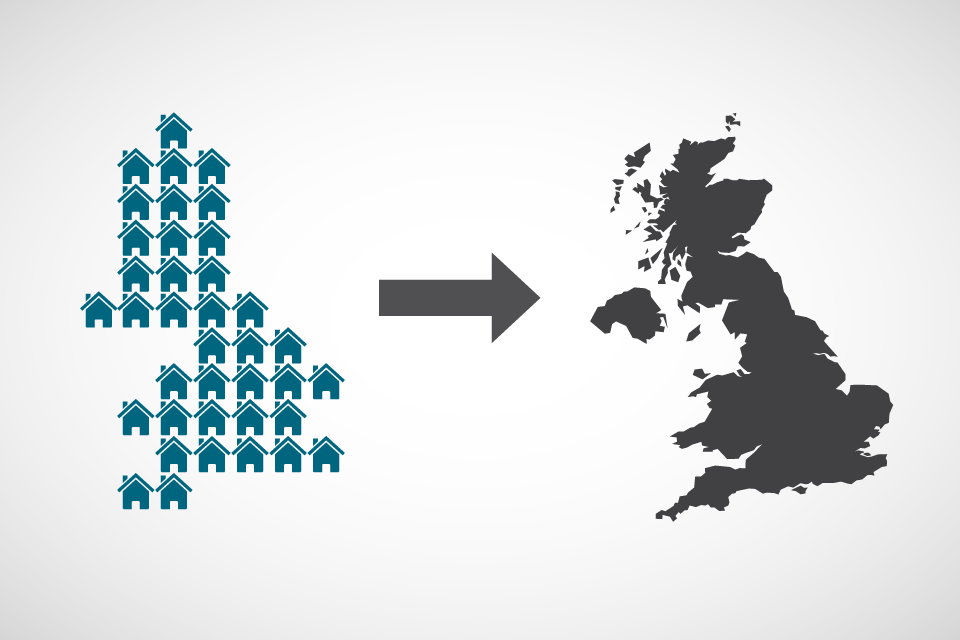
The results from the 20,000 households around the UK are scaled up to represent UK results.

Graphic representing how a sample of households across the UK adds up to give a picture of the UK as a whole
A confidence interval indicates the extent to which an estimate may differ from the true value.
Big confidence interval = less precise estimate
| < Lower bound: 9.5% | Estimate: 10% | Upper bound: 10.6% > |
Small confidence interval = more precise estimate
| Lower bound: 9.9% > | Estimate: 10% | < Upper bound: 10.1% |
More information can be found through the HBAI statistics collection. For enquiries please contact the HBAI team at: team.hbai@dwp.gsi.gov.uk
