Asylum
Published 23 February 2017
Valid: 23 February 2017 to 24 May 2017
Data relate to the calendar year 2016 and all comparisons are with the calendar year 2015, unless indicated otherwise.
Back to Immigration statistics October to December 2016 content page.
This is not the latest release. View latest release.
1. Key facts
Asylum applications in the UK from main applicants decreased by 7% to 30,603 in the year 2016, the first annual fall in asylum applications since 2010 (17,916). Numbers of asylum applications in the last two quarters of 2016 (7,146 in July to September and 7,419 in October to December) were considerably lower than in the same two quarters of 2015 (10,231 in July to September and 10,196 in October to December).
In 2016, the largest number of applications for asylum came from nationals of Iran (4,192), followed by Pakistan (2,857), Iraq (2,666), Afghanistan (2,341), Bangladesh (1,939), Albania (1,488), and India (1,488). Most applications for asylum are made by people already in the country (87% of applications in 2016) rather than immediately on arrival in the UK at a port.
There were 7,419 asylum applications made between October and December 2016. Additional matching of cases shows that, of these, around 10% were transferred from Calais as part of a UK operation.
There were 3,175 asylum applications from unaccompanied asylum-seeking children (UASC) in 2016, a small (2%) decrease compared to 2015 (3,253). Overall, UASC applications represented 10% of all main applications for asylum.
Of the 24,984 initial decisions on asylum applications from main applicants, 34% were grants of asylum or an alternative form of protection, compared to 40% in the previous year. A separate Home Office analysis shows that for the years 2012 to 2014, on average 36% of decisions were granted initially, but this proportion rose to 49% after appeal.
Grant rates vary considerably between nationalities. For example, at initial decision, the grant rate for Iranian nationals was 37% (1,455 grants), compared with 12% (286 grants) for Iraqi nationals. Overall, there were 8,466 grants at initial decision for all nationalities in 2016, which corresponds to the grant rate of 34%.
There were 1,591 grants of asylum or an alternative form of protection to Syrian main applicants at initial decision in 2016. The grant rate for Syrian applicants was 86%, but some of those not granted will have been transferred to have their case assessed by another EU member state, and other applicants may have been found not to be Syrian following investigation. An additional 4,369 Syrian nationals (including dependants) were granted humanitarian protection under the Syrian Vulnerable Persons Resettlement Scheme (VPRS) 2016. Since this scheme began in 2014, a total of 5,706 people have been resettled.
Including dependants, the UK had the sixth highest number (39,000) of asylum applications within the EU in 2016. Germany (692,000), Italy (117,000) and France (83,000) were the 3 EU countries that received the highest number of asylum applications, together accounting for 75% of asylum applications in the EU in that period.
2. Asylum applications and initial decisions for main applicants
| Year | Total applications | Total initial decisions | Granted (1) | Granted as a % of initial decisions | Refused | Refused as a % of initial decisions |
|---|---|---|---|---|---|---|
| 2012 | 21,843 | 16,774 | 6,059 | 36% | 10,715 | 64% |
| 2013 | 23,584 | 17,543 | 6,542 | 37% | 11,001 | 63% |
| 2014 | 25,033 | 19,782 | 8,150 | 41% | 11,632 | 59% |
| 2015 | 32,733 | 28,622 | 11,421 | 40% | 17,201 | 60% |
| 2016 | 30,603 | 24,984 | 8,466 | 34% | 16,518 | 66% |
| Change: latest year | -2,130 | -3,638 | -2,955 | - | -683 | - |
| Percentage change | -7% | -13% | -26% | - | -4% | - |
2.1 Table notes
Source: Home Office, Immigration Statistics October to December 2016, Asylum table as 01 q (Asylum volume 1).
(1) Granted includes grants of asylum, humanitarian protection, discretionary leave, leave to remain under family life or private life rules, leave outside the rules, and UASC leave.
3. Long-term trends in asylum applications for main applicants
The chart below shows the annual number of asylum applications made since 2001.
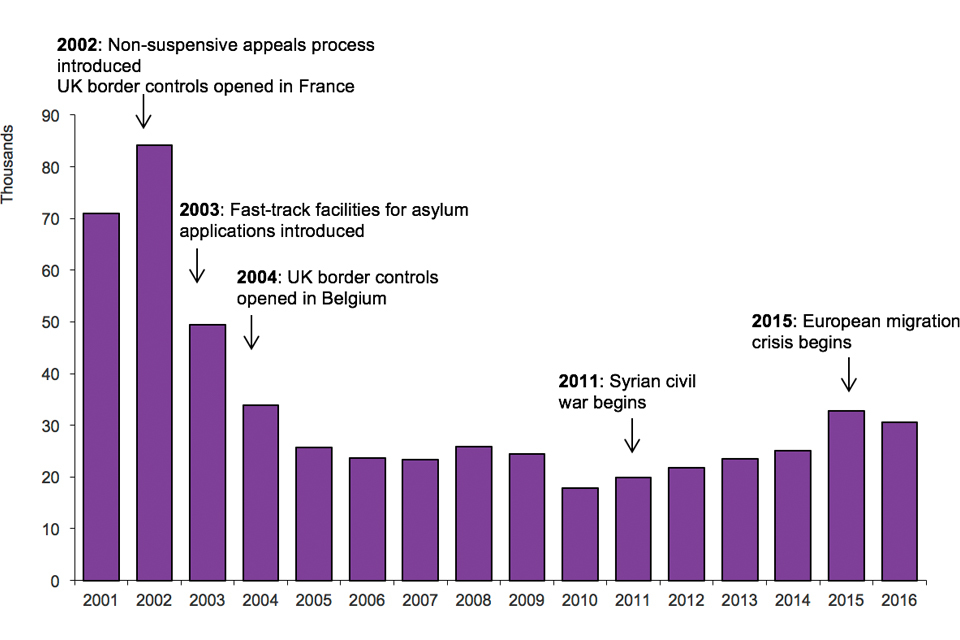
The chart shows the number of asylum applications made between 2001 and the latest calendar year. The data are available in table as 01.
3.1 Chart notes
Source: Home Office, Immigration Statistics October to December 2016, Asylum table as 01 (Asylum volume 1).
4. Nationalities applying for asylum
In 2016, the largest number of applications for asylum came from nationals of Iran (4,192), followed by Pakistan (2,857), Iraq (2,666), Afghanistan (2,341), Bangladesh (1,939), Albania (1,488), and India (1,488).
4.1 Countries with highest number of applications for asylum in the UK, 2016 compared to 2015 (excluding resettlement cases)
| Ranking in 2016 (2015) | Nationality | 2015 | 2016 | Grant rate based on initial decisions (%) |
|---|---|---|---|---|
| 1 (2) | Iran | 3,242 | 4,192 | 37 |
| 2 (5) | Pakistan | 2,470 | 2,857 | 14 |
| 3 (7) | Iraq | 2,216 | 2,666 | 12 |
| 4 (6) | Afghanistan | 2,261 | 2,341 | 35 |
| 5 (9) | Bangladesh | 1,110 | 1,939 | 6 |
Table notes
Source: Home Office, Immigration Statistics October to December 2016, Asylum table as 01 q (Asylum volume 1).
(1) Grant rates relate to the number of grants for asylum, humanitarian protection, discretionary leave, or other grants of stay, as a proportion of all initial decisions made in 2016.
(2) Initial decisions do not necessarily relate to applications made in the same period and exclude the outcome of appeals or other subsequent decisions.
World events have an effect on who applies for asylum at any particular time. For example, the number of applicants from Syria increased sharply following the outbreak of the Syrian civil war in early 2011. The 1,409 applications for asylum from Syrian nationals (excluding resettlement cases) in 2016 compares with 125 in the year ending March 2011.
Grant rates for asylum and other forms of protection vary considerably between nationalities. For example, at initial decision, the grant rate for Iranian nationals was 37% (1,455 grants), compared with 12% (286 grants) for Iraqi nationals. Overall, there were 8,466 grants at initial decision for all nationalities in 2016, which corresponds to a grant rate of 34%.
In 2016, there were 1,591 grants of asylum or an alternative form of protection to Syrian nationals, at initial decision (a grant rate of 86%). There were an additional 4,369 people, including dependants, who were granted humanitarian protection under the Syrian VPRS during this period. Refused asylum applications for Syrians will include cases that have been transferred to be assessed by another EU member state (third country), and may include some where it was found that the applicant did not hold Syrian nationality.
5. Resettlement
In addition to those asylum seekers who apply in the UK, resettlement schemes are offered to those who have been referred to the Home Office by The United Nations Refugee Agency (UNHCR).
On 7 September 2015, an expansion to the existing Syrian VPRS was announced. Through this expansion, it was proposed that 20,000 Syrians in need of protection be resettled in the UK by 2020. A total of 5,706 people have been granted humanitarian protection under the Syrian VPRS since the scheme began, and in 2016, 4,369 people were resettled under the Syrian VPRS across 206 different local authorities. Half (50%) of those resettled under the Syrian VPRS were under 18 years old (2,180), and around half (47%) were female (2,072).
These data are available in Asylum table as_20_q (volume 4 of the Asylum data tables).
6. Family reunion visa applications
Family reunion visa applications from dependants of those with refugee status or humanitarian protection in the UK (made under Part 11 of the Immigration Rules) are included in the Visa statistics.
The vast majority of ‘Family: other’ visas relate to family reunion and so the published figures provide a good indication of trends for family reunion cases.
In 2016, there were 6,224 visas granted in the Family:other category, the vast majority of which relate to family reunion. Of the 6,224 grants, the highest number came from Syrian nationals (2,005) seeking to join those with refugee status or humanitarian protection in the UK.
6.1 Entry clearance visas granted by top 5 countries of nationality: Family, other
| Ranking 2016 (2015) | Nationality | 2015 | 2016 | Change: latest year | Percentage change |
|---|---|---|---|---|---|
| *Total | 4,887 | 6,224 | +1,337 | 27% | |
| of which: | |||||
| 1 (1) | Syria | 1,806 | 2,005 | +199 | 11% |
| 2 (3) | Eritrea | 459 | 961 | +502 | 109% |
| 3 (2) | Sudan | 554 | 858 | +304 | 55% |
| 4 (4) | Iran | 360 | 564 | +204 | 57% |
| 5 (6) | Sri Lanka | 250 | 245 | -5 | -2% |
Table notes
Source: Home Office, Immigration Statistics October to December 2016, Visas table vi 06 q f (Visas volume 3).
Details of the application process and eligibility criteria for family reunion visas are given at Family reunion guidance.
7. Unaccompanied asylum-seeking children
A UASC is a person under 18, or who, in the absence of documentary evidence establishing age, appears to be under that age, is applying for asylum in his or her own right and has no relative or guardian in the United Kingdom.
There were 3,175 asylum applications from UASC in 2016, a 2% decrease compared to 2015 (3,253). Overall, UASC applications represented 10% of all main applications for asylum. UASC applications remain below the peak of 4,060 in the year ending September 2008. The nationalities that lodged the highest numbers of UASC applications in the UK were Afghan (740), Albanian (407) and Eritrean (405). These 3 countries contributed half (49%) of total UASC applications.
There were 1,959 initial decisions relating to a UASC in 2016, slightly (2%) higher than the previous year (1,930). Of these decisions, 35% were grants of asylum or another form of protection, and 43% were grants of temporary leave (UASC leave). In the previous year, 25% of initial decisions were grants of asylum or another form of protection, and 42% were grants of temporary leave. UASC applicants that are refused will include those from countries where it is safe to return children to their families, as well as some applicants who were determined to be over 18 following an age assessment.
8. International comparisons
Figures in this section are based on data supplied by the individual countries to the Intergovernmental Consultations on Migration, Asylum and Refugees (IGC), UNHCR and Eurostat. Not all countries provide the latest data in time for each Immigration Statistics release. Where a figure is unavailable for a given month, we estimate it using the average of the last 3 months available, unless the time series is erratic, when we use the average of the last 12 months.
Including dependants, the total number of asylum applications to the EU in 2016 was an estimated 1,189,000, a decrease of 10% compared to 2015 (1,319,000).
8.1 Top EU countries receiving asylum applications, 2016
(Total number of applications 1,189,000 including dependants; some estimated data)
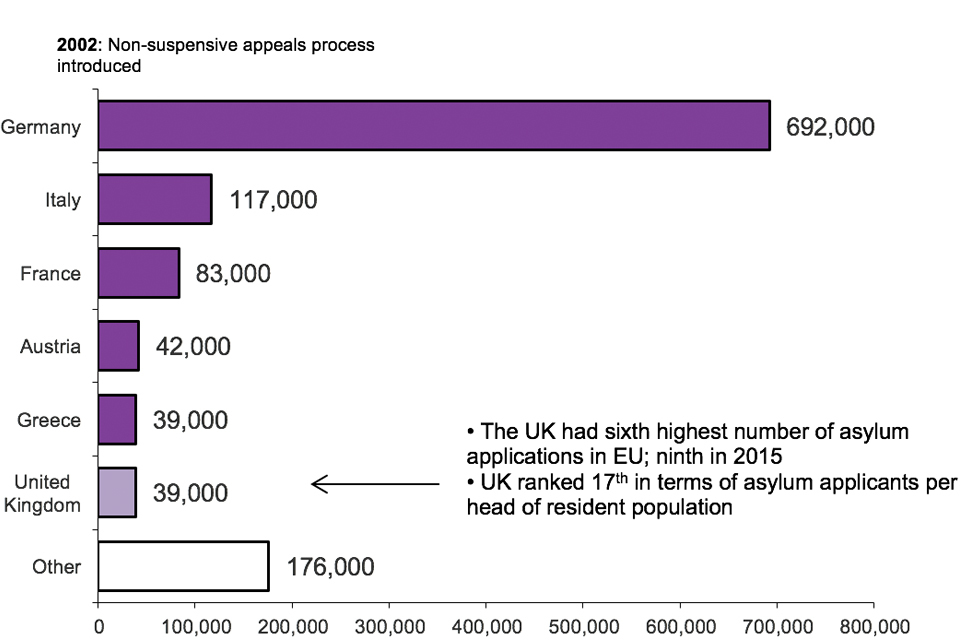
The chart shows the top EU countries receiving asylum applications in 2016. UK had sixth highest; ninth last year. The data are available in table as 07 q.
Chart notes
Source: Home Office, Immigration Statistics October to December 2016, Asylum table as 07 q (Asylum volume 3).
(1) Figures are rounded to the nearest 1,000 and so may not sum to the total.
(2) The estimated figures in this chart are based on data supplied to IGC and UNHCR.
In the third quarter of 2016 (July to September), the latest provisional Eurostat data, Asylum quarterly report show that the non-EU nationalities with the highest number of persons seeking asylum in the EU as a whole were Syrians, Afghans and Iraqis. The highest number of first-time asylum applications in July to September 2016 were registered in Germany (237,430 applications, or 66% of total applications in the EU), followed by Italy (34,560; 10%) and France (20,005; 6%). The UK received 9,205 first-time applications in that three-month period, or 3% of the EU total. Germany received 71,240 applications from Syrians, followed by a further 50,460 from Afghans and 29,945 from Iraqis. These numbers exclude the additional cases accepted through resettlement schemes, such as the Syrian VPRS.
Between July and September 2016, the proportion of positive asylum decisions (for all non-EU nationalities) in Germany was 73% compared with 32% in France and 28% in the UK. The average grant rate for a particular member state will be affected by the nationalities of the people applying for asylum in that country and their respective likelihood of those nationalities being accepted as refugees. When comparing figures for different EU member states, it is important to bear in mind there may also be differences in the collection and reporting methods, as well as differences in procedures, which may influence the comparability of the figures.
In the EU as a whole, the nationality with the highest number of positive decisions was Syrian (109,790) with a grant rate of 98%, followed by Iraqis (17,945; 61%) and Afghans (13,830; 51%). By contrast, only 270 (3%) applications from Albanian nationals were granted refugee status or an alternative form of protection at initial decision.
9. Outcome of asylum applications
The most recent data report on the initial decisions made on asylum applications by the Home Office. However, some decisions will be challenged by appeal to the HM Courts and Tribunals Service (HMCTS), an executive agency of the Ministry of Justice.
The Home Office produces an analysis of applications for whole year cohorts of asylum seekers, in order to calculate the overall success rates following appeal. For most years, this will provide the most complete description of the outcome for asylum seekers; however, for the most recent years some cases will still be outstanding, as not all cases will have had sufficient time to be completed. The analysis therefore only provides a ‘snapshot’ of the recorded outcomes of the group (or cohort) of asylum applicants in any one year, at a particular time. This dataset is updated, in full, annually and is currently available up to 2015.
9.1 Outcome of applications made between 2012 and 2014
The following chart gives an illustration of outcomes in the asylum system in the UK for applications made in the years 2012 to 2014 (inclusive), where the outcome is known.
Indicative flows through the UK asylum system, where outcomes known, 2012 to 2014 data
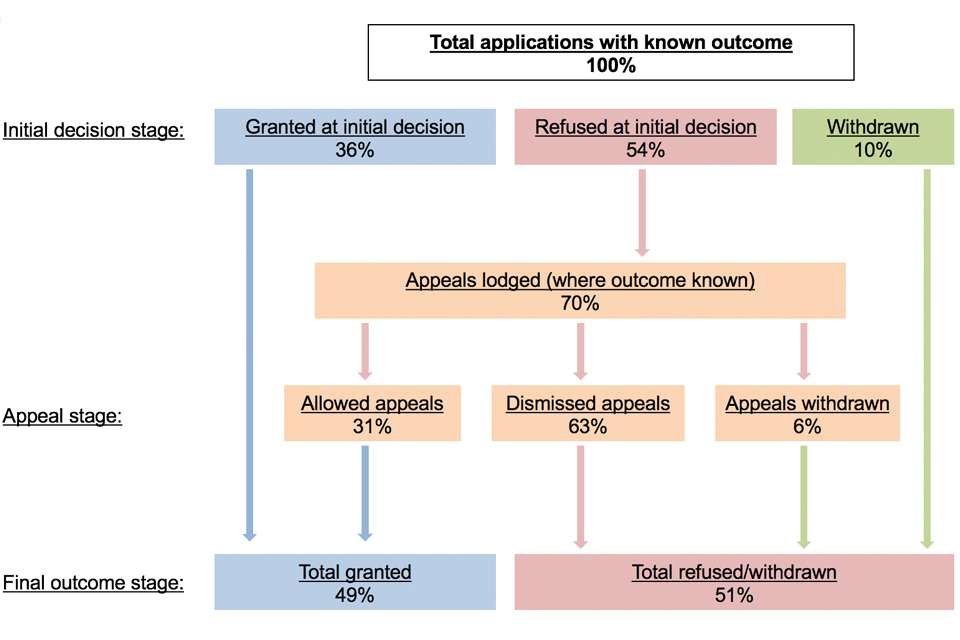
This flow chart shows indicative flows through the UK asylum system, where outcomes known, 2012 to 2014 data.
Chart notes
Source: Home Office, Immigration Statistics October to December 2016, Asylum table as 06 (Asylum volume 2).
(1) Assumes all appeals lodged are as a result of a refused application. Latest data for 2012 to 2014 show 70% of all refusals resulted in an appeal being lodged.
(2) Figures are derived by combining data from the 2012, 2013 and 2014 cohort data from table as 06.
(3) Cases where initial decision or appeal outcomes are unknown are not included in this analysis.
(4) Grant rates shown here relate to the outcomes of total applications made in each cohort year, and take withdrawn applications into account. They are therefore not directly comparable with the annual grant rates shown in the earlier table ‘Asylum applications and initial decisions for main applicants’, which gives grants as a percentage of total initial decisions made each year.
9.2 Currently recorded outcomes for 2015 applications
The outcomes for the 32,733 main applicants who applied for asylum in 2015, as with previous cohorts, will be updated in subsequent annual reports. However, as at May 2016, it is estimated that 10,319 (32%) main applicants had been granted asylum, humanitarian protection (HP) or discretionary leave (DL), either at initial decision or after appeal; 9,168 (28%) were refused or withdrawn; and 13,246 (40%) were still under consideration and awaiting confirmation of an initial decision or appeal outcome.
Outcome of asylum applications, by year of application
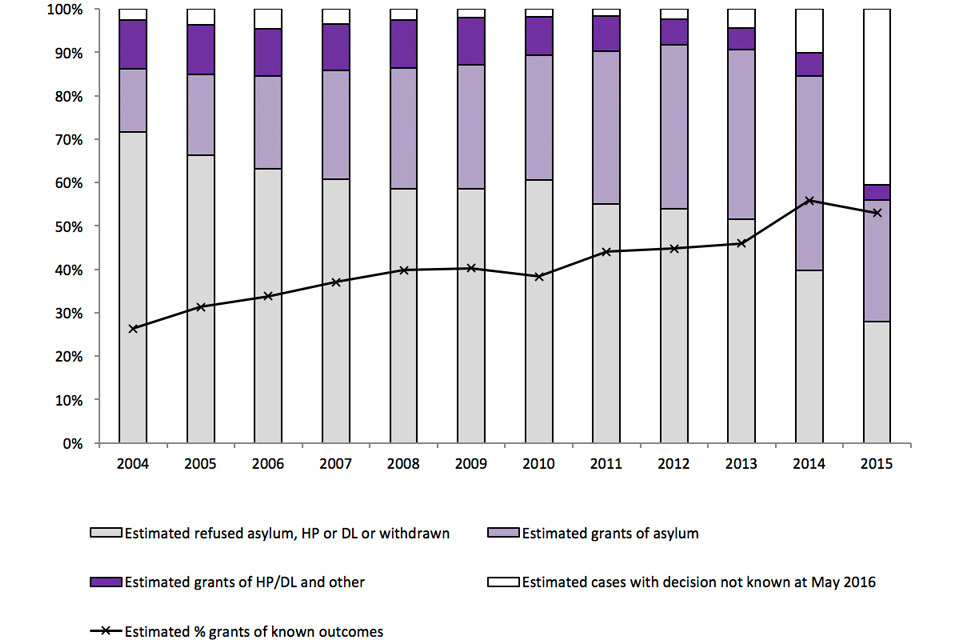
The chart shows the outcome of asylum applications made between 2004 and the latest calendar year as at May 2016. The data are available in table as 06.
Chart notes
Source: Home Office, Immigration Statistics October to December 2016, Asylum table as 06 (Asylum volume 2).
(1) Chart shows the proportion of recorded outcomes of applications made in each year from 2004 to 2015, as at May 2016.
(2) Due to the large variety of routes that an asylum application can take to a final outcome, the analysis of the outcomes of asylum applications in any one year requires interpretation for a small percentage of cases. The proportions and underlying figures for final outcomes of the analysis of applications for the group (or cohort) of applicants in any one year, are therefore estimated.
(3) The proportion of applications awaiting the outcome of an initial decision or an appeal will inherently be lower in earlier years as there has been longer for the cases to be processed than those from more recent years.
The overall proportion of applications granted asylum or a form of temporary protection, either at initial decision or after having an appeal allowed, was estimated to be 26% in 2004; this proportion has steadily increased to 53% of applications made in 2015 (where the outcome is known), as shown in the above chart.
The recorded outcomes of asylum applications made in 2016 are due to be published in August 2017.
10. Support provided to asylum seekers
At the end of 2016, a total of 39,389 asylum seekers and their dependants were being supported in the UK under Section 95 (Immigration and Asylum Act 1999), compared with 34,363 at the end of 2015. The majority (36,626) were supported in dispersed accommodation, with 92% located outside of London. An additional 2,763 were receiving subsistence-only support, with half (50%) of these located in London. Although the total figure has risen since 2012, it remains considerably below that for the end of 2003 (the start of the published data series), when there were 80,123 asylum seekers in receipt of Section 95 support.
10.1 Asylum seekers in receipt of Section 95 support, by local authority, per million population, as at the end of 2016
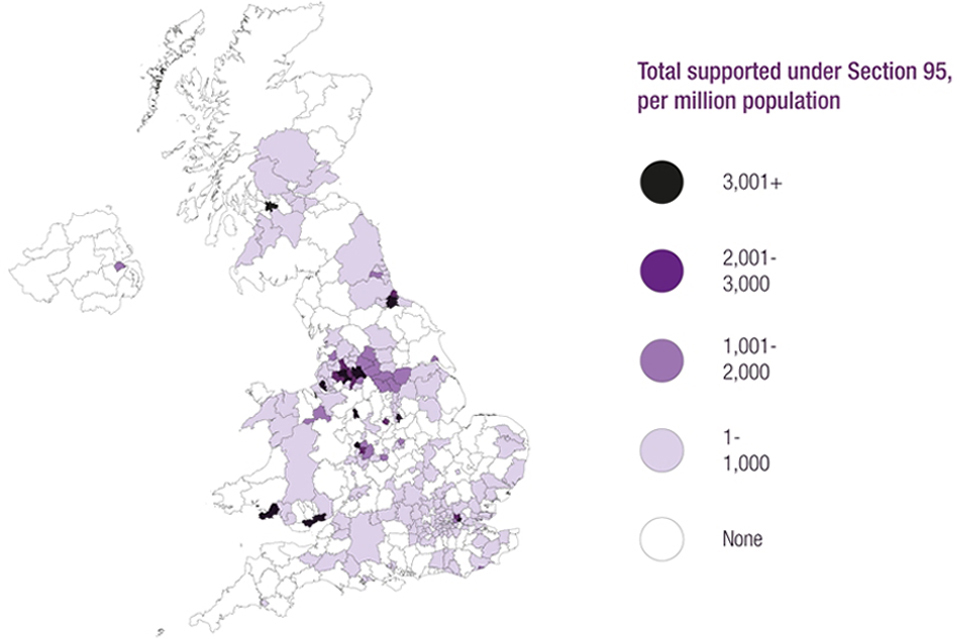
This map shows the number of asylum seekers in receipt of Section 95 support, by local authority, per million population, as at end of 2016.
Chart notes
Source: Home Office, Immigration Statistics October to December 2016, Asylum table as 16 q (Asylum volume 4); population figures sourced from the ONS 2015 mid-year population estimates, published 23 June 2016 Population Estimates for UK, England and Wales, Scotland and Northern Ireland.
The number of asylum seekers in receipt of Section 95 support by local authority, as at the end of each quarter, is available in Asylum table as 16 q (volume 4 of the Asylum data tables).
There were 3,773 failed asylum seekers and their dependants receiving support (under Section 4) at the end of 2016. Failed asylum seekers (main applicants only) receiving support under Section 4 peaked at the end of September 2009 (12,019).
11. Applications pending
At the end of 2016, 24,903 applications (received since April 2006) from main applicants were pending a decision (initial decision, appeal or further review), 6% less than at the end of 2015 (26,409). The number who had been awaiting an initial decision for more than 6 months increased by 143% (from 3,626 to 8,825) while those pending further review decreased by 59% to 3,428.
12. Asylum appeals
HMCTS received 12,235 asylum appeals from main applicants in 2016, a 14% fall compared with the previous year (14,242).
Appeal determinations have increased from 9,224 in 2015 to 12,304 in 2016. These figures remain below the peaks in the number of appeals and the number of determinations in the year ending June 2010, which were 16,560 and 16,032 respectively. In 2016, the proportion of determined appeals that were dismissed was 54%, while 41% of appeals were allowed and 5% were withdrawn.
13. Returns
In 2016, there were 2,274 enforced returns of people who had previously sought asylum (including dependants), down 37% from the previous year (3,617). In the same period there were 1,172 voluntary returns (excluding returns from detention) of people who had sought asylum at some stage, down 35% from the previous year (1,816). Further information on returns can be found in the Returns topic and figures on asylum returns are available in Returns volumes 1 and Returns volume 3.
14. Age disputes
Some asylum applicants claim to be children but there may be doubts as to whether this is in fact the case. In 2016, 918 asylum applicants had their age disputed and 908 age disputes resolved in the same period. Of those applicants whose age disputes were resolved in 2016, 67% were assessed to be over 18, despite claiming to be a child when initially applying for asylum.
15. Dependants
Including dependants, the number of asylum applications decreased by 4% from 39,968 in 2015 to 38,517 in 2016. This is an average of 1 dependant for every 4 main applicants. In the same period, 6,008 initial decisions were made relating to dependants; of these, 1,467 (24%) were grants of asylum or an alternative form of protection, and 4,541 (76%) were refusals.
16. Data tables
Data referred to here can be found in the following tables:
Asylum vol. 1: tables as 01 to as 02
The following tables are included in this volume:
as 01 Asylum applications and initial decisions for main applicants, by country of nationality
as 01 q Asylum applications and initial decisions for main applicants, by country of nationality
as 02 Asylum applications and initial decisions for main applicants and dependants, by country of nationality
Asylum vol. 2: tables as 02 q to as 06
The following tables are included in this volume:
as 02 q Asylum applications and initial decisions for main applicants and dependants, by country of nationality
as 03 Asylum applications from main applicants, by age, sex and country of nationality
as 04 Asylum applications from main applicants and dependants, by age, sex and country of nationality
as 05 Asylum initial decisions from main applicants, by sex and country of nationality
as 06 Outcome analysis of asylum applications, as at May 2016
Asylum vol. 3: tables as 07 to as 13 q
The following tables are included in this volume:
as 07 Asylum applications received in Europe and elsewhere for main applicants and dependants
as 07 q Asylum applications received in Europe and elsewhere for main applicants and dependants
as 08 Asylum applications received from unaccompanied asylum-seeking children, excluding dependants, by sex and age at time of application
as 08 q Asylum applications received from unaccompanied asylum-seeking children, excluding dependants, by sex and age at time of application
as 09 Initial decisions on asylum applications from unaccompanied asylum-seeking children, excluding dependants, by sex and age at initial decision
as 09 q Initial decisions on asylum applications from unaccompanied asylum-seeking children, excluding dependants, by sex and age at initial decision
as 10 Age disputes raised and resolved for asylum applicants, by country of nationality
as 10 q Age disputes raised and resolved for asylum applicants, by country of nationality
as 11 Asylum main applicants accepted onto the fast-track process, by country of nationality
as 12 Outcomes of asylum main applicants accepted onto the fast-track process
as 13 q Main applicants refused asylum and eligible for the non-suspensive appeals process, by country of nationality
Asylum vol. 4: tables as 14 to as 20 q
The following tables are included in this volume:
as 14 Asylum appeal applications and determinations, by country of nationality and sex
as 14 q Asylum appeal applications and determinations, by country of nationality
as 15 Applications for asylum support, by support type and nationality
as 16 q Asylum seekers in receipt of Section 95 support, by local authority, as at end of quarter
as 17 q Asylum seekers in receipt of Section 95 support, by country of nationality and UK region, as at end of quarter
as 18 q Asylum seekers in receipt of Section 4 or Section 98 support, and decisions to grant Section 4 support
as 19 q Refugees (and others) resettled, including dependants, by country of nationality
as 20 q Refugees (and others) resettled under the Syrian Vulnerable Persons Resettlement Scheme, including dependants, by local authority
17. Background information
This section covers asylum applications, initial decisions, estimated final outcomes, resettlement, UASC, international comparisons, support, appeals, returns and age disputes.
17.1 Migration transparency data webpage
A range of key input and impact indicators are currently published by the Home Office on the Migration transparency data webpage.
