Improving Lives: Helping Workless Families Indicators 2024: Data for 2005 to 2023
Updated 21 May 2024

© Crown copyright 2024
This publication is licensed under the terms of the Open Government Licence v3.0 except where otherwise stated. To view this licence, visit nationalarchives.gov.uk/doc/open-government-licence/version/3 or write to the Information Policy Team, The National Archives, Kew, London TW9 4DU, or email: psi@nationalarchives.gov.uk.
Where we have identified any third party copyright information you will need to obtain permission from the copyright holders concerned.
This publication is available at https://www.gov.uk/government/publications/improving-lives-helping-workless-families-indicators-2024/improving-lives-helping-workless-families-indicators-2024-data-for-2005-to-2023
What you need to know
There are 9 indicators and underlying measures used to track national progress in tackling the disadvantages that affect families and children’s outcomes:
1. Parental Worklessness
2. Parental Conflict
3. Poor Parental Mental Health
4. Parental Drug and Alcohol Dependency
5. Problem Debt
6. Homelessness
7. Early Years
8. Educational Attainment
9. Youth Employment
The government has a statutory duty to report data annually to Parliament on 2 of the 9 indicators for England only:
1. Parental Worklessness
a. The proportion of children living in workless households
b. The proportion of children living in long-term workless households
2. Educational attainment at Key Stage 4
Read the annual update on these indicators.
Contact Details
helpingworklessfamilies@dwp.gov.uk
DWP Press Office: 0203 267 5129
Feedback is welcome
Indicator 1: Parental Worklessness
Workless households are households where no one aged 16 years or over is in employment. These members may be unemployed or economically inactive. Economically inactive members may be unavailable to work because of family commitments, retirement, study, sickness or disability.
A long-term workless household is a workless household, as defined above, who have been workless for at least 12 months or have never worked (in a paid job). A long-term workless household does not necessarily imply that adults within them have been long-term unemployed. Some adults may have been out of work for 12 months or more but had periods of inactivity such as looking after family or illness during that time.
10% of all children were living in workless households between October and December 2022.
Proportion of children living in workless households (UK), 2006 to 2022
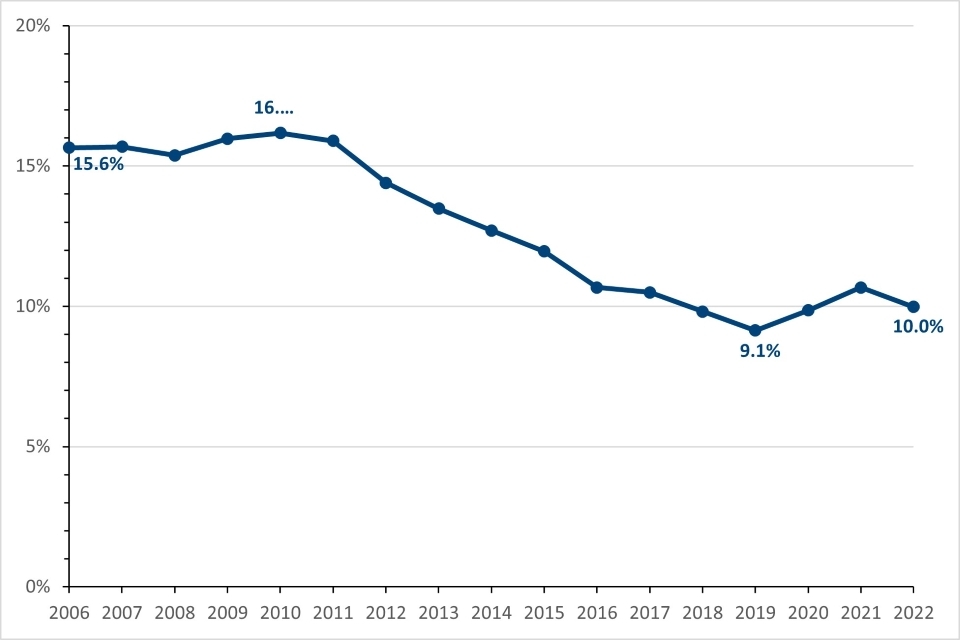
Data: Table 1a
Source: Working and workless households in the UK - Office for National Statistics (ons.gov.uk)
Due to concerns over achieved levels of response, the Office for National Statistics suspended all outputs from the Labour Force Survey in October 2023. In February 2024 the headline labour market measures from the survey were reintroduced, based on updated population information. However, other measures, including those relating to households have not yet been reintroduced and remain under review. Consequently estimates relating to children in workless and long-term workless households for the period October to December 2023 are not yet available.
10% of all children (around 1.28 million children) were living in workless households in the fourth quarter of 2022. This has decreased by approximately 84,000 children from the previous year.
The percentage of children in workless households is derived from the Labour Force Survey (LFS), which achieved a sample size of over 60,000 people in Oct-Dec 2022. To avoid seasonal fluctuations in quarter-on-quarter data results from October to December are compared each year.
Proportion of children living in long-term workless households (UK), 2006 to 2022
8.8% of all children were living in workless households for at least 12 months in 2022.
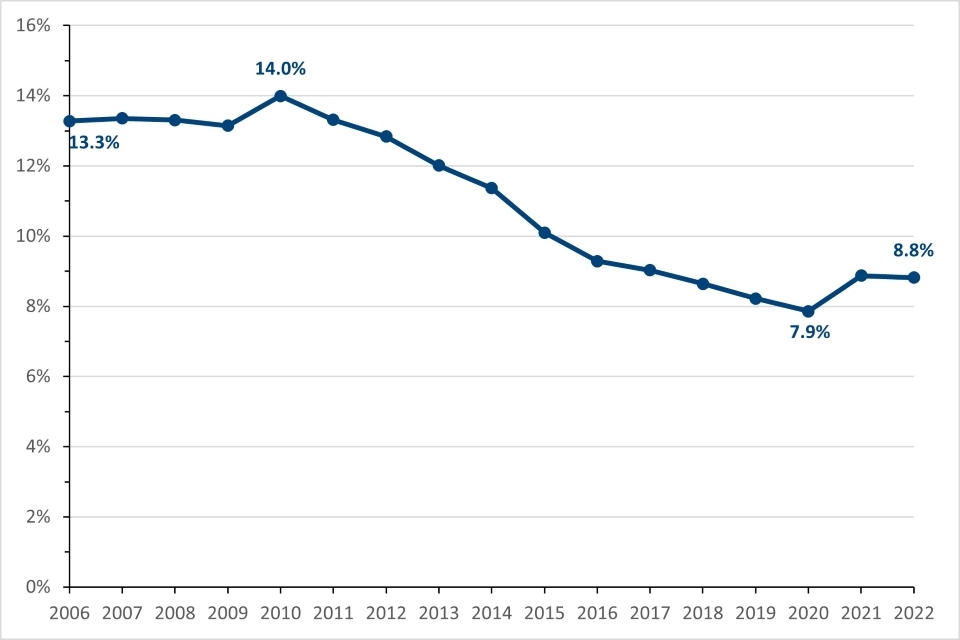
Data: Table 1b.
8.8% of all children (around 1.1 million children) were living in long-term workless households in 2022. This has decreased from 8.9% in the previous year (a decrease of less than 50,000 children).
The percentage of children in long-term workless households is from the Annual Population Survey (APS) that combines Waves one and five of the LFS with an additional booster sampler and achieved a sample of around 200,000 people in 2022.
For more information:
Working and workless households in the UK - Office for National Statistics (ons.gov.uk)
Indicator 2: Parental Conflict
The proportion of children in couple-parent families reporting relationship distress has not been updated as the Understanding Society survey data for the measure is updated every two years. The next update was due in 2024, but the publication has been suspended pending further investigation. The methodology is being reviewed before publishing.
The parental conflict measures have been developed using Understanding Society survey data. The Understanding Society survey interviews up to 40,000 households across the UK each year. Households are asked questions relating to relationship distress once every 2 years.
Experiencing relationship distress is defined as when either parent in a couple-parent family states that most or all of the time they consider divorce, regret living together, quarrel, or get on each other’s nerves (in response to questions asking about their relationship with their partner).
Regular contact with the non-resident parent is defined as when the resident parent states that the child ‘usually sees’ the non-resident parent ‘at least fortnightly’ during term time. Regular contact between children and their parents is a positive outcome and serves as a proxy measure for reasonable quality inter-parental relationships in separated families.
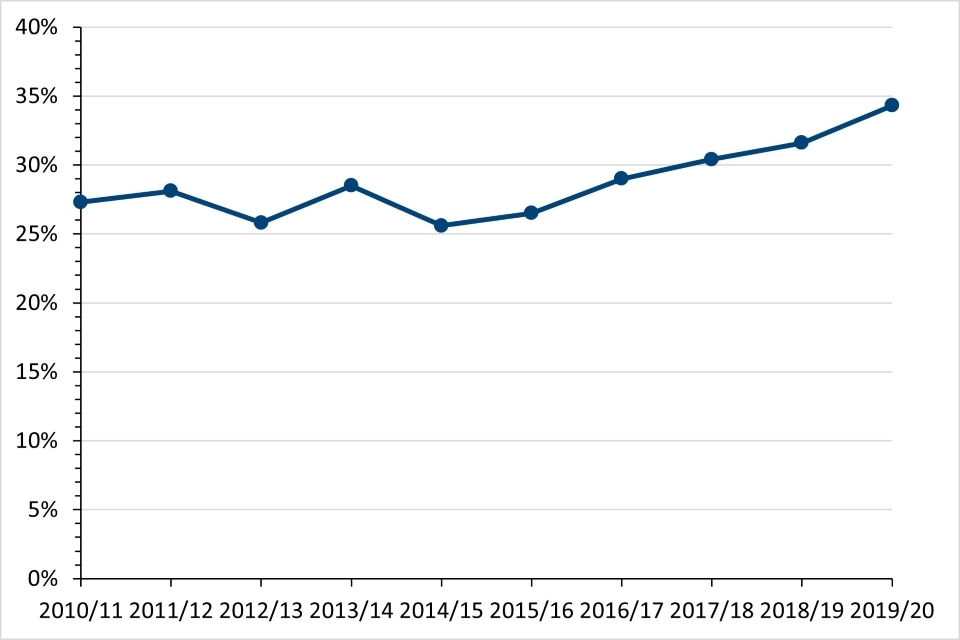
12% of children in couple-parent families were living with at least one parent reporting relationship distress in 2019/20.
52% of children in separated families saw their non-resident parent at least fortnightly in 2019 to 2020.
Proportion of children in couple-parent families reporting relationship distress (UK), 2011 to 2020
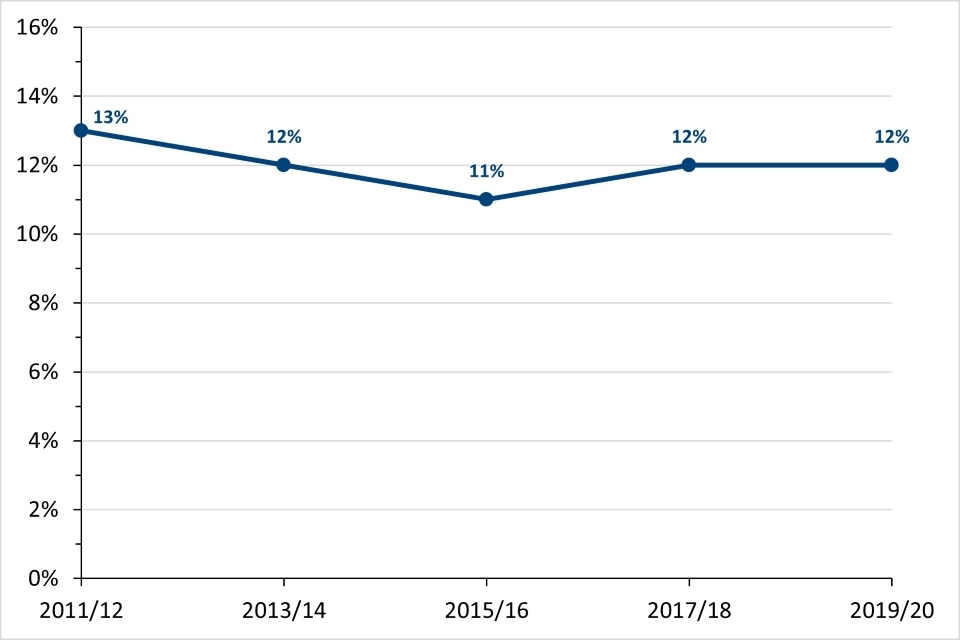
Data: Table 2a.
Proportion of children living in separated families who see their non-resident parent regularly (UK), 2013 to 2020
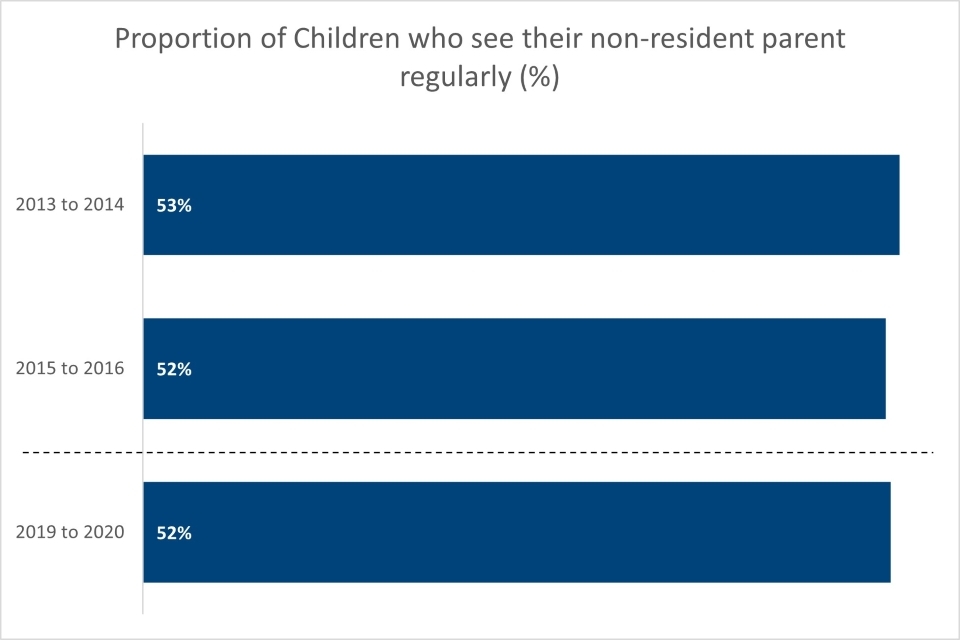
Data: Table 2b.
Source: Parental conflict indicator 2011 to 2020 - GOV.UK (www.gov.uk)
For more information:
Parental conflict indicator 2011 to 2020
Parental conflict indicator - GOV.UK (www.gov.uk)
Indicator 3: Poor Parental Mental Health
The proportion of children living with at least one parent reporting symptoms of anxiety and/or depression has not been updated in 2024.
Poor Parental Mental Health is measured using the Understanding Society survey, which captures information from up to 40,000 households across the UK each year. The questions come from the 12-item General Health Questionnaire (GHQ-12), which is the most widely used screening tool for common mental disorders.
Twelve questions are asked about an individual’s self-confidence, worries and sleep amongst other things over the past few weeks. The questions have two negative options (where the respondent feels worse than usual) and two positive options (where the respondent feels the same or better than usual). Scores of one are given to negative responses and zero to positive responses. Scoring four or more classifies the person as reporting symptoms of anxiety or depression.
This is considered a better measure of poor mental health than asking the respondent if they have been diagnosed with depression or anxiety, as asking the respondent directly is likely to under-represent the level of poor mental health due to under-diagnosis and under-reporting.
Updates for the proportion of children living with at least one parent reporting symptoms of emotional distress are currently paused to allow a review of the methodology used for the indicators in relation to changes in:
- data collection approach during the COVID-19 pandemic survey waves
- characteristics of survey participants and comparison over time
The latest available update is March 2022.
The most recent data show that the proportion of children living with at least one parent reporting symptoms of emotional distress has increased each year from 2014/15. This has increased by almost 3 percentage points from the previous year.
The proportion of children living with at least one parent reporting symptoms of emotional distress was 34%
Proportion of children living with at least one parent reporting symptoms of anxiety and/or depression (UK), 2010 to 2020
Data: Table 3a.
Source: Children living with parents in emotional distress: March 2022 update - GOV.UK (www.gov.uk)
For more information:
Children living with parents in emotional distress: March 2022 update
Indicator 4: Parental Drug and Alcohol Dependency
The number of parents who are opiate users or dependent on alcohol has not been updated since 2019/20, as new data are not available. Parents are defined as individuals aged 18 and over that have children (aged under 18) living with them. Parents involved in treatment also includes pregnant individuals.
In 2018/19 around 121,000 parents were estimated to be dependent on alcohol in England.
The number of parents who are opiate users or dependent on alcohol (England), 2010 to 2019
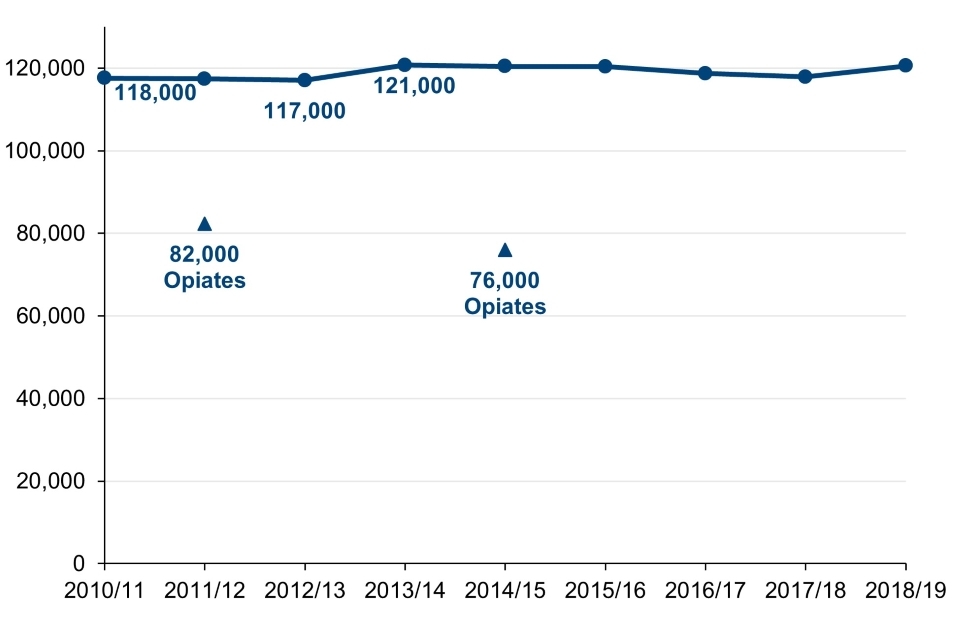
Data: Table 4a.
Source: NDTMS - Parental substance misuse
Between 2010/11 and 2018/19, the number of alcohol-dependent parents has remained largely stable. It increased from 118,000 in 2017/18 to 121,000 in 2018/19.
Alcohol dependency is estimated using data from the Adult Psychiatric Morbidity Study (APMS), Office for National Statistics census information and hospital admissions by Sheffield University and Public Health England. Opiate dependency uses data from the Police National Computer, probation and prison treatment data and data from the National Drug Treatment Monitoring System. They are produced by Liverpool John Moores University and Manchester University with support from Public Health England.
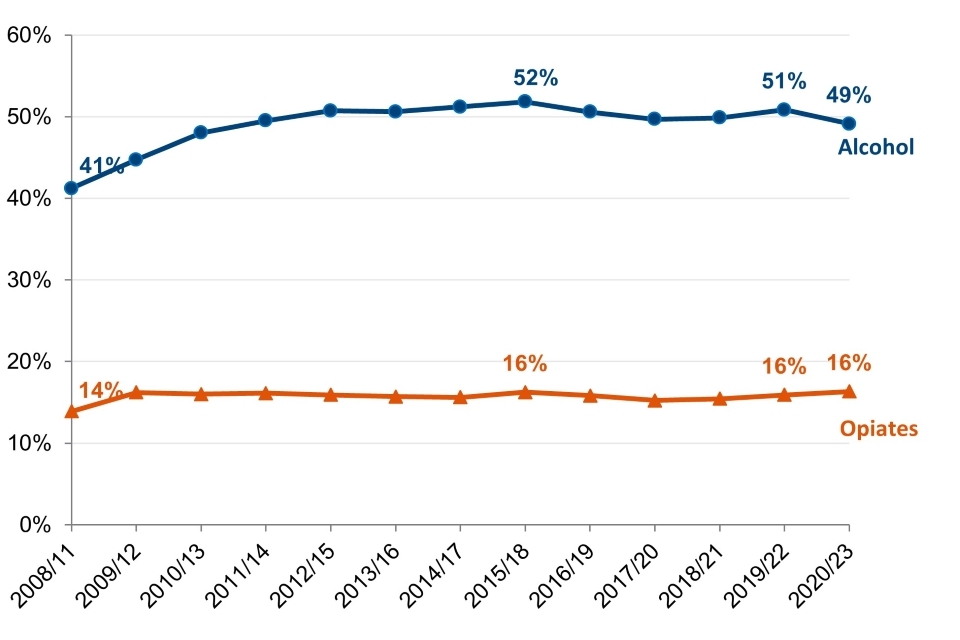
Between 2019 and 2022, 51% of parents with alcohol dependency and 16% of opiate using parents completed treatment and did not return within 3 years.
Proportion of alcohol dependent or opiate using parents who have entered and completed treatment within the last three years (England), 2008 to 2023
Data: Table 4b.
Source: Substance misuse treatment for adults: statistics 2022 to 2023 - GOV.UK (www.gov.uk)
The proportion of alcohol-dependent parents completing treatment dropped two percentage points to 49% between 2019/2022 and 2020/23. The percentage of parents completing treatment for opiate use stayed stable at 16% between 2020/23.
The proportion of alcohol-dependent or opiate using parents completing treatment uses information collected through the National Drug Treatment Monitoring System analysed by Public Health England. It counts parents who have completed and not returned for treatment within three years. Opiate users must not be receiving any substitute medication at the time of leaving treatment.
For more information:
Substance misuse treatment for adults: statistics 2022 to 2023 - GOV.UK (www.gov.uk)
Indicator 5: Problem Debt
The proportion of children living in households in persistent problem debt has not been updated since 2022. The data is from the Wealth and Assets survey and is due to be published later in 2024.
A household is considered as being in problem debt if at least one adult:
- reports falling behind with bills or credit commitments and the household’s debt repayments are at least 25% of the household’s net monthly income
- reports falling behind with bills or credit commitments and at least one adult is currently in two or more consecutive months’ arrears on bills or credit commitments
- considers debt a heavy burden and the household’s debt represents at least 20% of the household’s net annual income
Persistent problem debt is where children are in a household in problem debt in two consecutive waves of the Wealth and Assets Survey (WAS).
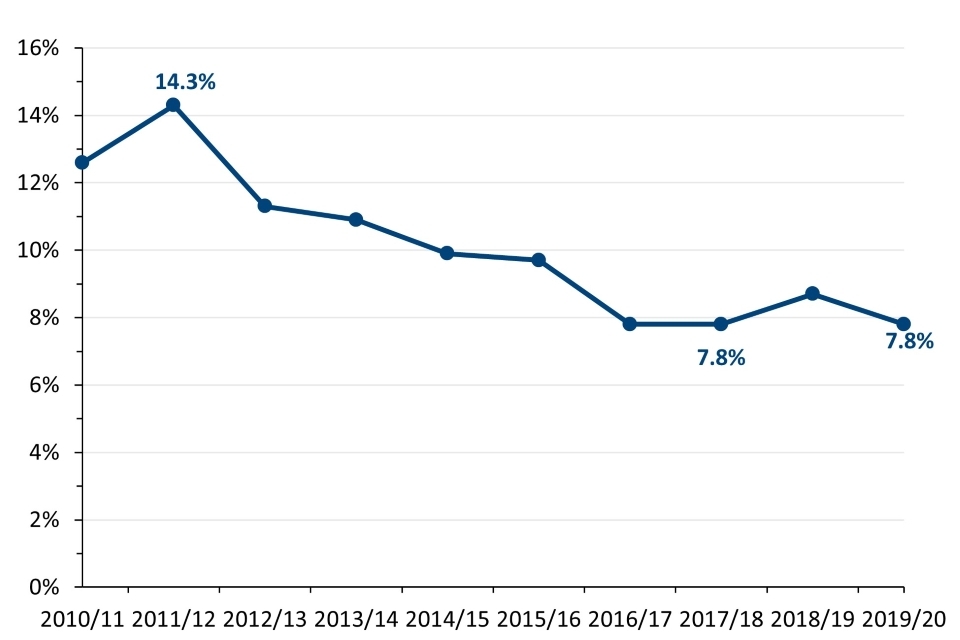
1.6% (around 195,000) of all children in Great Britain were living in households in persistent problem debt.
Proportion of all children living in households in persistent problem debt (Great Britain), 2010 to 2020
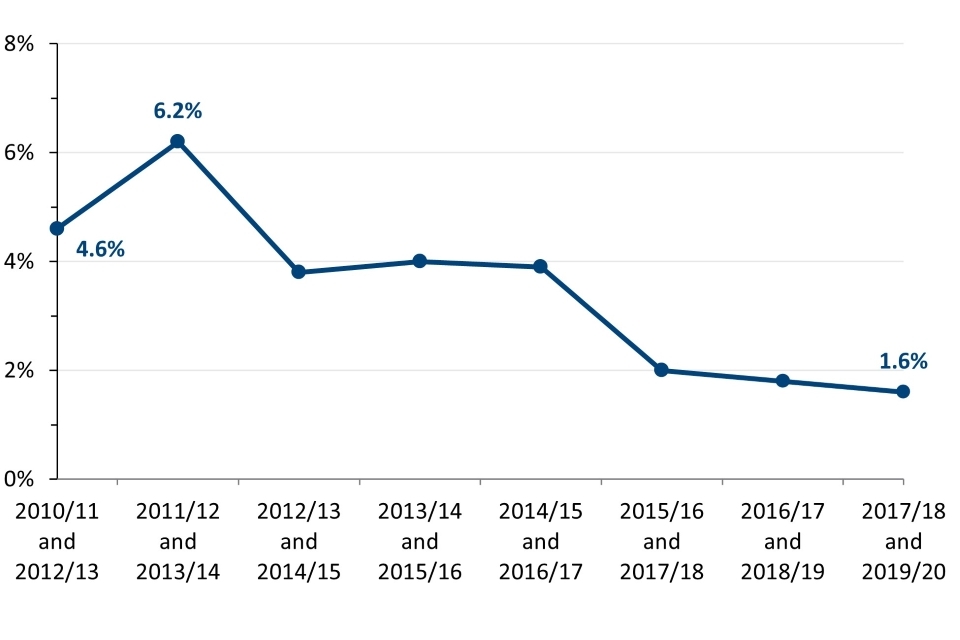
Data: Table 5a.
The proportion of children living in households in persistent problem debt fell to 1.6% from 1.8% in the most recent 2-year period. It is well below its peak of 6.2% in 2011/12 and 2013/14.
Proportion of all children living in households in problem debt (Great Britain), 2010 to 2020
Data: Table 5b.
The proportion of children living in households in problem debt is not part of the Problem Debt Indicator but provides evidence to support the measure.
7.8% of children were living in households in problem debt in 2019/20. This is a 0.9 percentage point decrease from the previous year.
For more information:
Problem debt, Great Britain: July 2010 to June 2016 and April 2014 to March 2020
Indicator 6: Homelessness
The term ‘homelessness’ does not only apply to people ‘sleeping rough’. For this indicator, homelessness is statutory homelessness, where a local authority has accepted a homeless duty for a household.
A homelessness duty is where a local authority is satisfied that the household is unintentionally homeless, eligible for assistance and is in a specified priority need group for example they have dependent children. Suitable accommodation must be made available by the local authority when there is a homelessness duty. This can involve placing the household in temporary accommodation until a settled housing solution becomes available or until some other circumstance ends the duty.
Around 9 in every 1,000 households in England with dependent children (68,100 households) were living in temporary accommodation at the end of June 2023.
Households with dependent children living in temporary accommodation per 1,000 households (England), 2005 to 2023
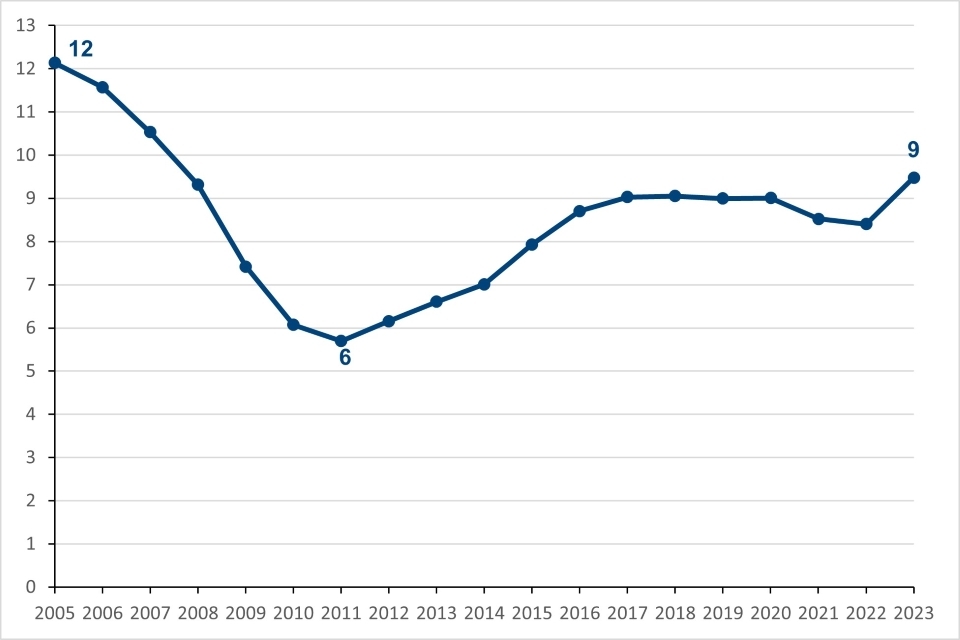
Data: Table 6a.
Source: Tables on homelessness - GOV.UK (www.gov.uk)
9 in every 1,000 (68,100) households were living in temporary accommodation with children at the end of June 2023. This value is rounded to the nearest whole number; the unrounded number of households living in temporary accommodation with children at the end of June 2023 was 9.48. This is below the peak of 12 in every 1,000 (72,800) households at the end of June 2005 and an increase from the previous year of 8 in every 1,000 (59,800) households.
The number of households with dependent children living in temporary accommodation per 1,000 households combines statistics on dependent children in temporary accommodation and projections of the number of households with dependent children from the Department for Levelling Up, Housing and Communities. Information on the number of households in temporary accommodation is collected from local authorities on the last day of each quarter.
For more information:
2014-based household projections: detailed data for modelling and analytical purposes
Indicator 7: Early Years
The early years foundation stage profile (EYFSP) assesses the development of children in state-funded early years education at the end of the academic year in which they turn five. This is typically the summer term of reception year. Teachers assess children’s development against 17 early learning goals (ELGs) across 7 areas of learning. Children are considered to have a good level of development when at the expected level in the 12 ELGs within the 5 areas of learning relating to: communication and language; personal, social and emotional development; physical development; literacy; and mathematics.
As part of wider early education reforms to the EYFS, the EYFS Profile was revised significantly in September 2021. Changes from the previous framework include:
- revisions to all 7 areas of learning in the EYFS, with new educational programmes that set out what children must experience and learn about
- revisions to all 17 ELGs across the 7 areas of learning to make these clearer and more precise and to make it easier for practitioners to understand what is required for a child to be at the expected level of development
- removal of ‘exceeding’ assessment band
- removal of statutory local authority moderation
It is therefore not possible to directly compare assessment outcomes from the 2021/22 academic years onwards with earlier academic years.
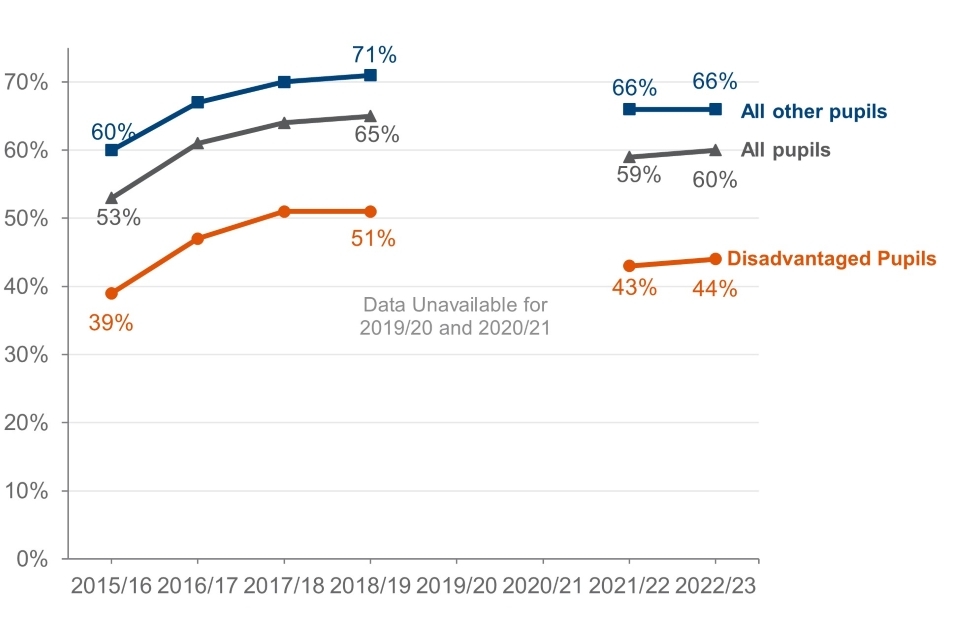
52% of children eligible for free school meals in 2022/23 had a good level of development.
In 2022/23, 52% of children eligible for free school meals had a good level of development, compared to 71% of children not eligible for free school meals and 67% of all children. They have all increased from the previous year.
Percentage of children with a good level of development by free school meals eligibility (England), 2012/13 to 2022/23
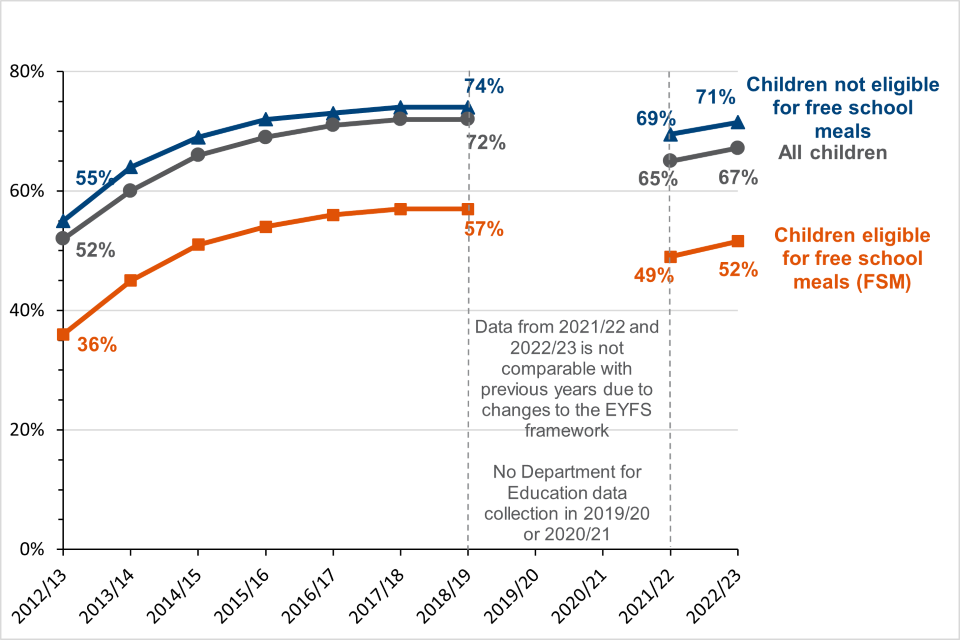
Regarding data earlier than 2021/22 in this chart, figures for ‘Children not eligible for free school meals’ include all children not known to be eligible for free school meals.
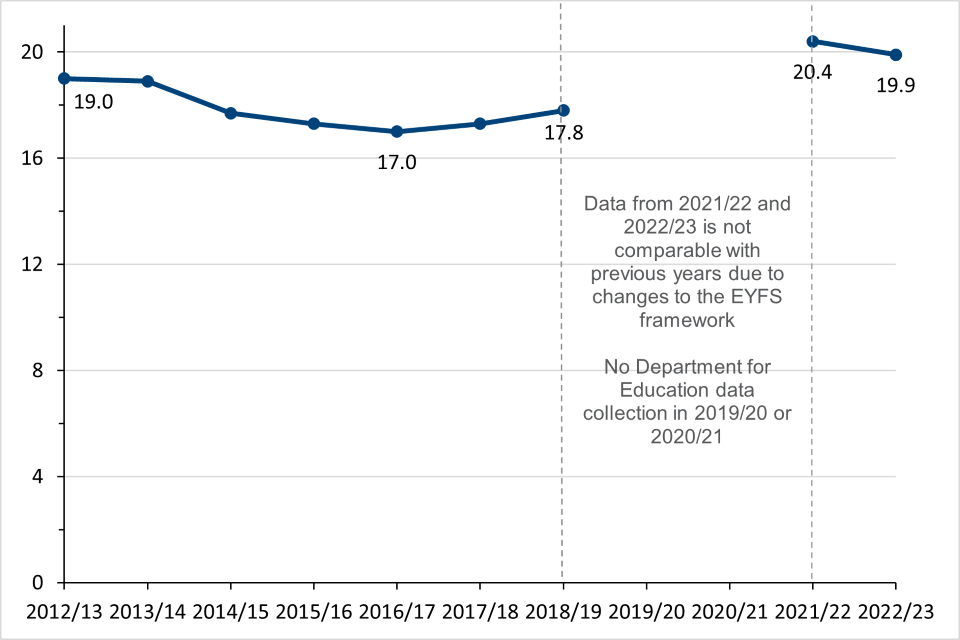
Differences in percentage of children with a good level of development between children eligible and not eligible for free school meals (England), 2012/13 to 2022/23
Source: Statistics: early years foundation stage profile - GOV.UK (www.gov.uk)
Regarding data earlier than 2021/22 in this chart, figures for ‘Children not eligible for free school meals’ include all children not known to be eligible for free school meals.
In 2022/23, the percentage of children with a good level of development was 19.9 percentage points lower for children eligible for free school meals than for children not eligible for free school meals, a decrease of 0.5ppts from 2021/22.
Indicator 8: Educational Attainment
30% of pupils at the end of Key Stage 2 in 2023 and 26% of pupils at the end of Key Stage 4 in 2023 were classified as disadvantaged in state funded schools. Pupils are defined as disadvantaged if they have been eligible for free school meals in the previous six years, they have been looked after for at least one day during the year or they have ceased to be looked after by a local authority in England because of adoption, a special guardianship order, a child arrangements order or a residence order.
For this indicator, we define attainment at Key Stage 2 as the proportion of pupils reaching the expected standard in reading, writing and maths.
Attainment at Key Stage 2 (England), 2016 to 2023
Data: Table 8a.
The impact of the COVID-19 pandemic meant that Key Stage 2 tests and assessments did not take place in the 2019/20, or 2020/21 academic years.
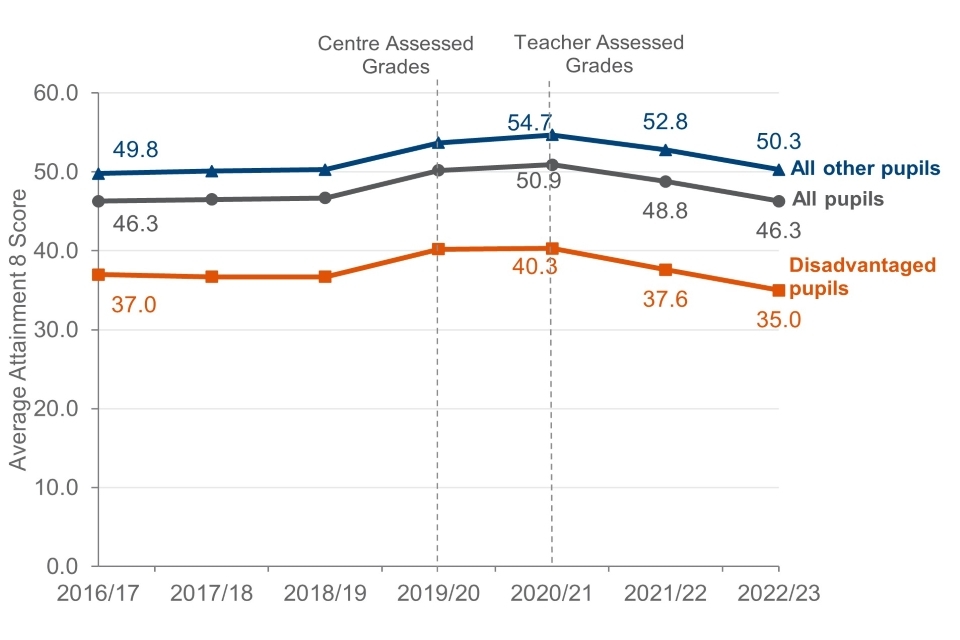
There has been a decline in performance across all measures since the completion of the 2018/19 Key Stage 2 examinations. 44% of disadvantaged pupils achieved the expected standard in reading, writing, and maths. This compares to 66% of non-disadvantaged pupils and 60% of all pupils.
Attainment at Key Stage 4 (England), 2016 to 2023
Data: Table 8b.
In the academic year 2022/23, the average attainment 8 score for disadvantaged pupils was 35. Comparatively, the average attainment 8 score of non-disadvantaged pupils was 50.3, both decreasing from the previous year.
The summer exam series was cancelled in both 2019/20 and 2020/21 due to the impact of the COVID-19 pandemic, where alternative assessed processes were set up to award grades. In 2019/20 pupils scheduled to sit GCSE level exams were awarded the higher grade of either their:
- centre assessment grade (based on what the school or college believe the student would have most likely have achieved
- calculated grade estimated from a model developed by Ofqual
For 2020/21, pupils were assessed only on content they had been taught for each course. Schools were given flexibility to decide how to assess their pupils’ performance, for example, through mock exams, class tests, and non-exam assessment already completed. GCSE grades were then determined by teachers based on the range of evidence available and they are referred to as teacher-assessed grades.
For 2021/22, as part of the transition back to the summer exam series, adaptations were made to the exams (including provision of information in advance) and the approach to grading for 2022 exams broadly reflected a midpoint between results in 2019 and 2021.
For more information on changes to 2021/22 measures: Secondary accountability measures (including Progress 8 and Attainment 8).
The Disadvantage Attainment Gap Index at Key Stage 2 and 4 (England), 2010/11 to 2022/23
The disadvantage attainment gap at Key Stage 2 was 3.21 in 2022/23, which has decreased from the last recorded result of 3.23 in 2021/22.
The disadvantage attainment gap at Key Stage 4 was 3.94 in 2022/23 which has risen from 3.84 in 2021/22.
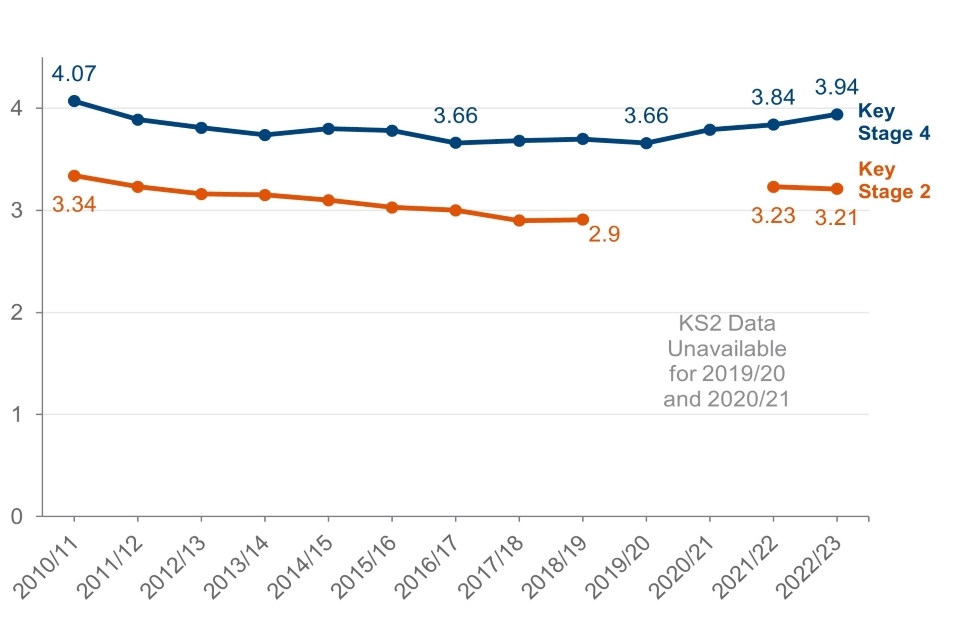
Data: Table 8c.
Source: Key stage 4 performance, Academic year 2022/23 – Explore education statistics – GOV.UK (explore-education-statistics.service.gov.uk) and Key stage 2 attainment, Academic year 2022/23 – Explore education statistics – GOV.UK (explore-education-statistics.service.gov.uk)
The Disadvantage Attainment Gap Index for Key Stage 2 and 4 is not part of the Educational Attainment indicator but provides evidence to support the measures. It shows if disadvantaged pupils are catching up or getting left behind. A disadvantage gap of zero would indicate that pupils from disadvantaged backgrounds perform as well as pupils from non-disadvantaged backgrounds. The maximum possible gap is 10 (or -10 if disadvantaged pupils perform better than other pupils).
The gap index is more resilient to changes to grading systems and assessment methods. Whilst the absolute differences (in English and Maths GCSE grades) may differ between years the gap index measures how disadvantaged pupils compare to non-disadvantage pupils and therefore, offers greater comparability between years.
For more information:
Indicator 9: Youth Employment
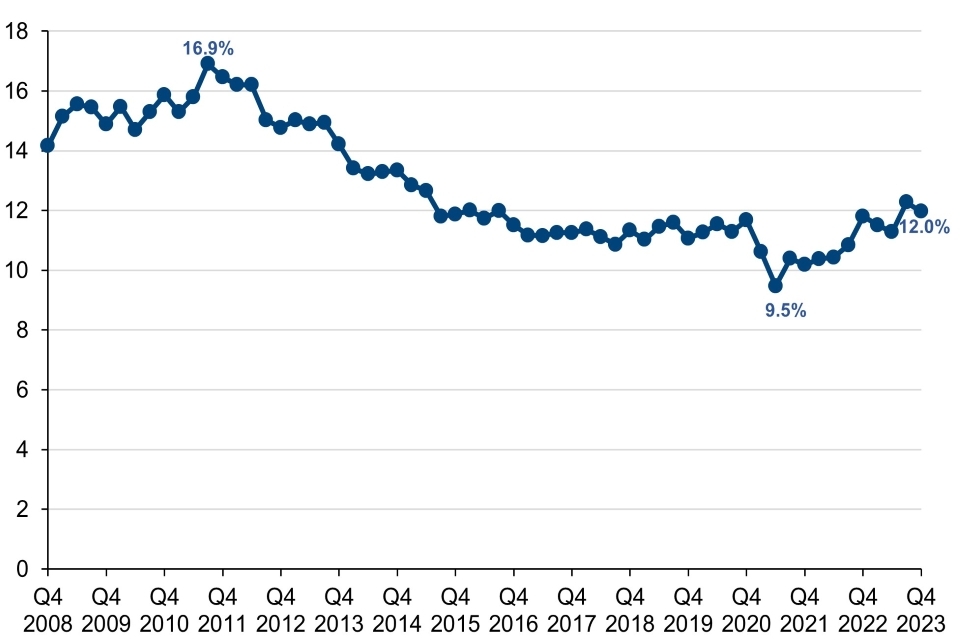
12.0% of young people (aged 16 to 24) are not in education, employment or training (NEET).
Proportion of young people (aged 16 to 24) who are not in education, employment or training (NEET) (UK), 2007 to 2023
Data: Table 9a.
The proportion of young people (aged 16 to 24) who are NEET in October to December 2023 was 12.0%, this has increased by 0.2 percentage points since October-December last year. This is 4.9 percentage points lower than the peak of 16.9% in July to September 2011. The data is from the Labour Force Survey (LFS) which achieved a sample size of over 60,000 in October to December 2022.
6.7% of young people aged 18 to 24 haven’t been in employment or full-time education for two years.
Proportion of young people aged 18 to 24 who have not been in employment or full-time education for two years or more (UK), 2006 to 2022
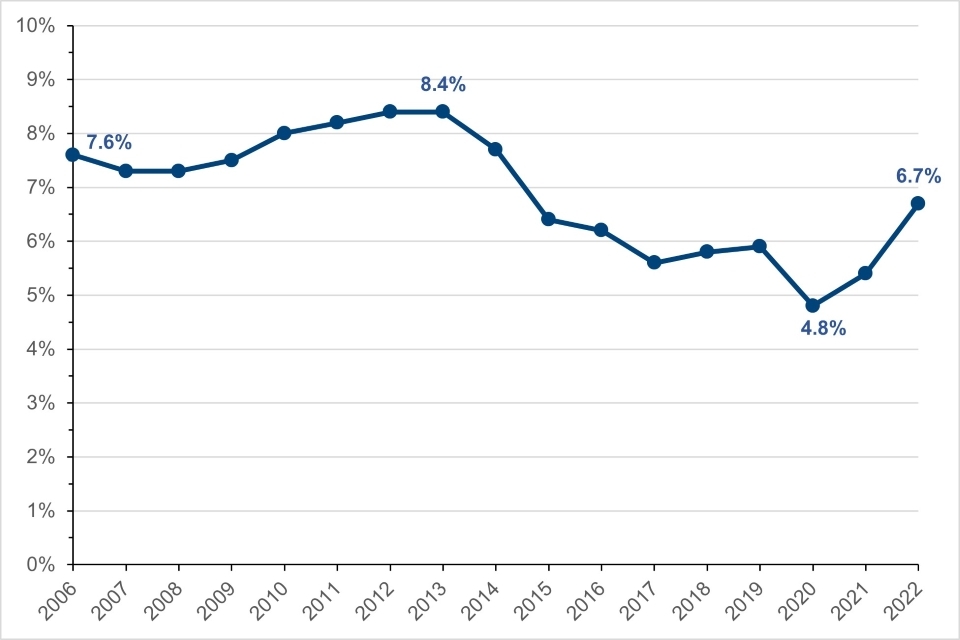
Data: Table 9b
Source: Young people who are long-term workless - Office for National Statistics (ons.gov.uk)
The proportion of young people (aged 18 to 24) who have not been in employment or full-time education for two years has risen by 1.3 percentage points from the previous year to 6.7% in 2022.
The data are from the Annual Population Survey (APS) that combines Waves one and five of the LFS with an additional booster sampler and contains around 320,000 individuals. A 2-year threshold is used to eliminate those voluntarily spending time out of the labour market, for example those on a gap year.
For more information: