Life after service in the UK armed forces: Veterans’ Survey 2022, UK
Published 9 August 2024

© Crown copyright 2024
This publication is licensed under the terms of the Open Government Licence v3.0 except where otherwise stated. To view this licence, visit nationalarchives.gov.uk/doc/open-government-licence/version/3 or write to the Information Policy Team, The National Archives, Kew, London TW9 4DU, or email: psi@nationalarchives.gov.uk.
Where we have identified any third party copyright information you will need to obtain permission from the copyright holders concerned.
This publication is available at https://www.gov.uk/government/publications/life-after-service-in-the-uk-armed-forces-veterans-survey-2022/life-after-service-in-the-uk-armed-forces-veterans-survey-2022-uk
Main points
Across the UK, the most frequently cited sources of veteran-related information were word of mouth from friends or family (36.4%), followed by social media (34.2%), regimental associations (29.9%) or veteran charities (29.2%). When asked a follow-up question to understand where veterans mainly received their information, social media was the most common answer (25.9%).
The percentage of veterans that cited veteran charities as a main source of information was associated with health variables (14.7% of veterans who were disabled said veteran and service charities were their main source of information compared with 11.3% of those who were not disabled). We see a similar pattern for non-military charities.
Over a fifth of veterans (22.8%) had looked for help from a veteran or service charity. Veterans were more likely to seek help after 2 years of leaving the UK armed forces (66.3%) than within 2 years of leaving (38.7%).
Veterans with a disability or who were female or who were aged 49 years and under were more likely to have looked for help from a veteran or service charity than their counterparts, and veterans that had served as commissioned officers were less likely to have looked for help than those who had not (15.3% compared with 25.0%).
Veterans who felt they were subject to bullying during service were more likely to have looked for help from a veteran or service charity than those who did not (30.6% compared with 18.4%). Findings were similar when we considered whether a veteran said they were subject to discrimination or harassment during service.
Across the UK, 64.0% of veterans said they agreed to some extent with the statement ‘I don’t have a say in what the government does’ and over a half of veterans said they agreed to some extent that they felt they belonged to their local community (53.0%). This varied by personal and service-related characteristics.
About the Veterans’ Survey 2022
These statistics are official statistics in development. They are published as research and are not official statistics.
The Veterans’ Survey 2022 was the first survey of its kind in the UK and was a collaboration between the Office for National Statistics (ONS), the Office for Veterans’ Affairs and the devolved administrations. The Veterans’ Survey 2022 aimed to understand the experiences of veterans and their families, ranging from their time in the armed forces, their transition to civilian life and their access to veterans’ services and support. In total, there were 28,957 veteran respondents.
In December 2023, the ONS published initial research on the Veterans’ Survey 2022, a demographic overview and coverage analysis of the survey. The Veterans’ Survey 2022 was conducted through a self-select sample, which relied on advertising and promotion. Coverage analysis of veteran respondents from England and Wales as compared with veterans from Census 2021, shows aggregate analysis of the veteran survey will better represent veterans that have ever served as regulars as there was an under-representation of reserve veterans. Veterans with a disability were over-represented, and there was a small under-representation of those that identified in all but the high-level ‘White’ ethnic group. There was also an under-representation of veterans aged 75 and over which weighting by age has mitigated.
Caution is necessary in assuming findings are representative of the whole veteran population. The Veterans’ Survey has been partially weighted to compensate for known biases in age among respondents from England and Wales only. Some biases remain as outlined in Veterans’ Survey 2022, demographic overview and coverage analysis, UK: December 2023.
ONS also published the Veterans’ Survey methodology, which outlined the survey design, development and processes as well as the methodology used to analyse and partially weight the veterans’ survey by age to produce UK-level analysis and measure uncertainty in more detail.
All quantitative UK data presented are based on these weighted estimates. Veterans’ Survey 2022 estimates are presented with 95% confidence intervals in our data. We only refer to a difference throughout where we are confident this difference is a significant difference based on the associated 95% confidence intervals found in our accompanying datasets. This article focuses on UK level data only, additional UK level data and an exploration of whether we see the same patterns at country level (where the latter analysis was feasible) are contained within footnotes in all our accompanying datasets.
Where veterans get information about veteran-related issues, services or benefits
Veterans were asked ‘Where do you get information about veteran-related issues, services or benefits?’ and they were able to select as many options as applicable from a range of response options or ‘None of the above’. A follow-up question was asked to those who responded asking if they mainly received this information from:
- word of mouth from friends or family
- veteran charities
- Veterans UK
- Veterans’ Gateway
- regimental associations
- non-military charities
- national or local government channels (for example, websites or newsletters)
- social media (for example, Facebook, Twitter)
- TV news or radio
- national or regional newspapers
It is important to note that, because the survey sample was self-selecting and relied on the assistance of veteran services, including charities, government and regimental associations for promotion, we cannot be sure aggregate results are typical of the veteran population as a whole.
Across the UK, the most frequently cited sources of this information by veterans were word of mouth from friends or family (36.4%), followed by social media (34.2%), regimental associations (29.9%), or veteran charities (29.2%), then Veterans UK (23.5%). Veterans were least likely to cite non-military charities as a source of information (2.9%). When asked a follow-up question to understand where veterans mainly got information from, social media was the most common answer (25.9%). Although, the top 5 most cited sources of information remained the same when we asked about main sources of information rather than all sources, the order of them changed when asked where a veteran mainly got their information, and non-military charities remained the least cited (0.5%).
Figure 1: Word of mouth from friends or family was the most cited source of information about veteran related issues, services or benefits, but social media was the most cited main source of information
Weighted percentages, sources of information and main source of information on veterans-related issues, services or benefits. Veterans’ Survey 2022, UK.

Source: The Veterans’ Survey 2022 from the Office for National Statistics
Notes:
Veterans who said they got their information from ‘None of the above’ options (13.2%) are included in data tables but removed from this chart as these respondents were not asked where they mainly accessed their information from.
Blank responses to this question were removed from this analysis because of high levels of uncertainty.
Proportions may not sum to 100.
Use of veteran or service charities
In the survey, veterans were asked: ‘Have you ever looked for help from veteran or service charities?’ Those respondents that did seek help were asked whether they looked for help within 2 years of leaving the UK armed forces or after 2 years (respondents were able to tick both options if applicable). It is important to note that because the survey sample was self-selecting and relied on the assistance of veteran organisations, including charities for promotion, we cannot be sure aggregate results are typical of the veteran population as a whole.
Across the UK, over a fifth of veterans (22.8%) had looked for help from a veteran or service charity and those who did were more likely to seek help after 2 years of leaving the UK armed forces (66.3%) compared with within 2 years of leaving (38.7%).
Figure 2: Veterans were more likely to seek help after 2 years of leaving the UK armed forces than within 2 years
Weighted percentages, when veterans looked for help from veteran or service charities. Veterans’ Survey 2022, UK.

Source: The Veterans’ Survey 2022 from the Office for National Statistics
Notes:
Only veterans who had looked for help from a veteran or service charity were asked when they look for help.
Respondents were able to tick both within 2 years and after 2 years of leaving the UK armed forces if applicable, 7.7% (6.8% to 8.5%) ticked both.
Blank responses to this question were removed from this analysis because of high levels of uncertainty.
Proportions may not sum to 100.
Awareness, use and satisfaction of veteran support services
Veterans were asked which support services they were aware of and presented with a list of services. This analysis considers 2 of the overall UK support services only:
- overall advice and support via Veterans’ Gateway (UK)
- overall advice and support via Veterans UK (UK)
Respondents who were aware of at least one support service were asked if they had used any of the support services and if they had, they were asked how satisfied they were with that service.
The Veterans’ Gateway was designed as a first point of contact for all veterans and their families to access support. It contained information on welfare areas in housing, employment, finances, living independently, mental wellbeing, families and communities and physical health.
Veterans UK was adopted as a soft brand and logo to describe the operational delivery area within the Ministry of Defence (MoD) that is responsible for the administration and payment, by the MoD, of Armed Forces Pensions and War Pensions, Armed Forces Compensation Schemes, and Welfare. The Veterans UK brand and logo is being retired this year and will be replaced by a service line brand approach which will better support potential users when accessing the services.
The MoD currently delivers the following services for both veterans and serving personnel, the military bereaved and their families:
- Defence Transition Service (DTS) (serving personnel and veterans)
- Armed Forces Pensions (serving personnel and veterans)
- Armed Forces Compensation Scheme (serving personnel and veterans)
- IPC4V (serving personnel and veterans)
- War Pensions Scheme (veterans only)
- Veterans Welfare Service (including VWS Northern Ireland) (veterans and serving personnel)
The Pensions and Compensation Schemes (Armed Forces Pensions, Armed Forces Compensation Scheme and War Pensions Scheme) are provided solely by the MoD. The other services, although led by the MoD, work closely with other government departments, including Health, Housing, Communities and Local Government or the devolved administrations.
Veterans’ Gateway and Veterans UK differ in purpose and scope. Therefore, this analysis does not compare awareness, use and satisfaction of one service with the other. Future analysis will consider the other support services listed.
Across the UK, 20.9% of veterans were aware of Veterans’ Gateway and of those who were aware of at least one veteran support service 7.6% had used Veterans’ Gateway. Over one in four veterans (26.1%) were aware of Veterans UK and of those who were aware of at least one veteran support service, over one in ten (11.4%) veterans had used Veterans UK.
Similar percentages of veterans said they felt either very satisfied or satisfied with the service they had used (Veterans UK: 58.9% and Veterans’ Gateway: 57.0%). Of those that had used Veterans’ Gateway, 32.0% said they felt neither satisfied nor dissatisfied and 10.9% were in some way dissatisfied. Among veterans that said they had used Veterans UK, 27.3% said they felt neither satisfied nor dissatisfied and 13.7% said they felt dissatisfied to some extent.
Figure 3: Almost six in ten veterans felt satisfied to some extent with the service from the Veterans’ Gateway and six in ten felt satisfied to some extent with the service from Veterans UK
Weighted percentage of how satisfied or dissatisfied a veteran felt with the overall advice and support provided to them through the Veterans’ Gateway and Veterans UK. Veterans’ Survey 2022, UK.

Source: The Veterans’ Survey 2022 from the Office for National Statistics
Notes:
Only veterans who said they had used a veteran support service were asked how satisfied they were with that service.
Blank responses to this question were removed from this analysis because of high levels of uncertainty.
Proportions may not sum to 100.
Veterans’ civilian life
The survey also asked veterans to what extent do they agree or disagree with the statement ‘I don’t have a say in what the government does’, 64.0% of veterans said they either agreed or strongly agreed. Across the UK, veterans may have referenced different governments when answering this question. However, 15.8% or just over 3 in 20 veterans said they disagreed or strongly disagreed with this statement. Around a fifth of veterans (20.3%) said they neither agreed nor disagreed.
The measuring national well-being dataset, May 2023 provides estimates for adults aged 16 years and over in Great Britain on the extent to which people agree or disagree that they do not have a say in what the government does. In January 2023, 68.3% of adults agreed to some extent that they did not have a say in what the government does, 10.4% disagreed to some extent and 21.3% neither agreed nor disagreed.
Figure 4: Most veterans agreed to some extent that they felt like they did not have a say in what the government did, but around 3 in 20 veterans disagreed to some extent
Weighted percentage of the extent of agreement or disagreement with the statement ‘I don’t feel like I have say in what the government does’. Veterans’ Survey 2022, UK.

Source: The Veterans’ Survey 2022 from the Office for National Statistics
Notes:
Blank responses to this question were removed from this analysis because of high levels of uncertainty.
Proportions may not sum to 100.
The survey asked veterans to what extent do you agree or disagree with the statement ‘I feel like I belong to my local community’, 53.0% of veterans either strongly agreed or agreed with the statement. Around a third of veterans (32.5%) said they neither agreed nor disagreed and 14.5% of veterans disagreed with this statement to some extent.
The measuring national well-being dataset, May 2023 also provides estimates for adults aged 16 years and over in Great Britain on the extent to which people agree or disagree that they belong to their neighbourhood. In January 2023, 54.8% of adults agreed to some extent that they belonged to their neighbourhood, 10.0% disagreed to some extent and 35.2% neither agreed nor disagreed.
Figure 5: Just over half of veterans agreed to some extent that they felt as though they belonged to their local community, but around 3 in 20 disagreed to some extent
Weighted percentage of the extent veterans said they agreed or disagreed with the statement ‘I feel like I belong to my local community’. Veterans’ Survey 2022, UK.

Source: The Veterans’ Survey 2022 from the Office for National Statistics
Notes:
Blank responses to this question were removed from this analysis because of high levels of uncertainty.
Proportions may not sum to 100.
Life after service by personal demographics
This section includes personal demographic breakdowns for the information explored in the previous sections on:
- where veterans said they mainly accessed information about veteran-related issues, services or benefits
- use of veteran or service charities
- veterans’ civilian life: levels of agreement that veterans felt like they belonged to their community and that veterans felt they had no say in what the government did
Patterns for all, rather than main, sources of information, advice or guidance and when a veteran said they looked for help from a charity by personal characteristics are outlined in our accompanying datasets.
Age
Where veterans mainly received information about veteran-related issues, services or benefits varied by age. Almost 4 in 10 (39.7%) veterans aged 18 to 29 years said social media was their main source of information followed by around 3 in 10 (29.9%) who said word of mouth from friends or family. This compared with 7.8% and 7.4% respectively for veterans aged 80 years and over.
Veterans aged 80 years or over were more likely to cite regimental associations as their main source of information than younger veterans (5.1% of veterans aged 18 to 29 years old used regimental associations as their main source of information compared with 27.7% of those aged 80 years and over). We see a similar pattern for national or regional newspapers or TV news or radio.
Those aged 60 years or over were more likely to have used Veterans UK as their main source of information than those aged 59 years or under (for example, 5.6% of veterans aged 18 to 29 years said Veterans UK was their main source of information compared with 14.9% of those aged 80 years and over).
When we consider whether a veteran has looked for help from a veteran or service charity, those aged 49 years and under were more likely to have looked for help from a veteran or service charity than those aged 50 years or over, the most notable difference was 41.0% of those aged 30 to 39 years old looked for help compared with 14.2% of those aged 70 to 79 years old.
Figure 6: Whether a veteran said they had looked for help from a veteran or service charity was strongly associated with age, with older age groups being less likely to have looked for help
Weighted percentages of veterans that had looked for help from a charity by age bands. Veterans’ Survey 2022, UK.

Source: The Veterans’ Survey 2022 from the Office for National Statistics
Notes:
Blank responses to this question were removed from this analysis because of high levels of uncertainty.
Proportions may not sum to 100.
‘Age’ refers to the age on the last birthday, rather than the exact age.
Whether a veteran felt like they belonged to their local community or felt like they had a say in what the government does was also associated with age. Most notably for whether a veteran said they agreed to some extent that they belonged to their local community, with those aged 60 years or over being more likely to have agreed than those aged 59 years or under.
A similar pattern is seen in the measuring national well-being dataset, May 2023, where 45.0% of adults in Great Britain aged 16 to 24 years agreed that they belong to their neighbourhood compared with 73.2% of those aged 75 years and over.
Figure 7: Those aged 80 years and over were most likely to have agreed to some extent that they felt like they belonged to their local community
Weighted percentages of veterans that agreed or strongly agreed they felt like they belonged to their local community by age bands. Veterans’ Survey 2022, UK.

Source: The Veterans’ Survey 2022 from the Office for National Statistics
Notes:
Blank responses to this question were removed from analysis because of high levels of uncertainty.
Proportions may not sum to 100.
‘Age’ refers to the age on the last birthday, rather than the exact age.
We know responses to questions about information sources, charity help and veteran civilian life had a strong relationship with age and many personal demographics are also associated with age. As a result, when we consider personal characteristics in this article, we focus on relationships between a characteristic and our variable of interest that we expect to exist regardless of the age profile of veterans with that characteristic. This was based on assessing the association between our variable of interest and a given characteristic after adjusting for age.
For example, female respondents to this survey were younger than male respondents which is true of the female veteran population generally as indicated in Characteristics of UK armed forces veterans, Census 2021. Other characteristics were associated with an older age profile (for example, more people in older age groups were homeowners). While health is typically associated with age, analysis of our survey coverage shows this was not the case among our survey respondents, perhaps owing to high response rates from veterans with a disability as referenced in ‘Veterans’ Survey 2022, a demographic overview and coverage analysis of the survey’ .
Our accompanying datasets provide information for veteran responses on all themes discussed in this article by a range of personal demographics (including age, sex, high-level ethnic group, economic activity, income, housing tenure, UK citizenship, disability and health).
Sex
Across the UK, differences in sources of information cited by sex appeared to be explained predominantly by age. However, when we consider whether a veteran had looked for help from a charity, female veterans were more likely to have looked for help from a veteran or service charity (30.0% compared with 22.1% of male veterans).
When we looked at overall levels of agreement and disagreement, there were similar patterns in responses to questions about community belonging and feeling like you have a say in what the government does for both sexes. However, there was some variation in whether they said they strongly felt one way or another, which is outlined in our accompanying datasets.
Disability and health
The percentage of veterans that cited veteran charities or non-military charities as a main source of information was also associated with health variables. Of those who were disabled, 14.7% said veteran charities were their main source of information compared with 11.3% of those who were not disabled, and 0.8% compared with 0.3% respectively for non-military charities. We see a similar pattern for veterans that required or did not require a personalised care plan.
Figure 8: Veterans who required a personalised care plan were more likely to cite veteran charities and non-military charities than those who did not
Weighted percentages of the main source of information for veteran-related issues, services or benefits by whether a veteran required a personalised care plan. Veterans’ Survey 2022, UK.

Source: The Veterans’ Survey 2022 from the Office for National Statistics
Notes:
Only veterans who said they accessed information on veterans-related issues, services, or benefits from at least one of the response options were asked where they mainly accessed their information from.
Blank responses to this question were removed from this analysis and answers of ‘Prefer not to say’ are presented in data tables but removed from this chart because of high levels of uncertainty.
In line with findings on sources of information about veteran-related issues, services or benefits, there appears to be an association between health and those that have looked for help from veteran or service charities. Veterans who were disabled were more likely to have looked for help from a veteran or service charity than those who were not disabled (32.9% compared with 12.8%).
Veterans who were disabled and whose day-to-day activities were limited a lot were more likely to have looked for help from a veteran or service charity (48.8%) compared with those who were disabled and were limited a little (25.2%), those who were not disabled but had a long-term physical or mental health condition that was not limiting (16.7%) and those who had no long-term physical or mental health condition (11.1%).
Veterans who required a personalised care plan were also more likely to have looked for help than those who did not require a personalised care plan (41.1% compared with 17.9%).
Across the UK, veterans who were disabled were more likely to have strongly agreed with the statement that they did not feel they had a say in what the government does (37.5%) and were less likely to have disagreed (11.2%) than those who were not disabled (27.8% strongly agreed and 16.0% disagreed). Across the UK, veterans who required a personalised care plan were more likely to have strongly agreed with the statement (42.4%) but less likely to have both agreed (26.6%) and disagreed (10.9%) than those who did not require a personalised care plan (30.4% strongly agreed, 31.9% agreed and 14.3% disagreed).
When we consider veteran responses to whether a veteran felt they belonged to their local community, those who were disabled were more likely than those who were not disabled to have disagreed (13.4% compared with 7.4%) or strongly disagreed (5.8% compared with 1.9%) with the statement and less likely to have agreed (33.6% compared with 40.0%) or strongly agreed (13.7% compared with 19.8%). We see a similar pattern among those who required or did not require a personalised care plan.
Economic activity
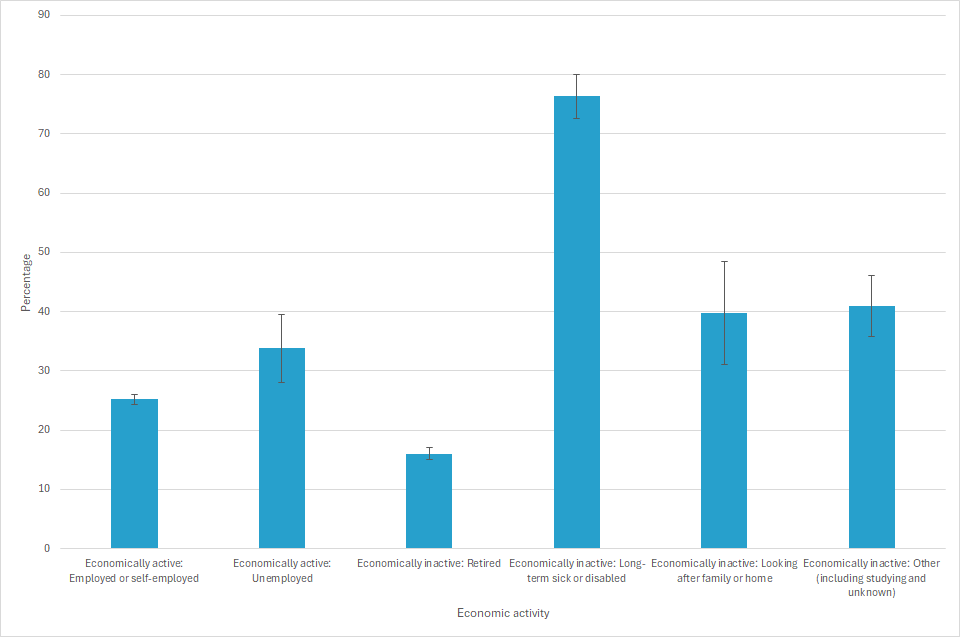
In line with the above findings, veterans who were economically inactive due to being long-term sick or disabled were more likely to use veteran charities as their main source of information (24.5%) than those who were employed or self-employed (12.1%), unemployed (11.3%), those who were economically inactive due to retirement (12.6%) or looking after a family or home (9.5%).
Veterans who were economically inactive due to being long-term sick or disabled were more likely to have looked for help from veteran or service charities (76.3%) than all other veterans.
Figure 9: Veterans who were economically inactive due to being long-term sick or disabled were more likely to have looked for help from a charity than those in all other economic activity categories
Weighted percentage of respondents who looked for help from veteran or service charities by economic activity. Veterans’ Survey 2022, UK.
Source: The Veterans’ Survey 2022 from the Office for National Statistics
Notes:
Blank responses to this question were removed from this analysis because of high levels of uncertainty.
Proportions may not sum to 100.
Across the UK, those who were economically inactive due to being long-term sick or disabled were more likely to have strongly agreed that they do not feel they have a say in what the government does (53.8%) than those who were retired (29.7%), looking after friends or family (40.6%), employed (34.1%) or unemployed (41.0%).
Across the UK, those who were economically inactive due to being retired were less likely than all other veterans to have disagreed (5.6%) or strongly disagreed (1.5%) with the statement that they feel like they belong to their local community.
Income
Across the UK, veterans in the lowest income category (those whose income was less than £10,400 a year) were more likely to have looked for help from veteran or service charities (29.4%) compared with veterans in all other income groups. The smallest difference was when compared with the next lowest income category (22.4% of those whose income was £10,400 to £20,799 a year looked for help). The largest difference was when compared with those income was more than £100,000 a year (14.0% of veterans looked for help).
Across the UK, those whose income was less than £10,400 a year were more likely to have strongly agreed that they felt they have no say in what the government did (44.2%), compared with those whose income was higher, most notably compared with those whose income was £100,000 a year or more where 20.5% of veterans strongly agreed with the statement. Veterans whose income was £100,000 a year or more were more likely to have disagreed than anyone whose income was below £77,949 a year.
Across the UK, those whose income was less than £10,400 a year were less likely to have strongly agreed (9.8%) or agreed (26.3%) and more likely to have disagreed (18.3%) or strongly disagreed (11.9%) that they felt they belonged in their local community than any other veterans.
Life after service by service-related factors
This section includes breakdowns by service-related factors for the information explored in the previous sections on:
- where veterans said they mainly accessed information about veteran-related issues, services or benefits
- use of veteran or service charities
- veterans’ civilian life: levels of agreement that veterans felt like they belonged to their community and that veterans felt they had no say in what the government did
Patterns for all, rather than main, sources of information, advice or guidance and when a veteran said they looked for help from a charity by service-related factors are outlined in our accompanying datasets.
As with personal characteristics, age is also associated with a number of service-related characteristics in our data (for example, length of service, years since leaving and rank). Younger veterans were also more likely to have said they felt they had been bullied, discriminated against, or harassed during service than older veterans. This may relate to how perceptions of what constitutes bullying, discrimination or harassment have changed over time as raised in our cognitive testing and outlined in the Veterans’ Survey methodology. When we consider service-related characteristics in this article, we focus on patterns that we expect to exist regardless of the age profile of veterans within that category based on assessing the association between the characteristic and variable of interest after adjusting for age.
Our accompanying datasets provide information for veteran responses on all themes discussed in this article by a range of service-related factors (including service type, service branch, National Service, rank, reason for leaving the UK armed forces, number of years since leaving the UK armed forces, length of service, experiences of deployment and bullying, discrimination and harassment or sexual harassment during service).
Service branch
Regimental associations were considerably more likely to be cited by veteran Royal Marines as the main source of information (35.8%) than all other veterans: British Army veterans (21.5%), Royal Navy veterans (10.5%) and Royal Air Force veterans (4.6%). Royal Marines were less likely to have cited Veterans’ Gateway, national and local government channels, and social media than veterans who had served elsewhere, despite no large difference in age profiles between Royal Marine veterans and others.
Figure 10: Veterans that had served in the Royal Air Force were less likely than all other veterans to have cited regimental associations as their main source of information
Weighted percentages of responses to where veterans mainly received information about veteran-related issues, services or benefits by service branch. Veterans’ Survey 2022, UK.

Source: The Veterans’ Survey 2022 from the Office for National Statistics
Notes:
Only veterans who said they accessed information on veterans-related issues, services or benefits from at least one of the response options were asked where they mainly accessed their information from.
Blank responses to this question were removed from this analysis because of high levels of uncertainty.
Proportions may not sum to 100.
Reason for leaving
In line with our findings on disability and health, veterans who were medically discharged from the UK armed forces were more likely to cite word of mouth (20.7%) and veteran charities (19.7%) as their main source of information than those who left the forces for any other reason (for example, compared with those who left the UK armed forces because of compulsory discharge, where 15.3% said word of mouth from friends and family and 11.8% said veteran charities were their main source of information).
Over half of veterans (56.8%) who were medically discharged from the UK armed forces looked for help from veteran or service charities, which is higher than veterans who left the armed forces for any other reason (compared with 17.1% of those that left because their contract ended or they retired, 18.9% of those who left because of compulsory discharge, 19.2% of those that left by choice and 22.6% of those that left because they were made redundant).
Across the UK, those who were medically discharged from the UK armed forces were more likely to have disagreed (19.6%) or strongly disagreed (10.7%) that they felt like they belonged to their local community and less likely to have agreed (27.0%) or strongly agreed (9.3%) with the statement than those who chose to answer the question and left the forces for any other reason.
Rank
When we considered rank, we found that 15.3% of veterans that had served as commissioned officers looked for help from a charity which was a lower proportion compared with those of other ranks (25.0%).
Across the UK, veterans that had served at Officer ranks were less likely to have agreed to some extent that they felt they had no say in what the government does (54.7%) than those of other ranks (67.1%), this difference was driven by those that had served at Officer ranks being less likely than those who served at other ranks to have strongly agreed (23.5% compared with 36.0%).
Veterans that had served at Officer ranks were more likely than those of other ranks to have agreed to some extent (70.8% compared with 47.3%) and less likely to have disagreed to some extent (7.9% compared with 16.4%) with the statement ‘I feel like I belong to my local community’.
Figure 11: Veteran officers were more likely than veterans of other ranks to have agreed or strongly agreed that they felt they belonged to their local community
Weighted percentages of veteran responses to whether they felt like they belonged to their local community by rank. Veterans’ Survey 2022, UK.

Source: The Veterans’ Survey 2022 from the Office for National Statistics
Notes:
Blank responses to this question were removed from this analysis because of high levels of uncertainty.
Proportions may not sum to 100.
Experiences of deployment
Those who witnessed or took part in operations against enemy forces during their service were more likely to seek help from veteran or service charities (25.7%) than those who did not (16.9%).
Across the UK, those who witnessed or took part in operations against enemy forces were more likely to have agreed to some extent that they felt they had no say in what the government did compared with those who did not (65.9% compared with 60.4%), this difference was most pronounced for proportions that said they strongly agreed with this statement (35.3% compared with 29.0%).
Those who witnessed or took part in operations against enemy forces were equally as likely to have agreed to some extent that they felt they belonged to their local community as those who did not. However, they were more likely to have disagreed (4.6% strongly disagreed and 12.1% disagreed) with the statement that they felt they belonged to their local community than those who did not witness operations (2.8% strongly disagreed and 8.6% disagreed).
Perceived experiences of bullying, discrimination and harassment
Veterans who were subject to bullying during service were more likely to have looked for help from a veteran or service charity than those who were not (30.6% compared with 18.4%). Veterans who were subject to discrimination (34.8% compared with 19.5%) or harassment or sexual harassment (36.0% compared with 20.4%) followed the same pattern as those who were subject to bullying.
Figure 12: Veterans that said they were subject to bullying, discrimination or harassment during service were more likely to have looked for help from charities than those who said they were not
Weighted percentages of veterans that had looked for help from a charity by responses to bullying, discrimination and harassment questions. Veterans’ Survey 2022, UK.

Source: The Veterans’ Survey 2022 from the Office for National Statistics
Notes:
Blank responses to this question were removed from this analysis and answers of ‘Prefer not to say’ are presented in data tables but removed from this chart because of high levels of uncertainty.
Proportions may not sum to 100.
Across the UK, veterans who were subject to bullying were more likely to have agreed to some extent that they did not feel they had a say in what the government did (69.5% compared with 61.2%), the difference was more pronounced among those that strongly agreed (39.9% compared with 29.6%).
When we considered responses to the question about whether veterans agreed they felt they belonged to their community, those that said they were subject to bullying were more likely to have disagreed to some extent with this statement than those who were not (21.8% compared with 10.6%).
Similar patterns can be seen in our accompanying datasets for the discrimination and harassment questions.
Future publications
Further findings from the Veterans’ Survey 2022 will be published throughout 2024 and will include themed analysis covering topics such as the housing and income and health and well-being of UK armed forces veterans.
Data
Community engagement, weighted estimates, Veterans’ Survey 2022, UK
Dataset | Released on 9 August 2024
UK armed forces veterans and community engagement by personal and service-related characteristics, weighted estimates, Veterans’ Survey 2022, UK
Keywords: trust in government, belonging to community, rank, health, deployment
Sources of information, weighted estimates, Veterans’ Survey 2022, UK
Dataset | Released on 9 August 2024
Source of information by personal and service-related characteristics, weighted estimates, Veterans’ Survey 2022, UK
Keywords: regimental associations, charity, social media, word of mouth, veteran services
Veteran or service charity use, weighted estimates, Veterans’ Survey 2022, UK
Dataset | Released on 9 August 2024
UK armed forces veterans and veteran or service charity use by personal and service-related characteristics, weighted estimates, Veterans’ Survey 2022, UK
Keywords: rank, disability, health, deployment, military
Veterans’ Gateway and Veterans UK, weighted estimates, Veterans’ Survey 2022, UK
Dataset | Released on 9 August 2024
Awareness, use and satisfaction of services by personal and service-related characteristics, weighted estimates, Veterans’ Survey 2022, UK
Keywords: rank, health, disability, deployment, military
Glossary
Confidence intervals
Veterans’ Survey 2022 estimates are presented in our data with 95% confidence intervals. At the 95% confidence level, over many repeats of a survey under the same conditions, one would expect that the confidence interval would contain the true population value 95 times out of 100. Confidence intervals presented are based on complex standard errors (CSEs) around estimates, which reflect the design effects calculated for England and Wales Veterans’ Survey 2022 data as outlined in Veterans’ Survey 2022 methodology.
Deployment
Respondents that were completing the survey on their own behalf (without assistance) were asked ‘During your service did you deploy on an Operational Deployment (named operations)?’
All respondents who said they were deployed on an Operational Deployment (named operation) were also asked: ‘Did you witness or take part in operations against enemy forces?’
Disability
People who assessed their day-to-day activities as limited by long-term physical or mental health conditions or illnesses are considered disabled. This definition of a disabled person meets the harmonised standard for measuring disability and is in line with the Equality Act 2010.
Economic activity status last week
Veterans aged 18 years and over were classified as ‘working’ if they were economically active and in employment in the previous 7 days.
‘Unemployed’ refers to people who said they were out of work during the same period but were either looking for work, and could start within 2 weeks, or were waiting to start a job that had been offered and accepted.
‘Economically inactive’ refers to veterans aged 18 years and over who did not have a job in the previous 7 days, and who had not looked for work in the previous 4 weeks or could not start work within 2 weeks.
Income
All respondents were asked about their income using the question: ‘What was your total personal income from all sources over the last 12 months?’. This is your own gross income – before anything like tax is taken off.
Respondents were asked to include: all earnings (include overtime, tips, bonuses, self-employment), all pensions, all student loans, grants and bursaries, all benefits and tax credits (such as child benefit, income support or pension credit), all interest from savings or investments, housekeeping from other household members, all rent from property (after expenses) and other income (such as maintenance or grants). Respondents were asked to not deduct taxes, National Insurance contributions, pension contributions or health insurance payments.
Personalised care plan
The personalised care plan question asked of all respondents was: ‘Do you have complex and long-term healthcare needs that require a personalised care plan to support your health and wellbeing?’.
Respondents were informed that personalised care planning is essentially about addressing an individual’s full range of healthcare needs, treating the person ‘as a whole’, with a strong focus on helping people, together with their carers to achieve the outcomes they want for themselves.
Rank
A veteran specific derived variable was created for rank. This derived variable was designed to differentiate between commissioned officer and non-officer ranks. The ONS worked with the MoD and the OVA to group the list of ranks for each service type into these categories. There were a small number of responses that could not be coded appropriately, and these are excluded from our analysis for this publication.
Reason for leaving
All respondents were asked: ‘For what reason did you leave the UK Armed Forces?’. Response options were: ‘By choice’, ‘End of contract or retirement’, ‘Made redundant’, Medical discharge’, ‘Compulsory discharge’ or ‘Prefer not to say’.
Service branch
All respondents were asked ‘Which service were you in before you left?’. Response options were: ‘Royal Navy’, ‘Royal Marines’, ‘British Army’ or ‘Royal Air Force’.
UK armed forces veteran
This analysis defines veterans as people aged 18 years and over who have previously served in the UK armed forces. This includes those who have served for at least one day in the UK armed forces, either regular or reserves, or merchant mariners who have seen duty on legally defined military operations.
It does not include those who have left and since re-entered the regular or reserve UK armed forces, those who have only served in foreign armed forces, or those who have served in the UK armed forces and are currently living outside of the UK.
Data sources and quality
Veterans in this research have been identified using the Veterans’ Survey 2022 (for more information, see our Veterans’ Survey methodology).
Quality
Weighting for England and Wales Veterans’ Survey, 2022
The age profile of veterans responding to the survey differed from the age profile of veterans identified in Census 2021, with survey respondents being younger than veterans from Census 2021. This may reflect the fact the survey was predominantly online or that marketing and promotion of the survey was more likely to reach younger veterans.
We used raking techniques to generate weights for England and Wales survey responses. This was based on the proportions of veterans we would expect to be within given age bands when we considered the age range of veterans from Census 2021. You can read more about this in our Veterans’ Survey methodology.
Northern Ireland and Scotland, Veterans’ Survey 2022
There was no veteran population data available for Northern Ireland or Scotland that could reliably be used to assess the representativeness of responses to the Veterans’ Survey from people that lived in these countries. Veteran population data from the Scotland Census 2022 was not available by the time this report was written.
Responses from Northern Ireland and Scotland remain unweighted. This principle was maintained even when a respondent gave a postcode that suggested they had an alternative address in England or Wales. However, assumptions are made about bias in respondent profiles from Northern Ireland or Scotland, based on biases we identified in the survey respondents’ profiles from England and Wales as compared with data from Census 2021. This gives us a strong understanding of the veteran population in England and Wales.
We have also assumed additional uncertainty because of the sample design based on England and Wales data and included a design effect in the origin of complex standard errors for UK level Veterans’ Survey, 2022 data. You can read more about this in our Veterans’ Survey methodology.
Bias in sample profile, Veterans’ Survey 2022
Despite weighting the data to compensate for known biases in the Veterans’ Survey 2022, some biases remain as outlined in our demographic overview and coverage analysis article. Awareness of these can be used to help interpretation of results and to guide future analysis.
Statistical disclosure control
To ensure statistical disclosure conditions are met in our UK analysis, we do not publish estimates for data based on fewer than 3 respondents.
We have not published country level data for the Veterans’ Survey 2022 and instead described the general patterns found in our analysis in our accompanying datasets. This is to avoid the feasibility of calculating (from overall response figures or from future planned analysis) respective counts of respondents within a given category, who stated they lived in Wales, Northern Ireland or Scotland. There are a smaller number of respondents in these countries.
Related links
The Veterans’ Survey 2022, demographic overview and coverage analysis, UK
Article | Released 15 December 2023
Coverage and sample bias analysis of the Veterans’ Survey 2022, with weighted estimates for veteran responses in the UK by personal characteristics.
Veterans’ Survey 2022 to Census 2021 linkage report
Methodology | Released 15 December 2023
Quality of the linkage between Census 2021 and the Veterans’ Survey 2022 and main findings.
Veterans’ Survey methodology
Methodology | Released 15 December 2023
Overview of the development, processing, data cleaning and weighting of the Veterans’ Survey 2022.
Harmonised standard for previous UK armed forces service
Methodology | Released 16 March 2022
Detail on how the measurement of previous UK armed forces service has been made more comparable, consistent, and coherent.