Case rates by region
Published 23 October 2020
Applies to England

© Crown copyright 2020
This publication is licensed under the terms of the Open Government Licence v3.0 except where otherwise stated. To view this licence, visit nationalarchives.gov.uk/doc/open-government-licence/version/3 or write to the Information Policy Team, The National Archives, Kew, London TW9 4DU, or email: psi@nationalarchives.gov.uk.
Where we have identified any third party copyright information you will need to obtain permission from the copyright holders concerned.
This publication is available at https://www.gov.uk/government/publications/lower-tier-local-authority-watchlist-epidemiological-data-23-october-2020/case-rates-by-region
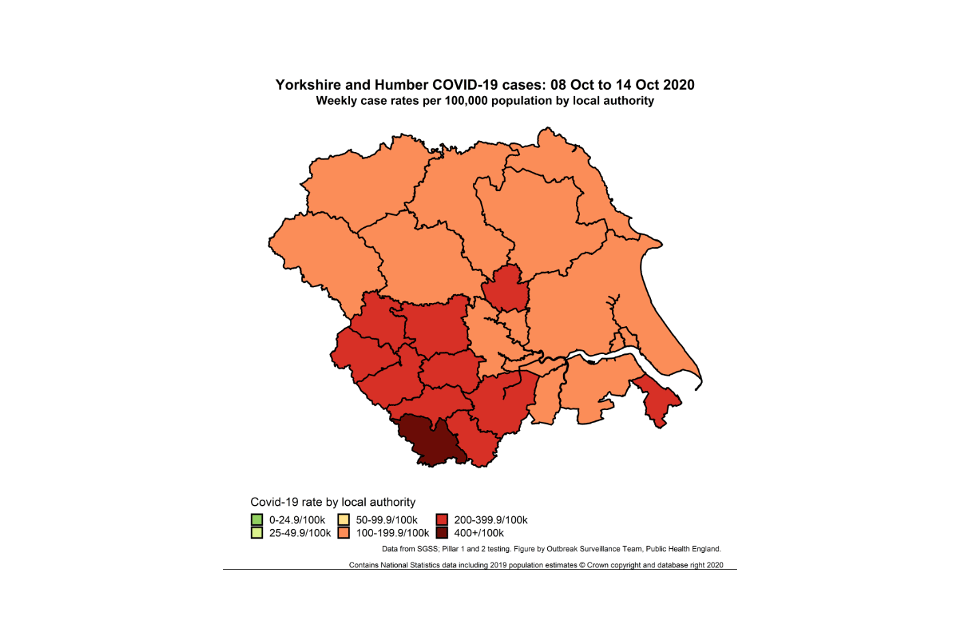
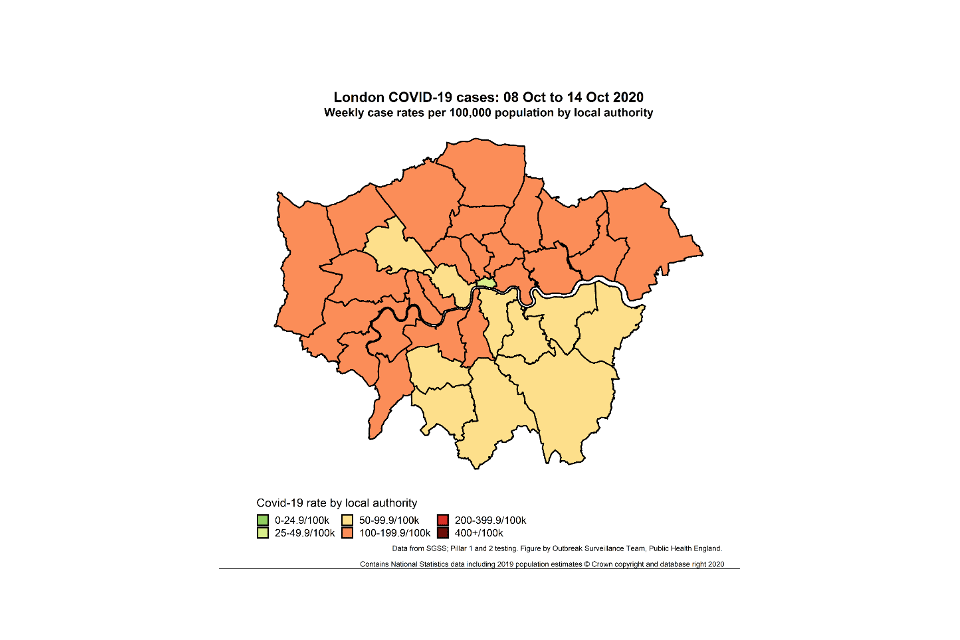
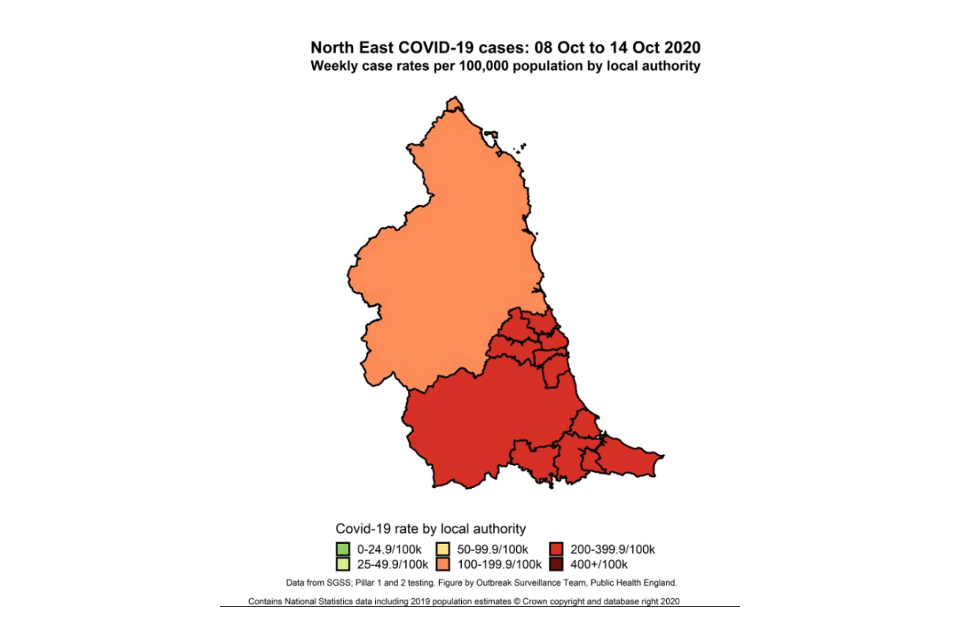
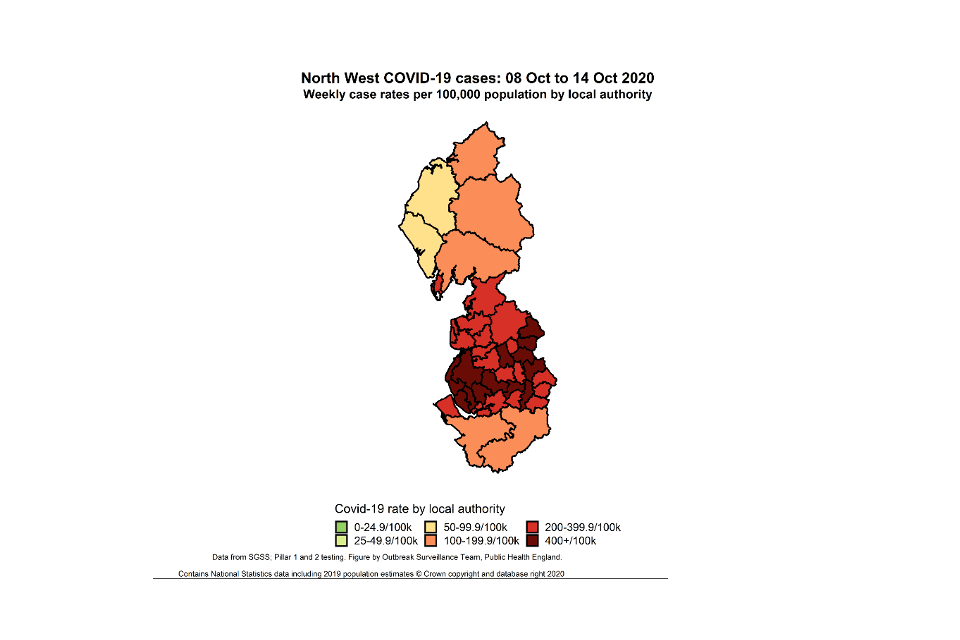
COVID-19 cases in England
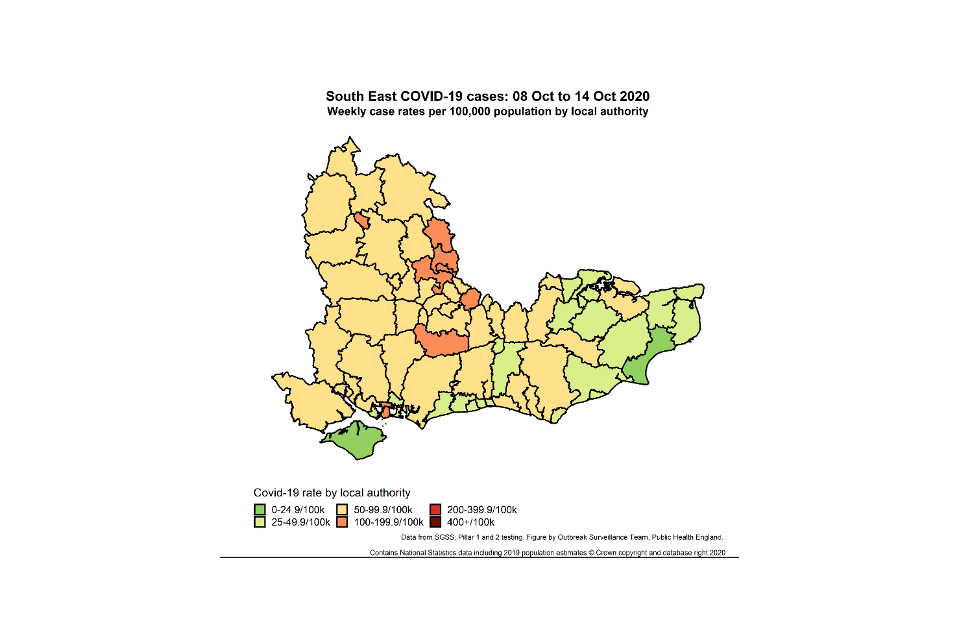
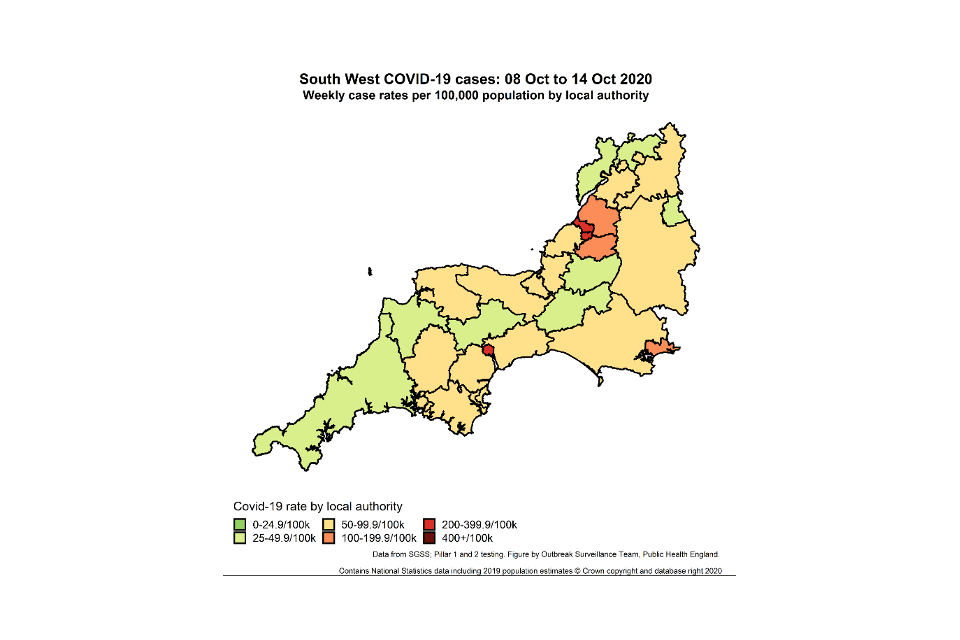
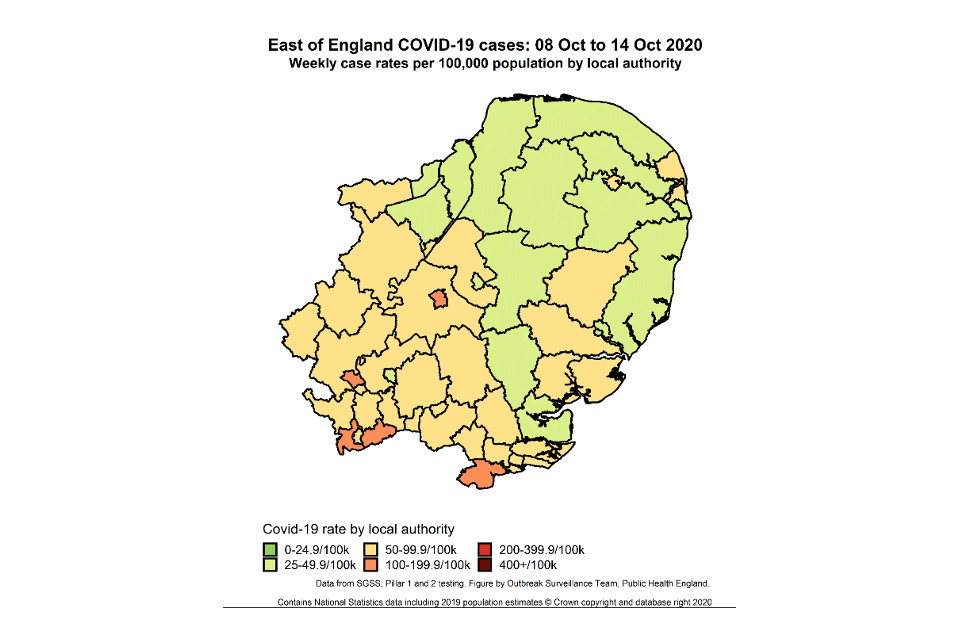
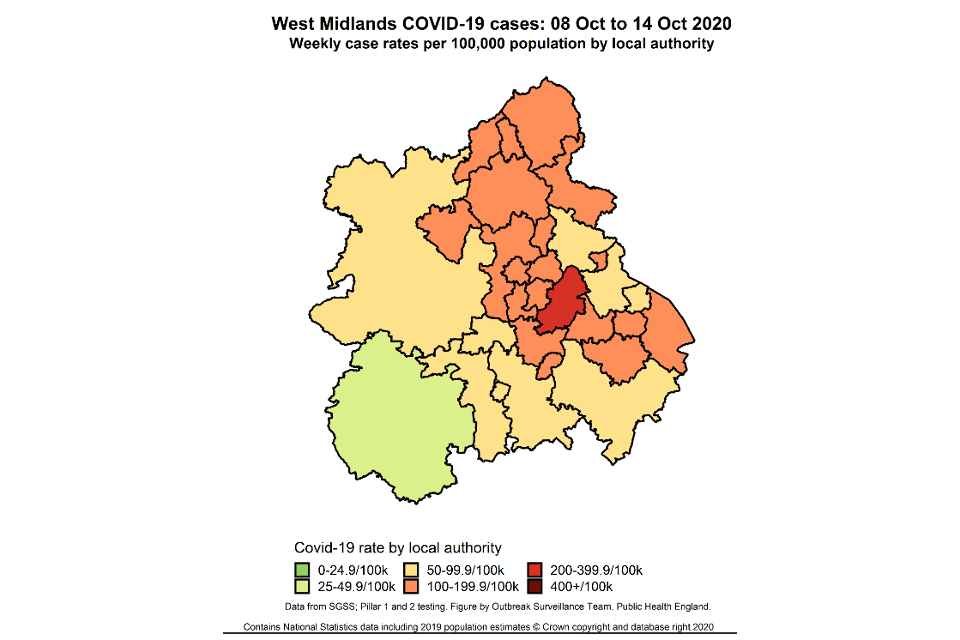
The below maps show the concentration of COVID-19 cases by regions in England for the period of 8 to 14 October 2020.
To see the data for these maps, see Case rates by region: data sets.
London
North East
North West
South East
South West
East of England
East Midlands

West Midlands
Yorkshire and Humber