Low Pay Commission summary of evidence 2024
Published 30 October 2024
1. Introduction
The Low Pay Commission (LPC) is the independent body which advises the Government on the National Minimum Wage (NMW), including the National Living Wage (NLW). We are a social partnership, comprising worker representatives, employer representatives and independent experts.
This short report sets out some of the key evidence behind our recommendations on the minimum wage rates to come into effect from 1 April 2025. It should be read alongside our letter to the Government. Our full annual report containing all the evidence will be laid before Parliament and published in the new year.
We met in October 2024 to agree our recommendations, which were submitted to the Government on 25 October. The Government accepted our recommendations in full at the Budget on 30 October. Our remit from the Government is summarised on the following page. All sources and references for charts and data can be found at the end of this report.
For the second year in a row, we have not had a full complement of Commissioners. We have only had two worker representatives since the start of 2023. The continuing failure to appoint a third worker representative is deeply frustrating. We hope it is remedied as soon as possible, particularly given the Government’s ambitions for the minimum wage policy.
The NLW and NMW rates effective from April 2025 are shown below.
1.1 Rates to apply from 1 April 2025
| NMW rate | Annual increase (£) | Annual increase (per cent) | |
| National Living Wage (for those aged 21 and over) | £12.21 | £0.77 | 6.7 |
| 18-20 Year Old Rate | £10.00 | £1.40 | 16.3 |
| 16-17 Year Old Rate | £7.55 | £1.15 | 18.0 |
| Apprentice Rate | £7.55 | £1.15 | 18.0 |
| Accommodation Offset | £10.66 | £0.67 | 6.7 |
Sources and references for all the charts on this page can be found in the PDF published alongside.
2. Our remit for 2024
Following the general election, the Government published its remit for the LPC in July.
In September, we set out how we would respond to the remit.
3. Our recommended NLW rate takes us to two-thirds of median earnings
Alongside business conditions, the new remit asks the NLW recommendation to:
-
take account of the cost of living and expected inflation up to March 2026; and
-
not fall below two-thirds of median hourly earnings.
In September, we said that each of these requirements acted as a potential ‘floor’ to our recommendations. Wages, however, have risen faster than inflation over the past 12 months, and are forecast to continue to do so up to March 2026. Because of this, the benchmark of two-thirds of median earnings was a higher floor and a greater influence on our NLW recommendation.
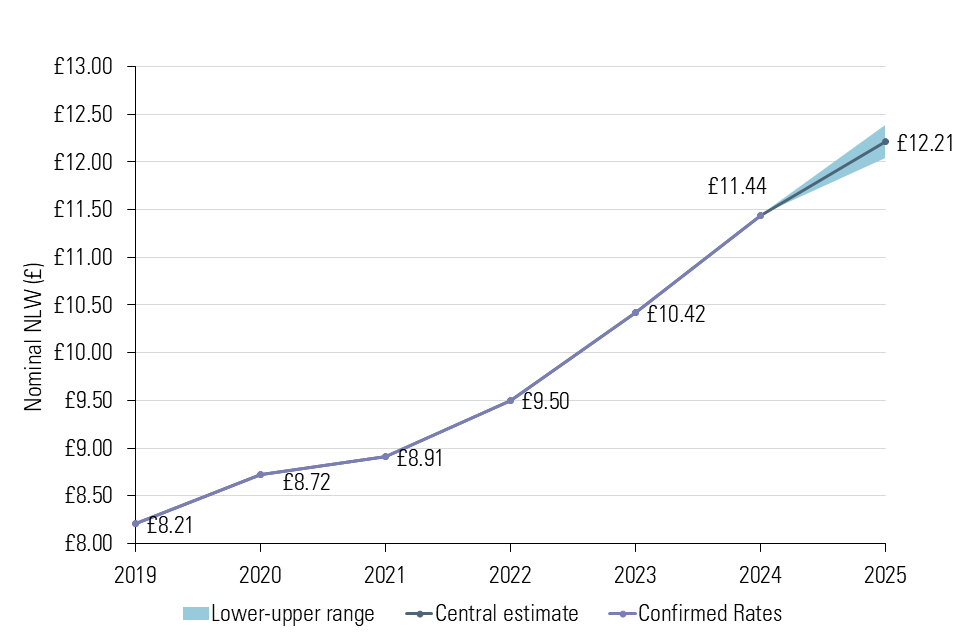
We now estimate that £11.44 was not high enough to meet the two-thirds of median earnings target in 2024. A rate of £11.76 would have been necessary to achieve this.
This is down to two factors. Firstly, wage growth has been stronger than forecast and, as a result, the wage forecasts used in our projections have been revised up. Secondly, the Office for National Statistics (ONS) amended its methodology for the Annual Survey of Hours and Earnings (ASHE), a key source of data for calculating the rate. We explore these factors in more detail on the next page.
We expect our recommendation of £12.21 for April 2025 to make up the ground lost and to meet the two-thirds benchmark in 2025.
3.1 Path of the National Living Wage, 2019-2025
4. Stronger pay and forecasts and a change to the ASHE methodology increased our estimate of the NLW needed in 2025
The remit asks us to ensure the NLW does not fall below two-thirds of median hourly earnings in 2025. Our projections of this are derived from ASHE median hourly earnings in April; Average Weekly Earnings (AWE) pay data from then to August and wage forecasts up to the following October.
This time last year we expected an NLW of £11.84 was needed to stay at two-thirds by October 2025. But this has increased over the year as each part of the calculation has changed.
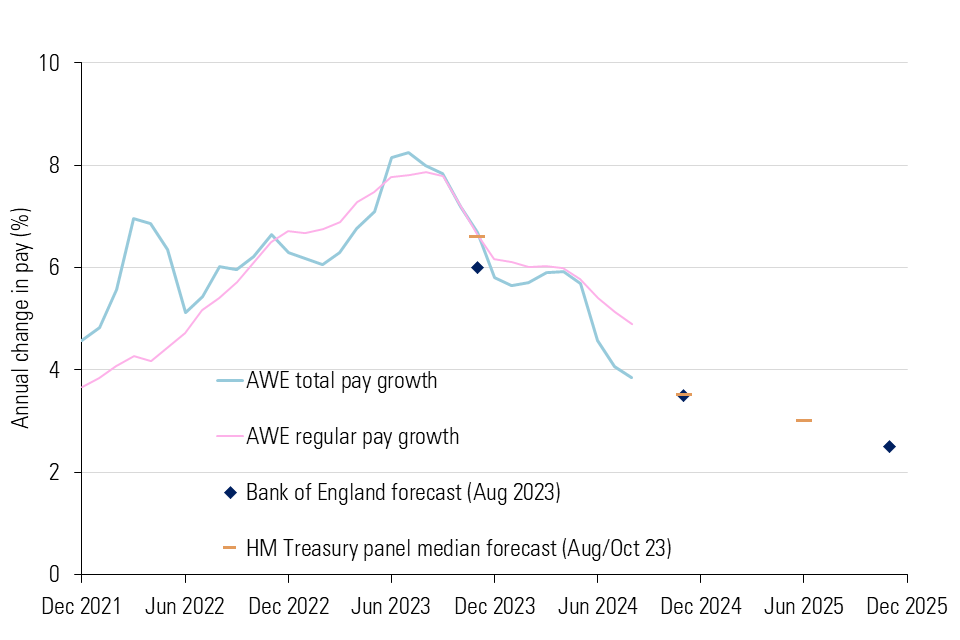
Firstly, AWE has so far grown by more than expected over 2024. It was forecast to be around 3.5 per cent by the end of 2024. While AWE total pay growth slowed to 3.8 per cent in August 2024, this was partly driven by the effects of large bonuses paid to the public sector in 2023. We expect total pay growth to rebound when these bonuses fall out of annual comparisons in the fourth quarter of 2024. Regular pay growth and private sector pay growth remain close to 5 per cent.
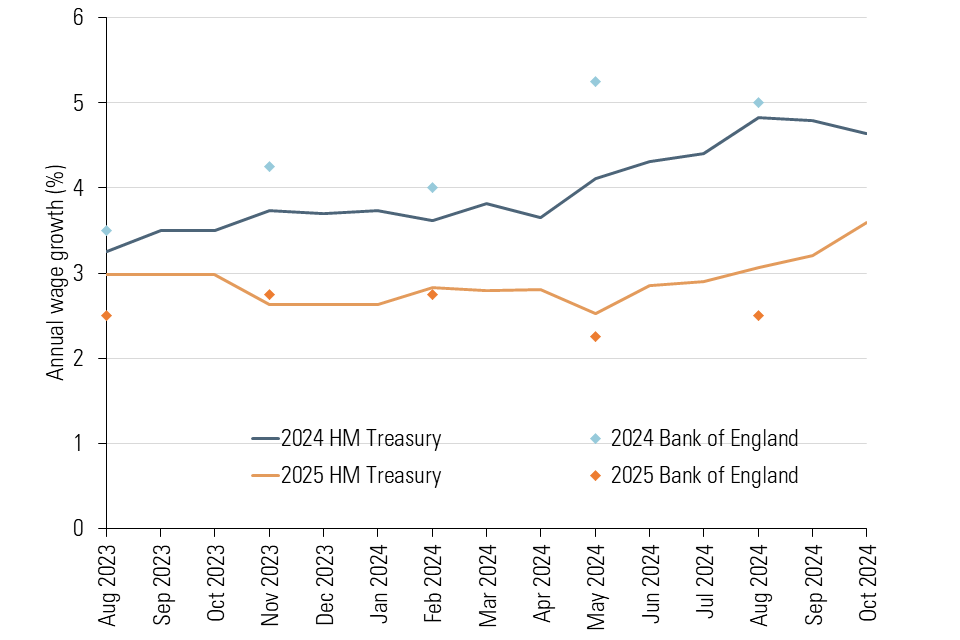
This stronger than expected wage growth led forecasters to revise up their expectations for 2024 and 2025 (lower chart). Since March 2024, these have been revised from 3.8 to 4.6 per cent in 2024, and from 2.8 to 3.6 per cent in 2025.
Finally, ONS changed its ASHE methodology to cover more high earners, following concerns it was under-counting them. This resulted in higher medians in 2023 and 2024.
In total, these changes have added 37 pence to our original projection of £11.84 in October 2023. Around 14 pence is due to the ASHE method change, with the growth in pay and the forecasts making up the rest (around 23 pence).
4.1 Annual average wage growth, actual and forecast, 2021-2025
4.2 Wage forecasts for 2024 Q4 and 2025 Q4 by month of forecast, 2023-2024
5. Inflation has slowed and is expected to remain low over the next few years
In recommending an NLW rate for April 2025, our remit asked us to take account of the cost of living.
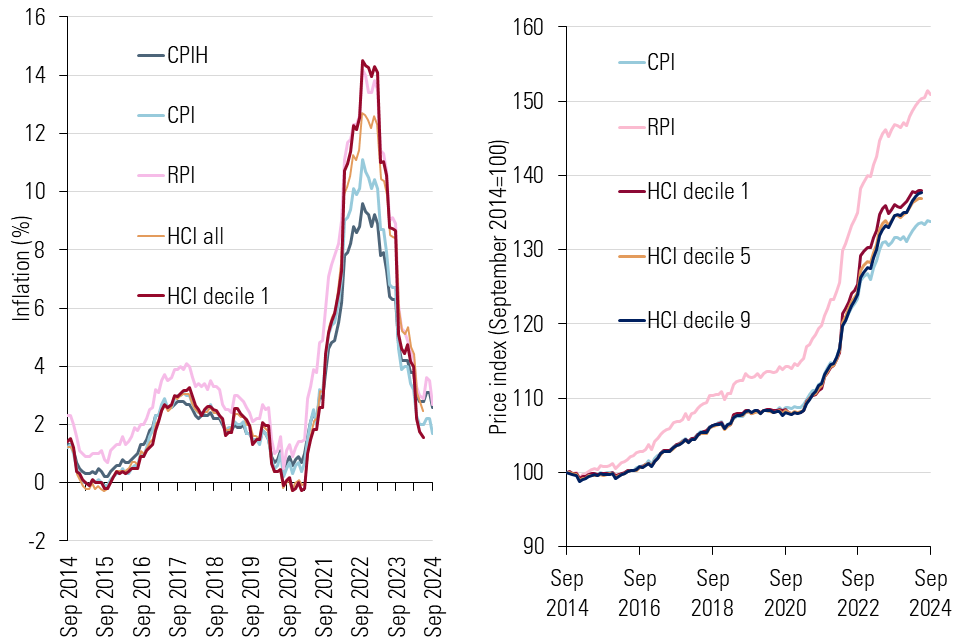
There are several measures available. All have merits, but no one measure meets all needs. We have looked at a broad range, including headline inflation (CPI, CPIH and RPI, the latter for indicative purposes), the ONS Household Cost Index (HCI) and the Minimum Incomes Standard. These allow a granular understanding of the price pressures faced by different types of households.
After the pandemic, HCI decile 1, which measures inflation for the lowest-income households, rose much faster than for other deciles. Increases in energy, fuel and food prices had a larger impact on those in lower-income deciles because they take up a larger share of those groups’ income. As price increases of these essential goods and services have slowed or fallen back. It is now the lowest income deciles that face the smallest price increases, and the various measures are more aligned.
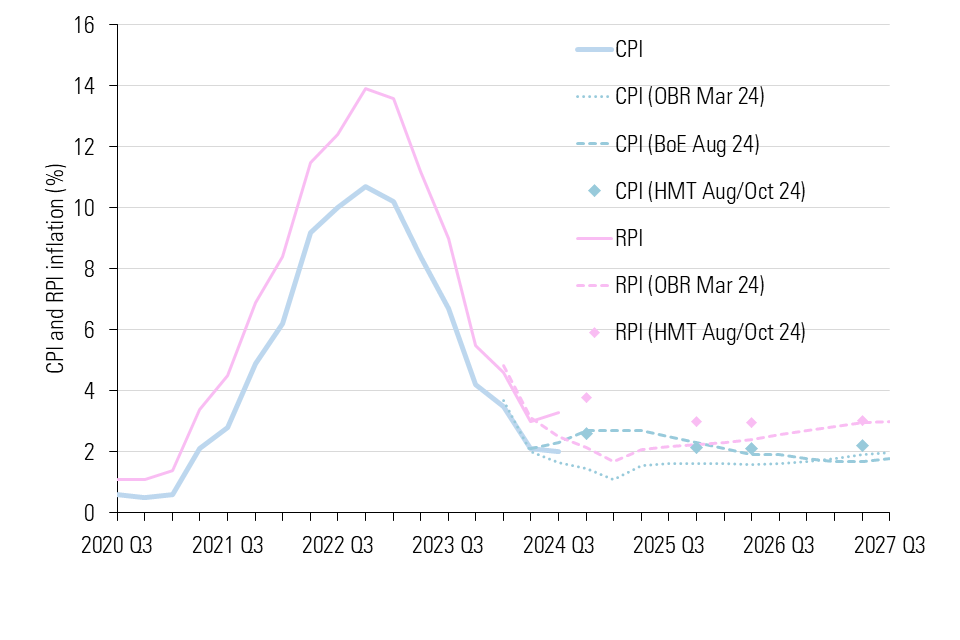
The latest forecasts for inflation are for CPI to remain close to the Bank of England’s 2 per cent target in the medium term. However, while inflation has slowed that does not mean the cost-of-living crisis has ended. Prices are still much higher now than they were in 2021. On the next page we discuss how this has affected our rate recommendations.
5.1 Inflation rates, 2014-2024 (left-hand side) and Price index (September 2019=100), 2014-2024 (right-hand side)
5.2 CPI and RPI forecasts, 2020-2027
6. The NLW increase will protect the wage floor in real terms
Our remit asked us, when making our 2025 NLW recommendation, to take account of the cost of living, “including the expected annual trends in inflation between now and March 2026.”
We need inflation forecasts to do this. However, we are limited by the lack of publicly available and timely forecasts. There are no forecasts for HCI, and only the Bank of England forecasts CPI on the quarterly basis we need to meet the remit.
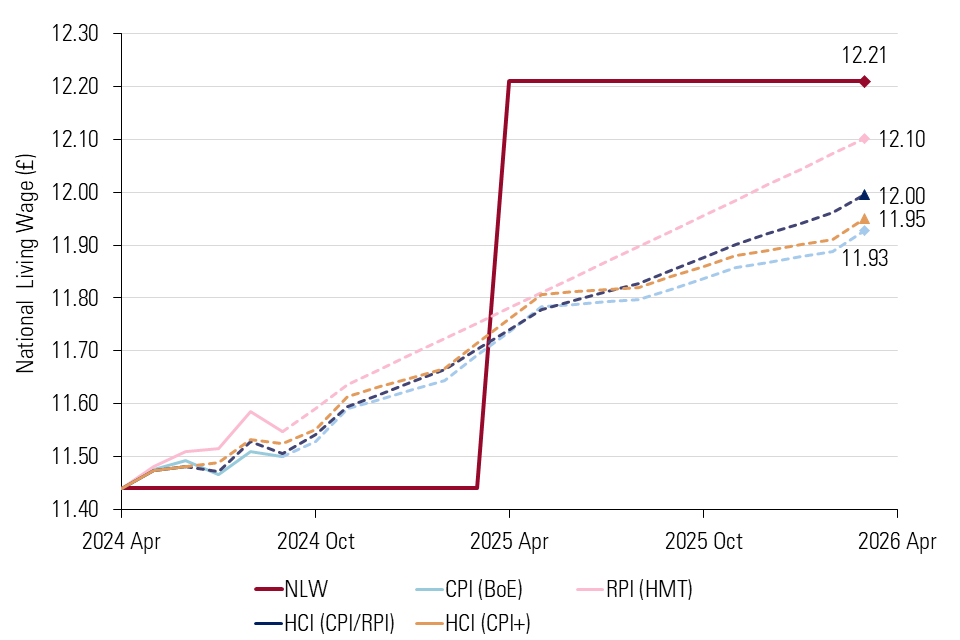
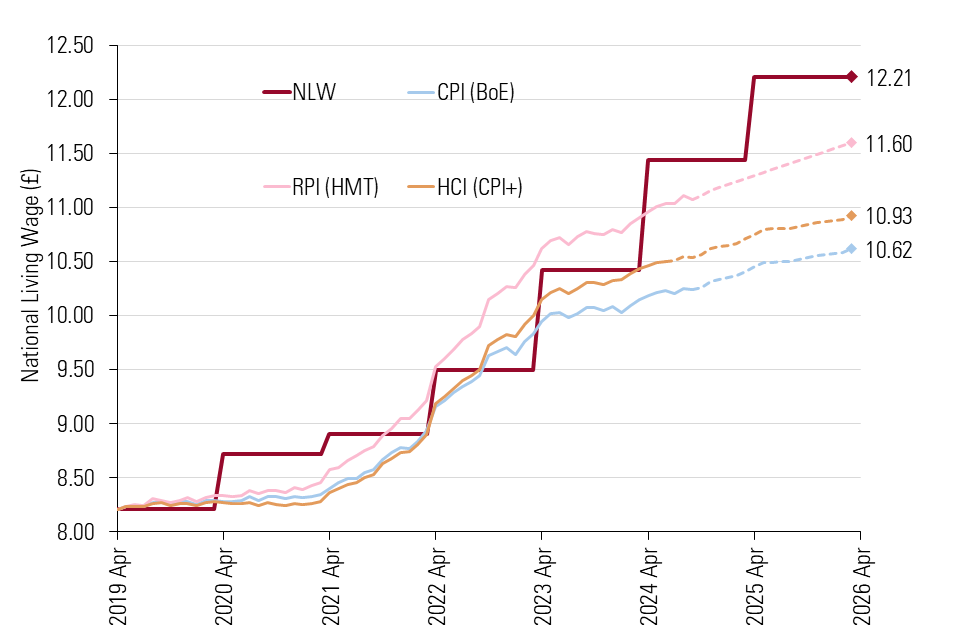
In assessing whether the NLW would maintain or exceed its real value, we used CPI forecasts from the Bank of England, RPI forecasts from a small subset of the HM Treasury panel and developed our own pseudo-forecasts for HCI. These used a trajectory based on the historic relationship with CPI (HCI (CPI+)), and a trajectory that used a mid-point between the CPI and RPI forecasts (HCI (CPI/RPI)). The HCI projections shown in the charts use HCI for all households. There tended to be little difference in the forecasts across the deciles.
The upper chart shows that we project that an NLW of £12.21 will be higher than expected inflation up to March 2026 on a range of measures (the chart shows the value of the NLW if it were uprated with each of these measures). To maintain its April 2024 value against HCI and CPI, it would need to be around £12.00 and £11.93 respectively by March 2026.
These figures measure inflation from March 2024 to March 2026. This is slightly longer than the remit asks – July 2024 (“now” in the remit) to March 2026. So these figures are slightly higher than what the remit requires.
The lower chart shows that the NLW has increased by more than all of these inflation measures since 2019, the period covering the cost-of-living crisis.
6.1 NLW uprated in line with various inflation measures, April 2024 to March 2026
6.2 NLW uprated in line with various inflation measures, April 2019 to March 2026
7. The NLW’s impact on living standards depends on other factors
The impact of the NLW on living standards is driven by the number of hours available to low-paid workers, their household circumstances and the tax and benefits system.
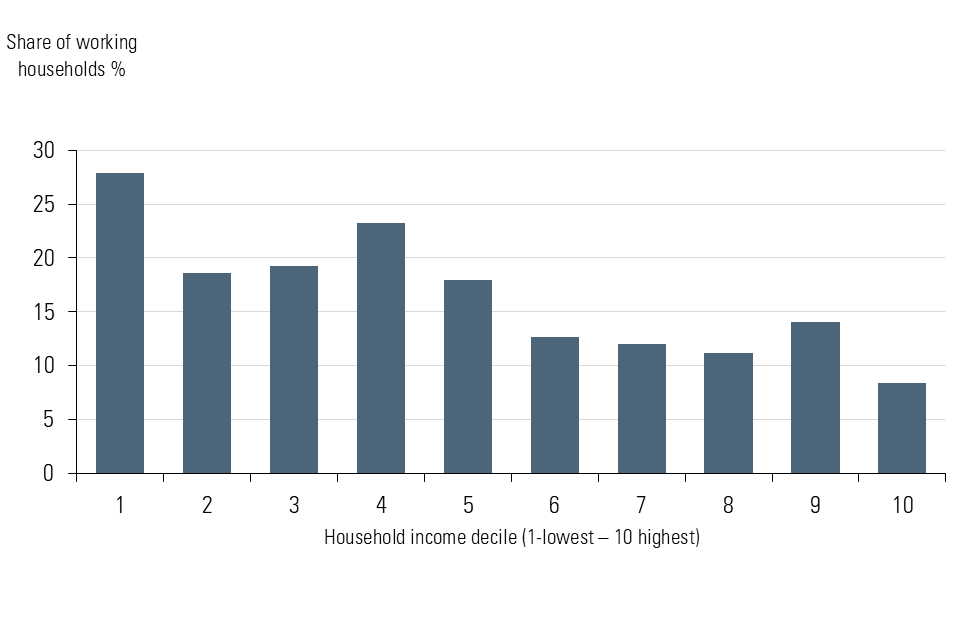
Workers earning the NLW are found across the working household income distribution. While one in six of all households contain an NLW worker, their concentration is greatest in the lower half of the distribution; 28 per cent of households in the bottom income decile of working households have an NLW worker in them, the majority of whom are the household’s highest earner.
The NLW is set as an hourly rate – but workers’ total income depends on the number of hours they work. As we go on to explore on the following page, ensuring sufficient hours of work can be challenging for many low-paid workers.
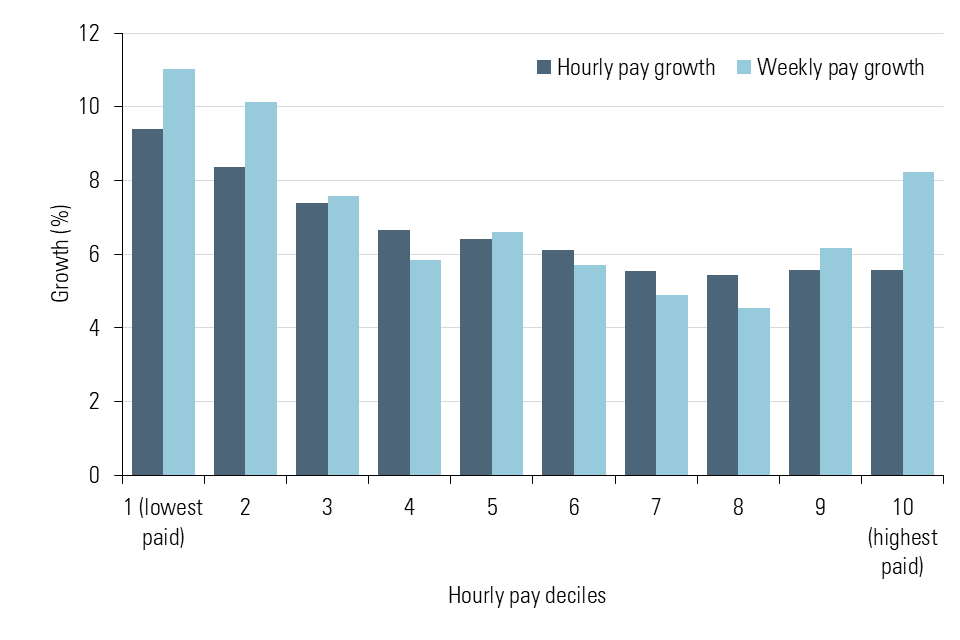
This year, however, after declining for the past three years, we saw average hours increase for minimum wage workers. This resulted in average gross weekly pay for the lowest-paid increasing by more than average hourly pay. This shows that the rising wage floor has translated into higher weekly pay as well.
7.1 Share of working households with at least one NLW worker, by income decile, 2022-23
7.2 Nominal growth in mean hourly pay and weekly pay, by hourly pay deciles, 2024, 21+
8. Workers’ anxieties over living standards have not eased in the past year
Although this is the first year that our remit has explicitly asked to take into account the cost of living, it has long been an important element of the evidence we collect from low-paid workers. Discussions with workers in low-paying sectors make up a substantial part of our evidence-gathering each year.
We meet with workers to understand their experience of low-paid work and what difference the minimum wage makes for their living standards. These discussions reinforce the idea that a combination of factors affect individuals’ living standards, of which the NLW is an important element but not the only one.
This year, we heard that workers are still experiencing the high cost of living and have seen their spending power and living standards decline in recent years. Although the NLW’s real value is the highest it has been, upratings have been experienced as a partial mitigation at best.
Obviously you don’t recognise it in your pay packet at all. You know, you don’t see it because obviously the cost of living is just through the roof at the moment with everything: bills, food, petrol, everything.
Warehouse worker, Coventry
£12 is nowhere near what it should be. To not worry, you need £15 per hour … You just can’t afford to live now.
Retail worker, Glasgow
Insecurity over jobs, hours and levels of pay remain key features of low paid work
Insecurity and precarity at work were central themes in evidence from workers, unions, and other groups. The most common forms of insecurity involve volatility in pay and hours. As the TUC’s submission summarised, “insecure work has an enormous effect on workers. The prospect of having work offered or cancelled at short notice makes it hard to budget household bills or plan a private life.”
For many workers we meet, the difficulty of finding reliable full-time work is a major source of stress.
[To get a full-time job] you’d only end up in care, and you’d be working weekends, and they’d be pulling you in hours and hours and hours … [large retailers] will only give a you a very limited contract… So it’s very difficult to go and find a Monday to Friday job.
Retail worker, Isle of Wight
Workers face inadequate benefit levels, rising housing costs, fluctuating UC payments, and disincentives to work more hours
Many of the low-paid workers we speak to have experience of Universal Credit. The interaction between work and benefits is a significant concern for many low-paid workers. The benefits system can have an important effect on the choices workers make about their job.
There are certain aspects of the benefits system – Universal Credit in particular – which create difficulty for low-paid workers. For example, the monthly assessment period for UC does not match many low-paid workers’ pay reference periods. This means their UC payments can fluctuate at certain points in the year.
We also see some confusion – among both workers and employers – about UC and how it interacts with individuals’ working hours and incomes. It seems to us that the rules are often poorly understood and there’s a lot of inertia in how jobs are designed.
people end up with big amounts to pay back that they weren’t expecting and they get themselves into financial trouble with being able to pay that money back. So sometimes people don’t claim things they’re entitled to because they’re frightened of being fined at the other end if they make a little mistake.
Employment charity, Dover
9. Workers are reluctant to switch jobs due to concerns about job security
Insecurity and risks to income and living standards also weigh on workers’ willingness to move jobs.
But why move somewhere if you’re on worse conditions, starting at bottom of ladder … It’s scary to jump to another job, not knowing is my contract going to protect me? Will I make enough to pay rent? It’s easier to just to stick with what you’ve got if you know that I’m making ends meet at the moment. Hospitality worker, Glasgow
I’m scared to move now because this is working for me. … you hear some scary stories about these zero hour contracts [where] they say everything, but they never even give you the hours. I wouldn’t want to do a zero hour contract, so hence why I’m kind of staying put.
Warehouse worker, Wolverhampton
A variety of other factors combine to inhibit low-paid workers’ job mobility. A lack of training and limited progression opportunities, high childcare costs and a lack of access to public transport are frequently cited factors making it harder for low-paid workers to move jobs and improve their living standards.
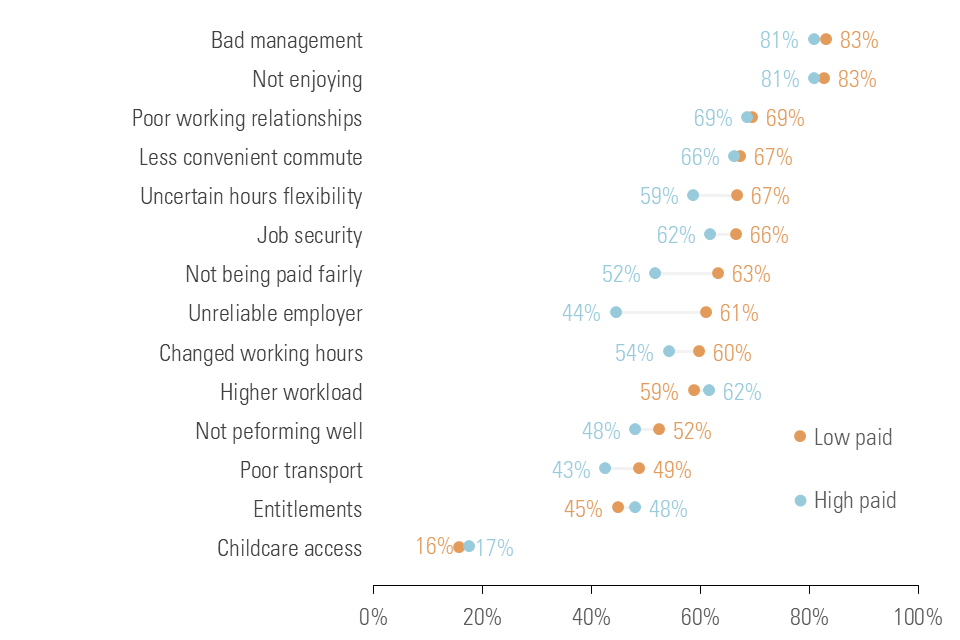
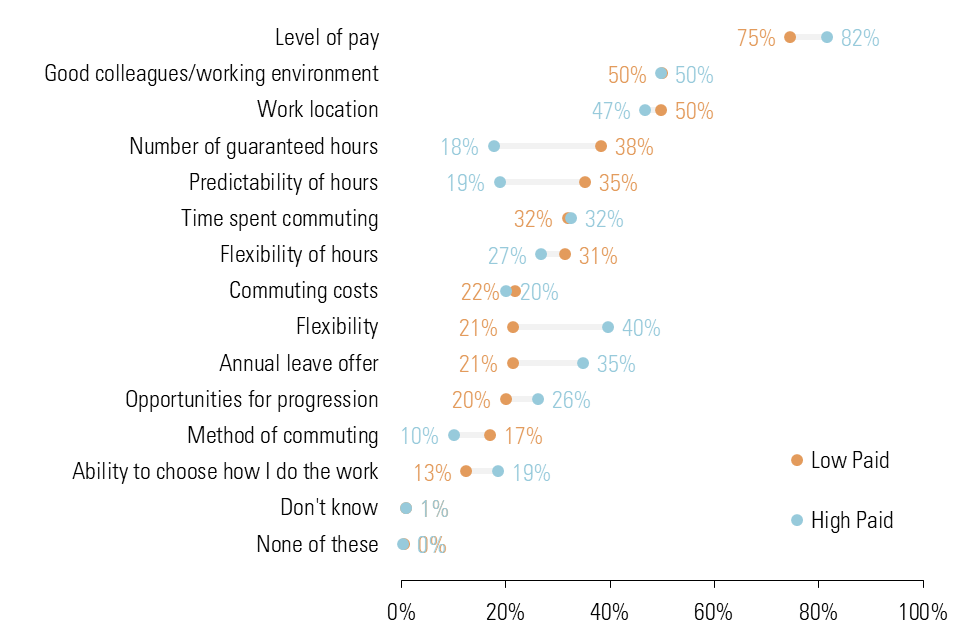
This is consistent with research we commissioned from YouGov last year. This showed that workers believe there are many risks to moving jobs, but low-paid workers are more worried about not being paid fairly and having an unreliable employer. When thinking of new jobs, both volume and predictability of hours are more important for low-paid workers.
9.1 Share of workers who would be worried about each factor if thinking about taking a job with a different employer, 2023
9.2 Most important factors when considering moving job, 2023
10. The economy recovered in the first half of 2024 but growth remains weak
Economic and business conditions are key considerations for our rate recommendations. GDP grew by just 0.3 per cent in 2023. When we made our recommendations last year, forecasters expected weak growth to continue (0.4-0.5 per cent in 2024). However, after falling into a shallow recession at the end of 2023, the UK economy rebounded strongly in the first half of 2024, beating expectations.
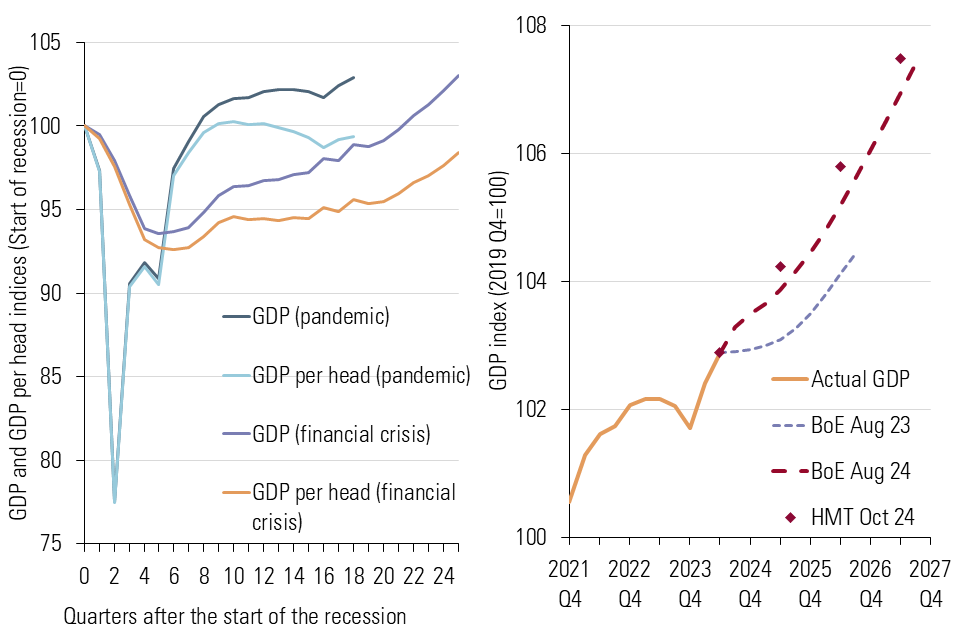
GDP grew by 1.2 per cent in the first half of 2024 and is now 2.9 per cent above its pre-pandemic level, recovering faster than it did after the financial crisis. GDP per head, though, has still not recovered to pre-pandemic levels.
GDP is also expected to grow in 2025. Inflation has fallen, real wages are growing and interest rates have started to fall. These factors have raised confidence, and the latest Bank of England and HM Treasury panel forecasts expect growth to be more than twice (around 1.0-1.3 per cent in 2024 and 2025) what they expected this time last year. The IMF and OECD forecast the UK economy to grow a bit more strongly in 2025 (around 1.2-1.5 per cent).
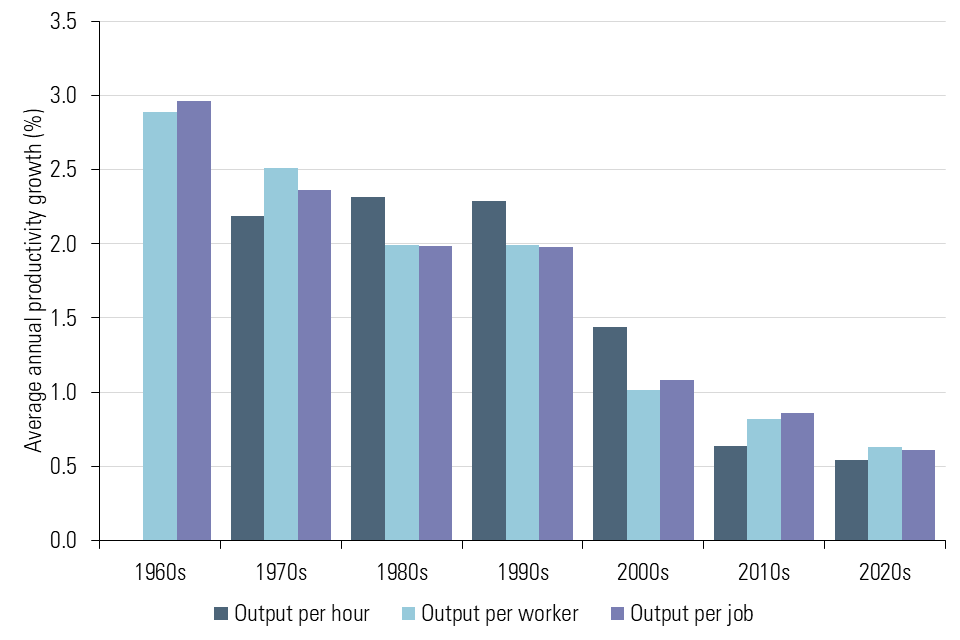
Productivity growth in the UK continues to disappoint. Growth in output per hour, per job and per worker has increased much more slowly in recent decades – with growth falling from around 2 per cent a year in the 1960s-1990s to around 1 per cent in the 2010s to only 0.5 per cent in the 2020s.
10.1 GDP and GDP per head index (start of recession=100) (left-hand side) and GDP and forecast GDP index (2019 Q4=100), 2021-2027 (right-hand side)
10.2 Productivity growth by decade, 1960s-2020s
11. Low-paying sectors and smaller firms are more likely to have concerns
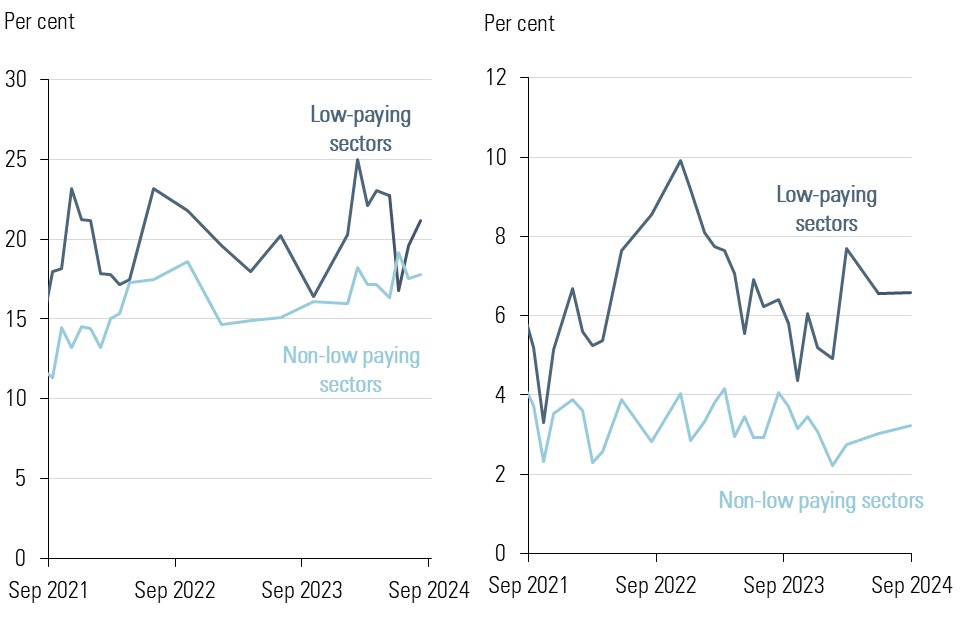
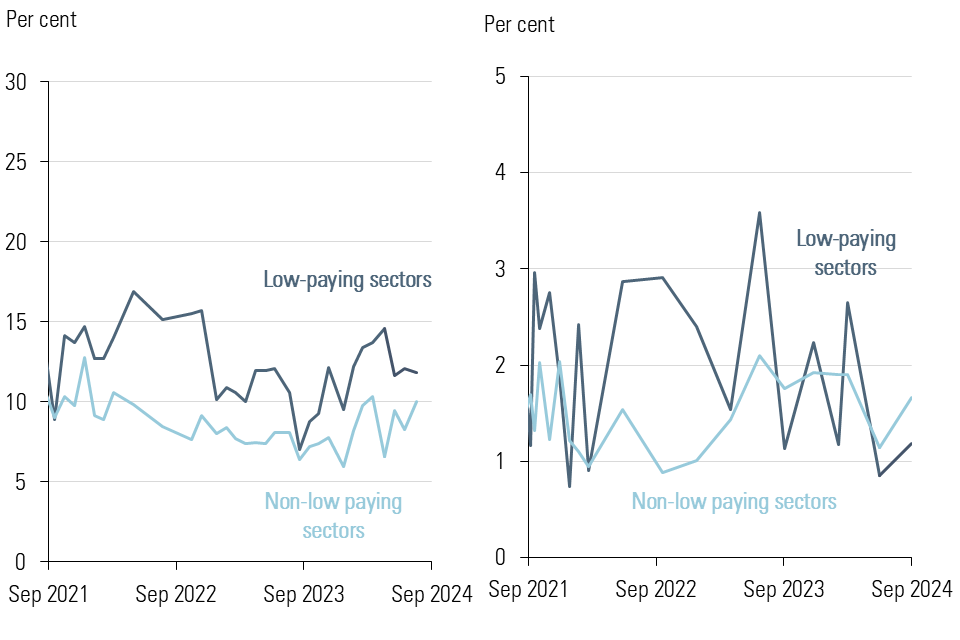
Despite an improving economic picture, small employers and those in low-paying sectors are finding business conditions mixed across a range of metrics. They continue to be more worried about their cash reserves than firms in non-low paying sectors although there has been no significant change in the last year.
After reductions in 2023, the last 12 months saw a slight pick-up in the share of low-paying sector firms with low confidence in meeting their debt obligations, widening the gap compared to non-low paying sector firms. They are also more likely to be concerned over insolvency risks, although in both cases a minority of firms are affected.
On a positive note, falling inflation has resulted in reductions in the share of firms facing higher input prices. Concerns over worker shortages have also reduced as recruitment difficulties ease compared with a year ago. And, overall, we continue to see a very low proportion of firms stating they are expecting to make redundancies.
11.1 Proportion of firms with less than one month’s cash reserves (left-hand side) and Proportion of firms with low or no confidence in meeting current debt obligations (right-hand side)
11.2 Proportion of firms with moderate or severe risk of insolvency (left-hand side) and Proportion of firms expecting to make redundancies in next 3 months (right-hand side)
12. The labour market has loosened, but demand is similar to 2019, when the labour market was tight
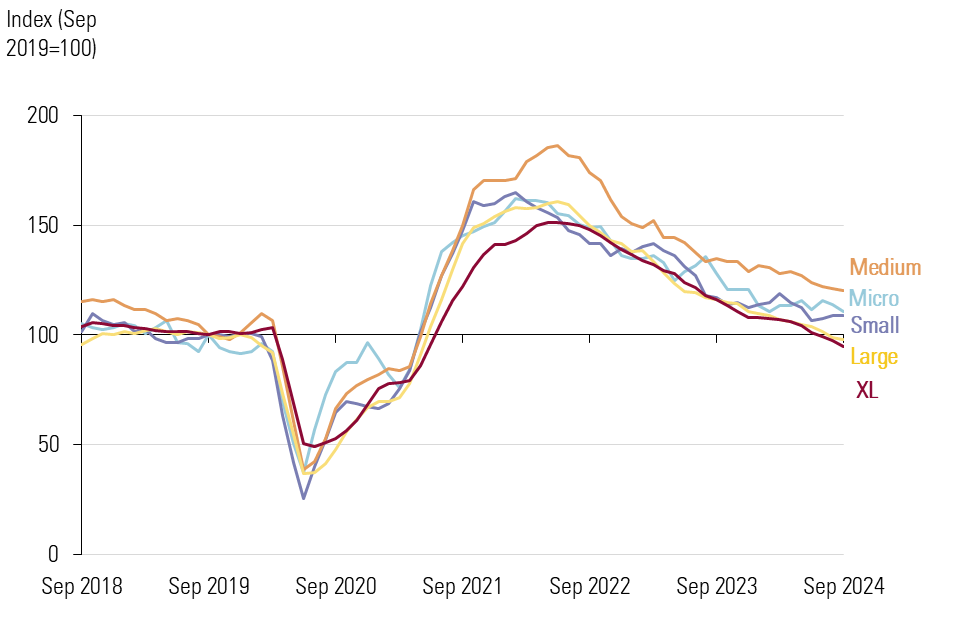
Employment growth slowed in 2024, with demand for labour also continuing to ease. The growth in employees measured by HMRC’s Real Time Information (RTI) slowed to below 1 per cent, lower still for low-paying sectors. Total vacancies have fallen month-on-month from their peak of 1.3m in 2022 to 841,000 in September 2024.
Vacancies overall and in larger employers are back to 2019 pre-pandemic levels, though this itself was a period of tight labour markets. Small and micro firms’ vacancies remain above 2019 levels.
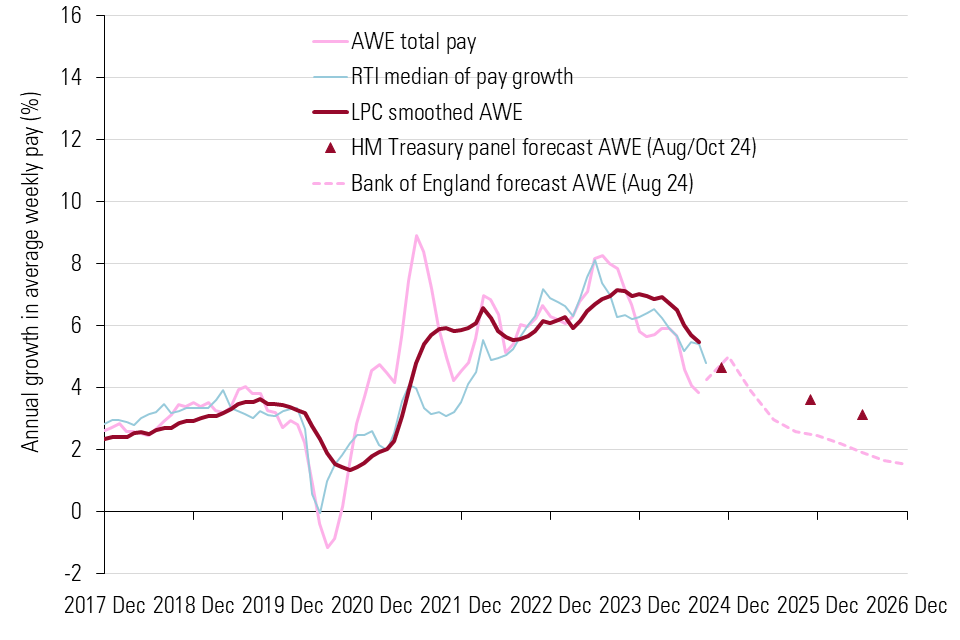
Reflecting this strength in demand, wage growth remained robust over the past year, coming in ahead of forecasts even as it has slowed in line with cooling demand. Pay forecasters expect this to continue in 2025 to around 3.5 per cent.
Pay settlements have also weakened but remain much higher than pre-pandemic. Median pay awards have slowed from 5 per cent or more in 2023 to 4 per cent by September 2024. They are expected to slow further with median awards forecast around 3-4 per cent in 2025 with very few awards above 5 per cent.
This means pay settlement expectations and pay growth forecasts are closely aligned next year at 3-4 per cent. With inflation forecast to be around 2-3 per cent, that should mean real wage increases next year.
The labour market next year is expected to remain robust albeit softening. This leads to expectations that unemployment will rise slightly but stay low by historic standards.
12.1 Vacancies by employer size, 2018-2024
12.2 Actual and forecast pay growth, 2017-2026
13. The low-paid labour market loosened but remains robust
As with the labour market overall, the low-paid labour market has begun to loosen but remains robust.
The left-hand chart below shows the earnings of workers who were on the minimum wage in the previous year. The dark blue bars show the share remaining on the wage floor. Before the pandemic, this was consistently around 60 per cent, with the other 40 per cent moving into higher pay. In recent years, the tight labour market and high demand meant more workers were escaping the wage floor. While this share fell in 2024, it was still higher than in 2019.
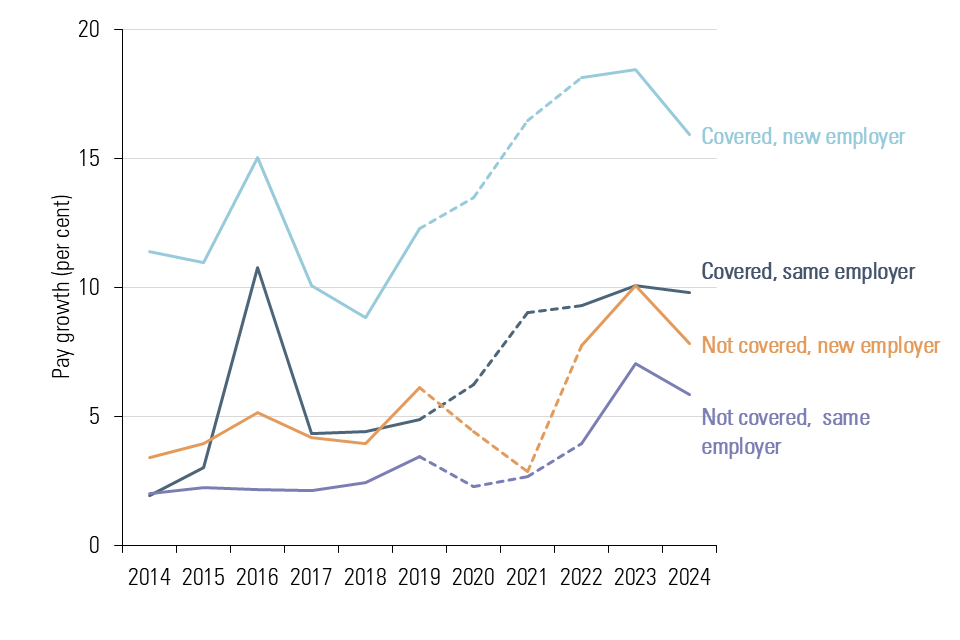
Reflecting this, the middle chart shows that median pay growth for minimum wage workers who moved to a new employer (light blue line) fell slightly in 2024 but remained high by historic standards.
The right-hand chart puts local authorities into five groupings according to NLW coverage and shows how the level of employment has changed for each. Areas with the highest share of jobs paying the NLW are in category 5, the yellow line. These areas saw employment grow the most over the pandemic recovery, although all areas have seen a slight fall back in recent months.
Overall, the low-paid labour market has loosened over the last year or so, but it did so from a position of strength.
13.1 Pay of workers who were on the minimum wage the year prior, 2014 to 2024

13.2 Median pay growth by previous coverage status and whether worker changed employer, 2014 to 2024
13.3 Growth in payroll employees by LA coverage quintiles, RTI data, 16+ (March 2020=100), 2019 to 2024

14. The share of jobs paying the NLW increased for the first time since 2016
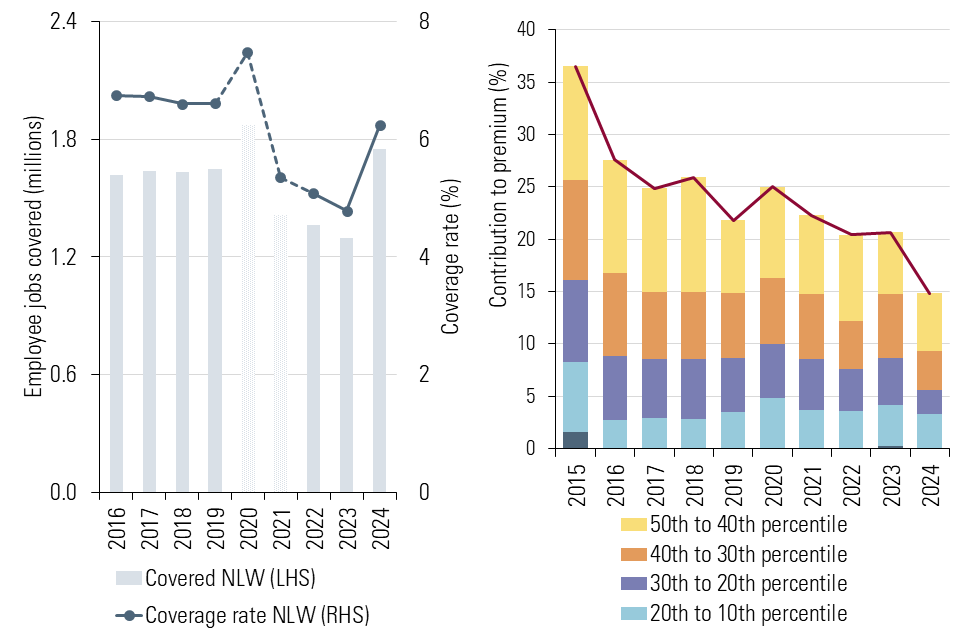
The coverage rate indicates the share of jobs paid up to 5 pence above the NLW. Following the pandemic, NLW coverage fell for several years. This trend reversed in 2024 with coverage increasing by around 450,000 to 1.75 million jobs. While some of this increase was due to 21-22 year-olds becoming eligible for the NLW, most of the increase came from those aged 23 and over, where coverage increased by 307,000 (23 per cent) to 1.6m workers.
This is the largest increase since the NLW was introduced in 2016, and on the face of things suggests a loosening of the low-paid labour market. However, the coverage rate remains lower than before the pandemic (and was difficult to measure during it).
There is evidence of increasing wage compression above the NLW, with the share of jobs paid within £1 of the rate returning to pre-pandemic levels, of around 18-19 per cent.
The NLW’s effects on differentials and pay compression continue to be a major concern among employers and some workers. The policy of increasing the NLW towards a target based on median wages inevitably produces compression in the lower-half of the distribution, and we see this effect in the data across all low-paying industries.
In 2024, after remaining relatively steady in recent years, the premium of the median wage above the NLW in low-paying industries fell by 5.8 percentage points in relative terms and 45 pence in absolute terms. This pay compression was mainly seen between the 20th and 40th percentiles, where the gap fell from £1.11 to £0.69.
Employers tell us the effects of narrowing differentials include discontent among workers paid above the NLW and reduced rates of progression. Where the premium for taking on extra responsibility is low, it becomes harder to recruit individuals into those roles.
14.1 Number and share of jobs covered by the NLW, eligible population, UK 2016-2024 and Premium of 50th percentile wage over NLW with contributions, low-paying industries, 2015-2024
15. 21-22 year-olds became eligible for the NLW for the first time
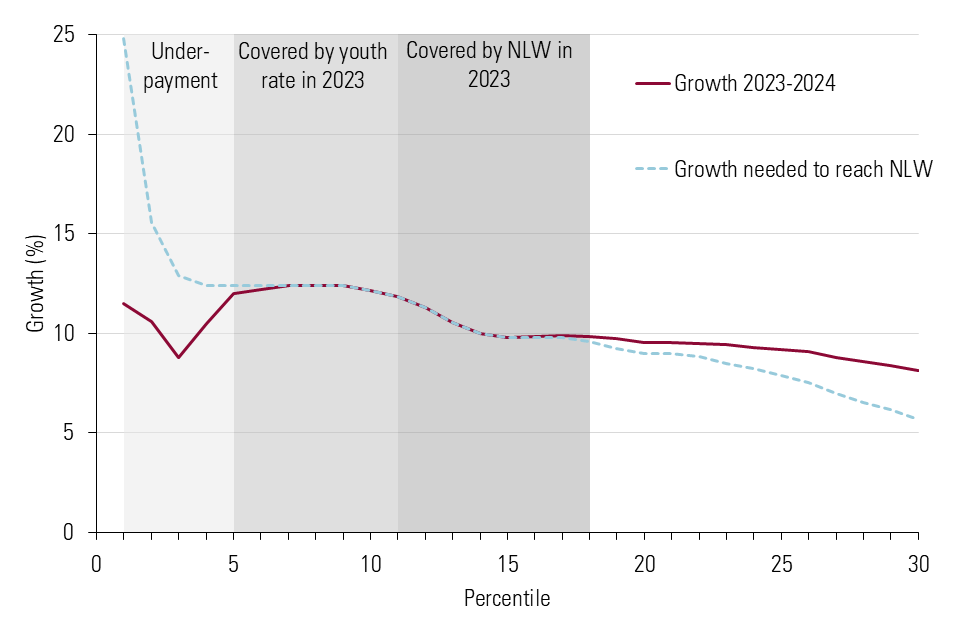
In April 2024, 21 and 22 year olds became eligible for the NLW, increasing their minimum wage from £10.18 to £11.44 (12.4 per cent). This large increase supported strong wage growth at the lower end of their hourly pay distribution. Median pay for the age group grew more quickly than for the general population, increasing by 7.5 per cent to £12.45 (against 6.9 per cent for the population as a whole). Consequently, the bite (the ratio of the minimum wage to the median wage) for 21-22 year olds rose from 90 to 92 per cent.
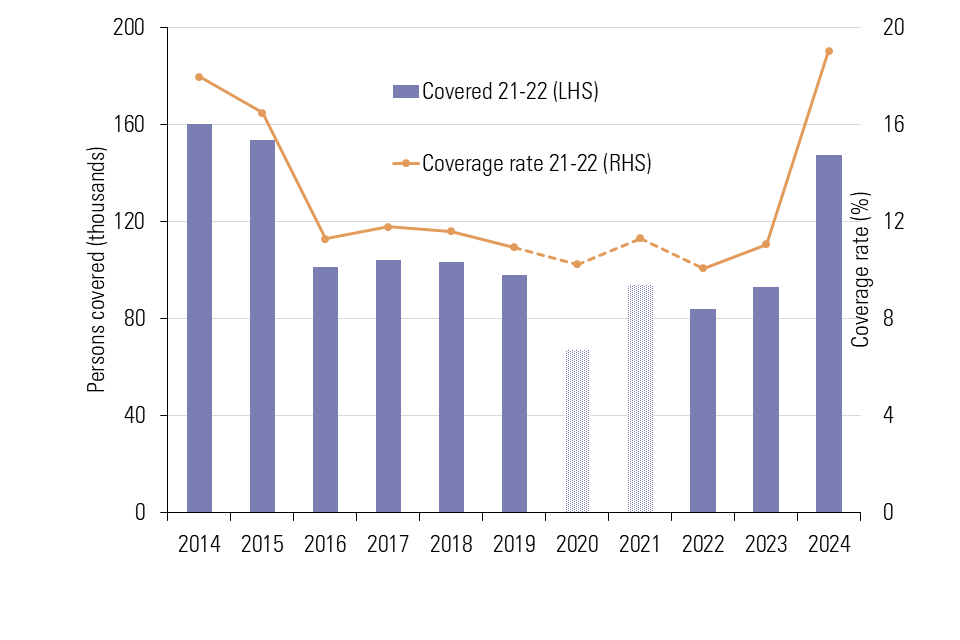
Outside of cases of underpayment for the lowest paid, 21-22 year olds who were previously paid at or below the NLW received pay increases that brought them up to the NLW and no further. As a result, the coverage rate increased from 11 to 19 per cent (54,000 more workers). This increase was expected – in 2023 a similar share of 21-22 year olds would have been considered covered by the NLW.
It is too soon for the LPC to evaluate the full impact, including on employment and hours worked, of bringing 21-22 year olds into the NLW. As more data becomes available, the LPC will conduct an in-depth evaluation. However, initial analysis of the impacts to date suggests little cause for concern.
15.1 Hourly pay growth by percentile, 21-22 year olds, 2024
15.2 Number and share of jobs covered by the NMW/NLW, 21-22 year olds, UK 2016-2024
16. Employers continue to absorb the costs of NLW increases or pass them on through prices
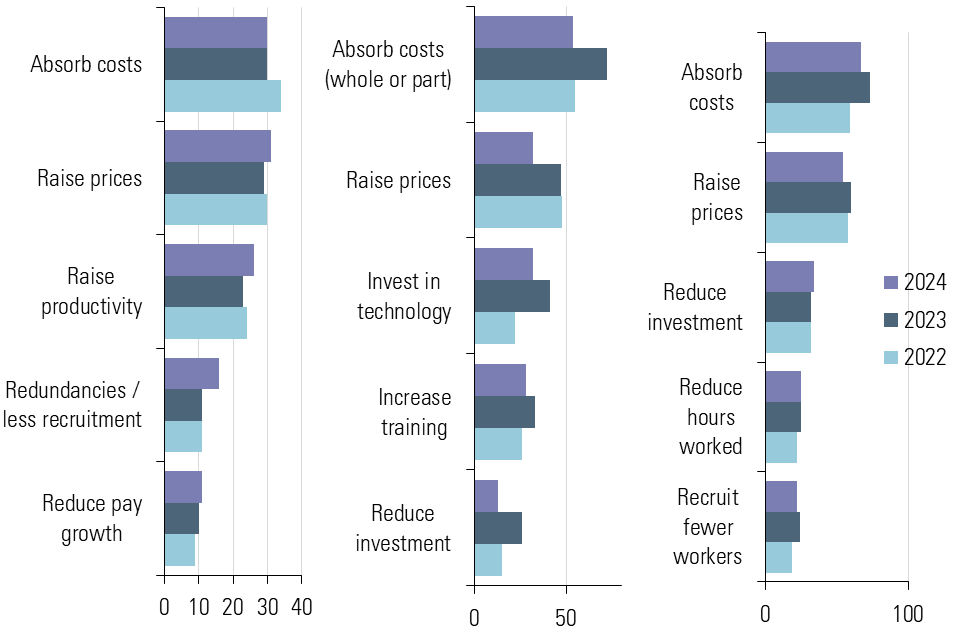
Evidence from surveys of employers suggests that the most common ways to adapt to the rising NLW are either by absorbing the cost in profits or by passing it through in prices. In surveys by the Chartered Institute of Personnel and Development (CIPD), the Confederation of British Industry (CBI) and the Federation of Small Businesses (FSB), these remain the leading responses. In the latter two sources, the frequency of price pass-through fell in 2024 – some employers told us they had either reached a limit in what they could pass through, especially inflation reduced more broadly.
The CIPD’s survey showed an upturn in the share of employers affected by the NLW saying they had either made redundancies or reduced recruitment. But the share saying this remains relatively small and there is little sign of growing redundancies in the official data.
Survey responses also reveal tensions around productivity and investment. Small firms in particular report cutting investment to sustain their operations – which may in the long term be counterproductive for their ability to afford future minimum wage increases.
16.1 Surveyed responses to NLW increases, CIPD (left-hand side), CBI (centre), FSB (right-hand side)
17. Hourly pay growth remains strong for young workers, but employment has softened
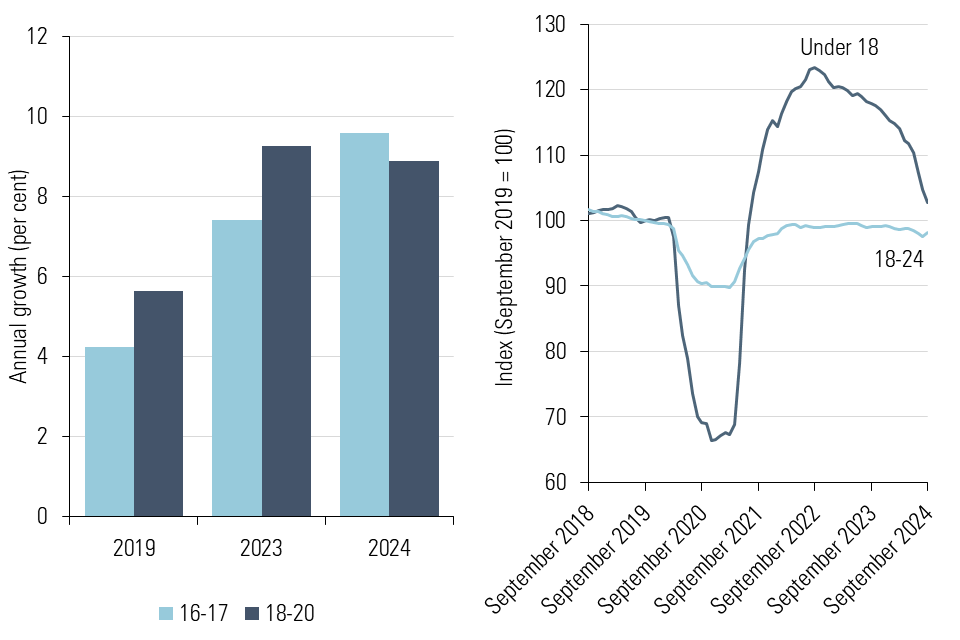
Young workers have continued to see robust growth in their median hourly pay into 2024. However, youth employment has weakened over the past year.
In our publications last year, we noted our concerns about the Labour Force Survey (LFS), which is a key measure of youth employment. While the response rate has begun to improve, the issue remains particularly acute for low-paid and younger workers. When combined with HMRC RTI data, the employment picture for young people appears to be softening, but by less than the LFS suggests. All of this is consistent with weakening, but still healthy, demand for young workers. This, along with robust hourly pay growth, led us to recommend significant increases to the minimum wage rates for 16-17 year olds and 18-20 year olds.
17.1 Growth in median hourly wages of young workers, 2019, 2023 and 2024 (left-hand side) and RTI employment level index by age (September 2019 =100), 2018-2024 (right-hand side)
18. Large rate rises have slightly increased the use of youth rates
18-20 year olds
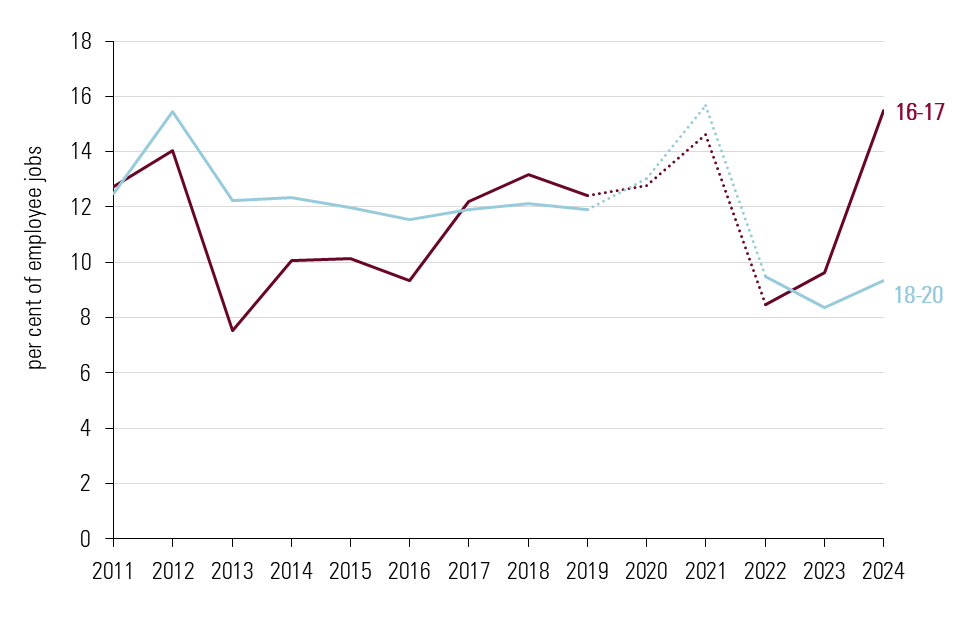
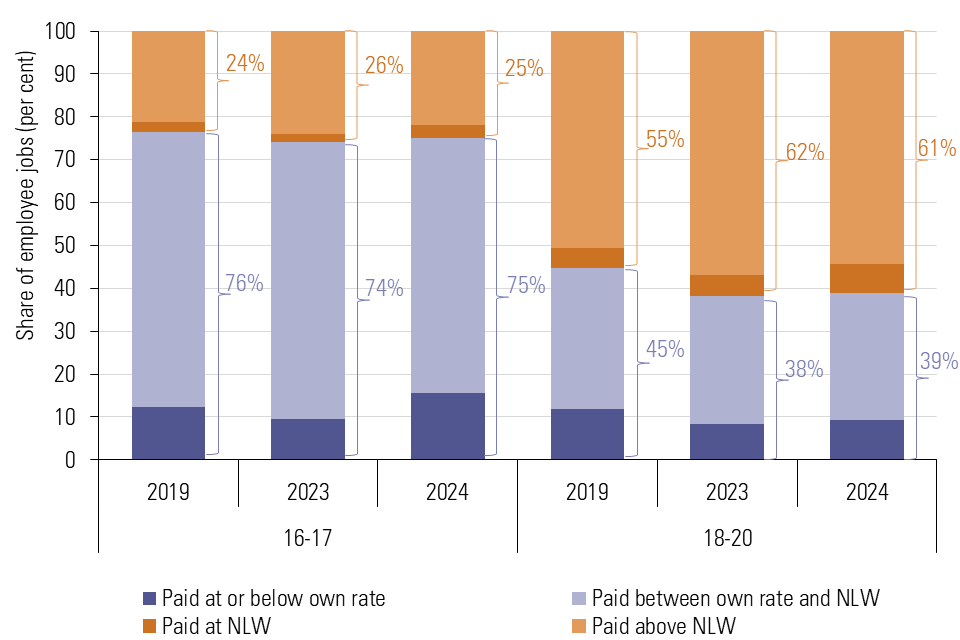
In April 2024, 18-20 year olds saw their minimum wage increase from £7.49 to £8.60 (14.8 per cent). With such a large increase we would expect coverage (the share of jobs paid within 5 pence of the rate) to increase in tandem, but it only increased very slightly from 8 to 9 per cent. Effective coverage – all those paid below the NLW – also only increased by a percentage point from 38 to 39 per cent. This remains below pre-pandemic levels of effective coverage. As median hourly wages have grown significantly for these workers, the large increase in their wage floor has only returned the bite (the ratio of the minimum wage to the median wage) to 74 per cent, which is below historic levels.
16-17 year olds
In April 2024, 16-17 year olds saw their minimum wage increase from £5.28 to £6.40 (21.2 per cent). Following this large rate increase, coverage rates for this group rose to their highest ever level at 16 per cent. However, effective coverage only increased by a percentage point from 74 to 75 per cent. As hourly pay has been growing strongly for 16-17 year olds, the bite of the 16-17 Year Old Rate only returned to its pre-pandemic level (72 per cent of the median wage).
18.1 Coverage of the minimum wage by youth rate population, 2011-2024
18.2 Effective coverage of age-related minimum wages and NLW by age rate, 2019, 2023 and 2024
19. Large increases to youth rates will narrow the gap with the adult rate
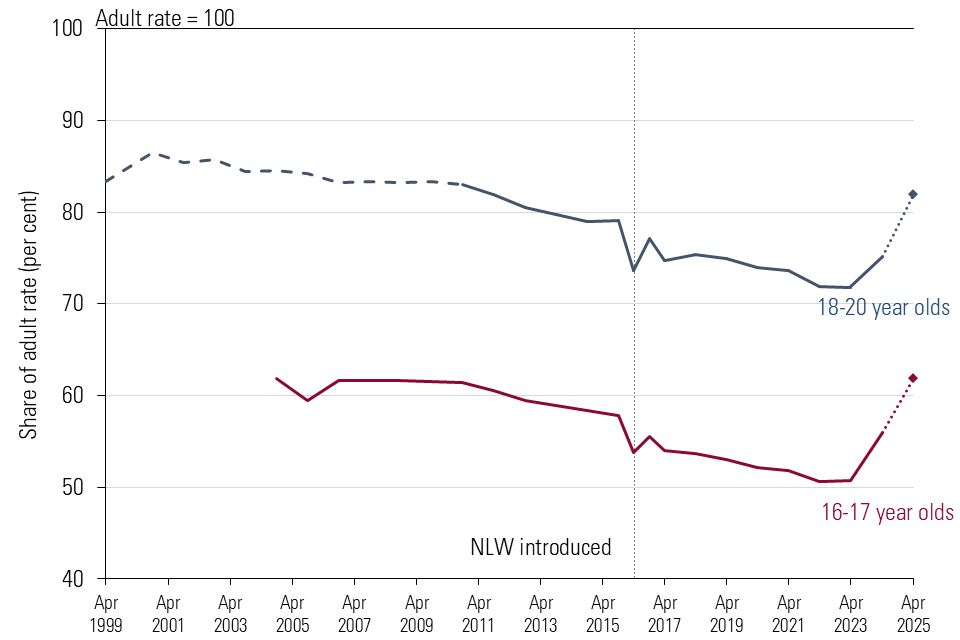
Until April 2024, the gap between adult and youth minimum wages had been widening in both percentage and cash terms. Several stakeholders – some employers as well as unions and youth groups – argued that this gap had become too large.
We began to reduce this gap in April and the Government has told us to “continue to narrow the gap” between the 18-20 Year Old Rate and the NLW this year. In making this change, we are asked to take account of the effects on employment of younger workers, incentives for them to remain in training or education and the wider economy. Our remit for 16 and 17 year olds is to push the wage as high as possible without damaging employment.
We recommend an increase that continues to narrow the gap with the NLW with a rate of £10 an hour for 18-20 year olds (an increase of £1.40 or 16.3 per cent). For 16-17 year olds, we recommend a rate of £7.55 (an increase of £1.15 or 18 per cent). This returns the 16-17 Year Old Rate to its relative value compared to the adult rate when it was first introduced (just under 62 per cent of the adult rate).
The Government wants “every adult worker” to benefit from a “genuine living wage” and to lower the NLW age threshold to 18 years of age. We will consult next year on the appropriate pace and approach to achieving this outcome. We will also continue to consult on the appropriate gap between the 16-17 Year Old Rate and the NLW.
19.1 Youth rates as a proportion of the adult rate
20. We recommended keeping the Apprentice Rate aligned with the 16-17 Year Old Rate
Last year, we looked in depth at the case for removing the Apprentice Rate. The position of which is affected by the other youth rates and our advice to the Government noted changes needed to be considered in the round.
The Government has announced it will replace the Apprenticeship Levy with a new growth and skills levy, and review what training employers can fund using this. Any reforms will have implications for the Apprentice Rate, and we will study the detail carefully.
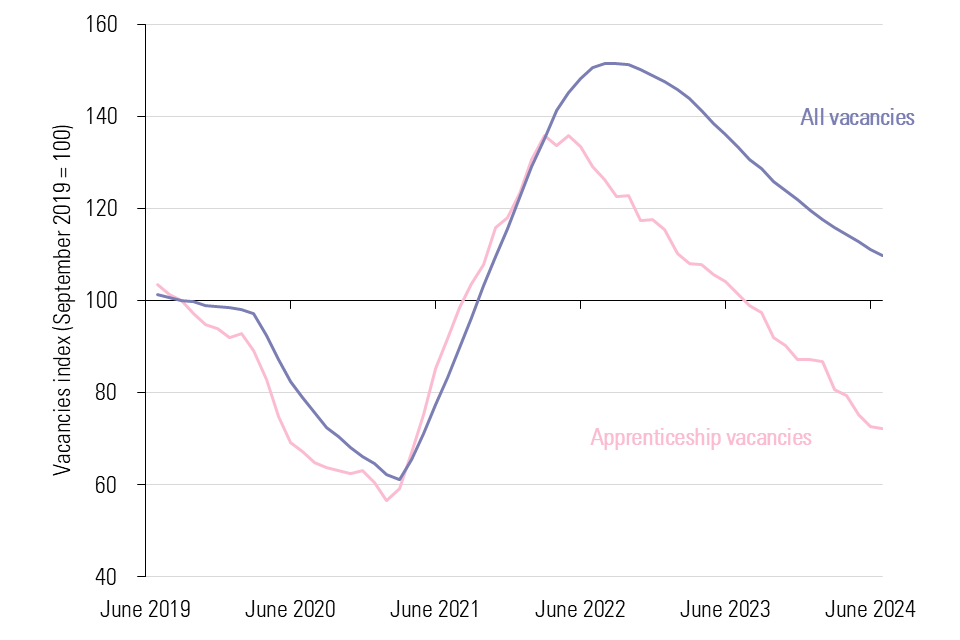
The majority of apprenticeship starts take place in the first quarter of the academic year, between August and October. We do not yet have data for this period – an obstacle to assessing the impact of this April’s large uprating. Using DfE data, we have seen apprenticeship vacancies decline over the past year. Compared with the broader labour market, apprentice vacancies have fallen further and are now below their 2019 level.
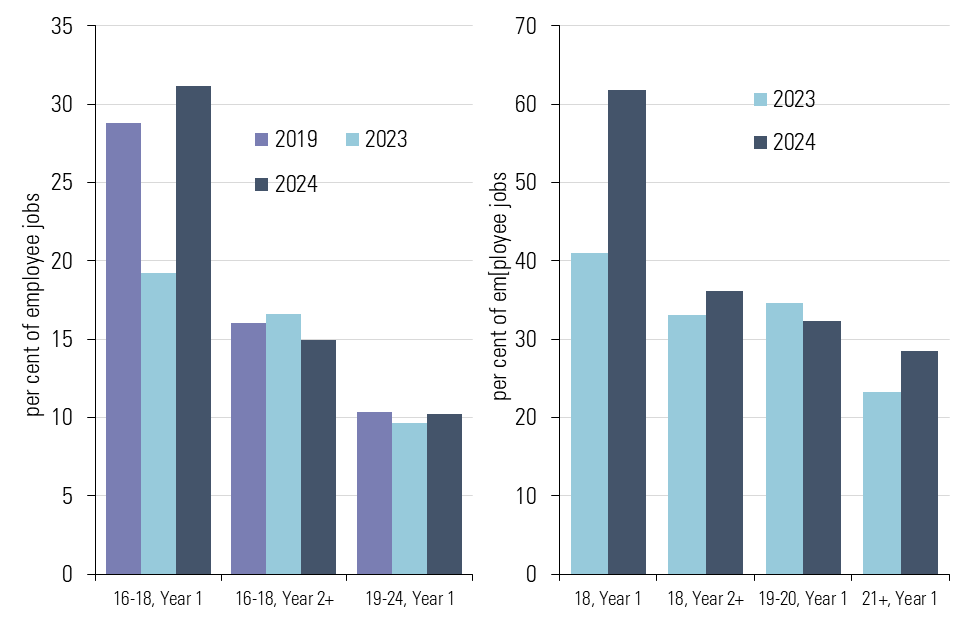
Coverage has increased for those aged under 19 in their first year, but remains stable for older apprentices. The share paid less than their NMW age rate remains significant: over 60 per cent of 18 year olds in their first year are paid below the 18-20 Year Old Rate.
Given all of this, we recommended keeping the Apprentice Rate aligned with the 16-17 Year Old Rate at £7.55.
20.1 UK job vacancies and apprenticeship vacancies in England (September 2019=100), 2019-2024
20.2 Apprentice coverage by age and year of apprenticeship, 2019, 2023 and 2024 (left-hand side) and Share of apprentices paid below their age-related rate (right-hand side)
