The Annual Report of Her Majesty’s Chief Inspector of Education, Children’s Services and Skills 2019/20
Published 1 December 2020
Applies to England
The Annual Report of Her Majesty’s Chief Inspector of Education, Children’s Services and Skills 2019/20
Presented to Parliament pursuant to section 121 of the Education and Inspections Act 2006.
Ordered by the House of Commons to be printed 1 December 2020.
© Crown copyright 2020
Clive House 70 Petty France, SW1H 9EX
1 December 2020
Rt Hon. Gavin Williamson CBE MP Secretary of State for Education Sanctuary Buildings Great Smith Street London SW1P 3BT
The Annual Report of Her Majesty’s Chief Inspector 2019/20
I have pleasure in presenting my Annual Report to Parliament, as required by the Education and Inspections Act 2006.
This report addresses the full range of our inspection and regulation both in education and care.
It is underpinned by evidence from our inspections of, and visits to, schools, colleges and providers of social care, early years and further education and skills. I also draw on findings from our research, evaluation, data and analysis this year.
Our aim is to be a force for improvement across education and social care. As Chief Inspector, it is my priority to not only report on individual providers but to offer the national picture of education and care from Ofsted’s unique, independent view. This is in order, unwaveringly, to support improvement and raise standards for all children and learners in England. It has been an extraordinary year, and we have seen teachers, leaders and social workers respond admirably to the challenges they have faced. In this report, I recognise the many successes we have seen both before and since the start of the pandemic, but also direct attention to areas in which more can be done for the benefit of children and learners. I welcome the removal of the exemption from inspection for outstanding schools. In the coming years, this will allow us to even better inform parents and shine even more light on our education system.
I trust that this report will provide useful evidence to inform policies aimed at securing the very best futures for our children and learners.
Copies of this report will be placed in the Libraries of both Houses.
Yours sincerely
Amanda Spielman
Her Majesty’s Chief Inspector
HMCI commentary
This has been an extraordinary year, in which education and children’s social care, like the rest of society, have been hugely affected by the COVID-19 (coronavirus) pandemic. We have seen heroic efforts made, and I would like to thank all our teachers, social workers, childminders, leaders and everyone working in education and children’s social care for going above and beyond in the most trying circumstances, and continuing to put children and young people first.
For Ofsted, this has been a year of 2 very different halves: what we could call the ‘pre-COVID’ period from September 2019 to March 2020, and the ‘post-COVID’ period that followed. The picture also differs between our regulation and inspection activities: while routine inspection in the remits for which we are not the regulator paused from March, our regulatory work in social care and early years continued throughout the pandemic. This report reflects the divided year and our insights from each period, but also highlights the commonalities across time and remits. What has remained clear is the importance of our work for children and young people, whatever the circumstances we find ourselves in.
Inspections under the education inspection framework
Outcomes
We started inspecting under the education inspection framework (EIF) in September 2019.
Our judgements of overall effectiveness remained high and largely unchanged. The concerns of some that the new framework would lead to turbulence in inspection grade profiles have not been borne out.
In early years, the profile of overall effectiveness judgements is largely unchanged, at 96%. However, there has been a slight shift to a higher proportion of providers judged good and a lower proportion judged outstanding since August 2019, reflecting that outstanding is a challenging and exacting judgement.
Nearly two-thirds of state-funded schools inspected under the EIF kept the same overall effectiveness grade as at their previous inspection. However, only 32% of the schools receiving a routine section 5 inspection (as opposed to section 8 inspections, which are not graded)[footnote 1] maintained their previous grade. Of schools whose grades changed, a similar proportion improved as declined.
Our routine section 5 inspections include key judgements as well as an overall effectiveness judgement. The quality of education key judgement is designed to be at the core of a school’s overall grade, so the same proportion of schools were awarded good or outstanding for quality of education as for overall effectiveness.
Proportions awarded good and outstanding for leadership and management were slightly higher. In the majority of cases where the grade for leadership and management was different to overall effectiveness, the school was graded good for leadership and management but requires improvement overall. Just as we saw under the previous common inspection framework (CIF), the schools that are graded higher for leadership and management than for overall effectiveness are disproportionately in deprived areas. We are continuing to highlight where schools in challenging circumstances are nevertheless being well led.
Grades were substantially higher for behaviour and attitudes and personal development compared with overall effectiveness. This shows that even where the quality of education and overall effectiveness of the school may need improvement, inspectors are able to acknowledge strong work done to ensure good behaviour and personal development.
In the alternative provision (AP) sector, 85% of state-funded pupil referral units, AP free schools and AP academies were graded good or outstanding as at 31 August 2020, compared with 86% for all schools.
The proportion of state-funded special schools judged as good or outstanding is also fairly similar to the proportion for other schools.
Inspection outcomes for non-association independent schools have improved slightly. By 31 August 2020, 77% of schools were judged good or outstanding compared with 75% at 31 August 2019. However, nearly a fifth of independent schools that Ofsted inspects are not meeting the independent school standards (ISS), which they are legally required to meet.
Failings in leadership and management were the most likely indicator for independent schools declining in their overall effectiveness.
In further education and skills (FES), the proportion of providers judged good or outstanding has not changed, remaining at 8 out of 10. The best-performing provider types were community learning and skills (CLS) providers and 16 to 19 academies (though numbers here are small).
Independent learning providers (ILPs) had the lowest proportion of good or outstanding judgements. Sixty-four per cent were graded good, and 10% outstanding. Sixty-one per cent of colleges were graded good, and 18% outstanding.
Adult learning programmes were one of the most successful provision types offered in FES providers this year, while provision for learners with high needs[footnote 2] had the highest proportion of outstanding grades at 12%. Apprenticeships were one of the least successful provision types, with too many judged inadequate (10%).
In FES, effectiveness of leadership and management and quality of education were the 2 key judgements with profiles most similar to overall effectiveness. In common with schools, in providers with overall effectiveness judgements of less than good it is not uncommon to see positive recognition in other areas, such as behaviour and attitudes and personal development. In addition, almost half of FES providers inspected in 2019/20 were receiving their first full inspection. The judgement profile of these new providers is very similar to the profile across other providers. The biggest difference (although based on small numbers of inspections) was in personal development, where 67% of new providers received a good or outstanding judgement compared with 74% of other providers. Judgements about behaviour in new providers (76%) were also slightly lower than in other providers (81%).
When we introduced the EIF, we said we would evaluate its implementation and impact. We have been evaluating implementation since September 2019 and we will be publishing the findings in early 2021. This will be based on what we have learned from the inspections we carried out from September to March 2020.
An outstanding curriculum
An important aim of the EIF is to focus inspection on what the evidence tells us makes providers most effective. The EIF therefore introduced a bigger emphasis on curriculum quality. This is something that has been much discussed in the sector, particularly over the last 3 years or so, and I am pleased that Ofsted has played a leading role.
We can continue to do so by using our evidence from the first 2 terms of inspections under the EIF to highlight the elements of curriculum quality that distinguish good and outstanding providers from others. Our evidence shows the importance of a rich and well-sequenced curriculum that leads to good results, taught by well-trained and well-supported teachers and their early years counterparts. In weaker providers, we often see a focus on tests or qualifications, which can lead to narrowing of the curriculum.
To inspect the curriculum, we carry out ‘deep dives’ into subject areas. So far, we have made over 11,000 deep dives in different subjects in state-funded schools. We will do research on individual subjects, and will publish subject reviews for all 14 national curriculum subjects over the next 2 years. In the meantime, we have looked at the evidence from a sample of existing deep dives as well as our inspection reports to draw some conclusions about the strengths and weaknesses of curriculums in general.
Mainstream curriculums
In state-funded schools, our analysis shows that the curriculum in outstanding schools tends to be:
- rich – pupils get a wide range of knowledge and experiences
- well planned and coherent – the school has a top-level approach to curriculum planning, which informs and supports the development of individual subject curriculums
- well sequenced – the curriculum is planned in such a way that ideas build over time. In primary, that means that it starts from early reading and phonics and continues through the whole school. In secondary, that means that key stage 3 is a solid foundation for GCSE study
- comprehensive – every element of what pupils are taught (including personal development and behaviour) is part of a well-planned curriculum
In our research, we found that these different elements of curriculum design were strongly related to each other. They are underpinned by an understanding that progress happens through learning the curriculum, rather than being a function of testing and assessment, and that assessment is not an aim in itself, but is linked to the curriculum progression model. A strong curriculum is underpinned by clear central aims and accountability, but also recognises that individual subjects require different approaches to sequencing and assessing content, and therefore avoids a one-size-fits-all approach.[footnote 3]
The best possible curriculum will still fail if not taught well. A common characteristic of outstanding schools is that they have really well-trained and experienced teachers who have strong subject and pedagogical knowledge, and who feel valued by senior leaders. The lessons they deliver build on prior learning and are underpinned by formative assessment in order to discover and address misconceptions and adapt lessons as they go.
Subject knowledge among teachers is critical. Our research found this is more of a challenge in primary schools, where teachers have to teach across the curriculum, but also in some secondaries when teachers have to teach out of subject because of staff shortages. In schools that scored highly on curriculum quality in our research, leaders made sure teachers received high-quality professional development to develop subject knowledge in their own subject.
In the outstanding schools seen this year, pupils know more and remember more, and this is reflected in their attainment. There continues to be a strong correlation between inspection outcomes and Progress 8 scores, though this has never been as high as is commonly assumed.
Outstanding secondary schools inspected under EIF had an average Progress 8 score of 0.6, good schools an average score of 0, schools judged as requires improvement a score of -0.4, and inadequate schools a score of -0.7. These averages are very similar to what we found under the CIF in 2018/19. We can see the same pattern in primary schools, where outstanding schools have an average reading, writing and mathematics score of 82, good schools 65, schools judged as requires improvement 54 and inadequate schools 48. This is again similar to what we found last year under the CIF, and demonstrates that a strong curriculum leads to strong outcomes.
Primary schools judged as requires improvement sometimes focused extensively on teaching reading, writing and mathematics at the expense of other subjects in the curriculum, even for pupils who had the capability to tackle a wide range of subjects. This limits pupils’ ability to thrive in secondary school, where they will encounter a range of subjects. This effect will be especially profound for disadvantaged pupils, who are less likely to be able to draw on resources at home to fill in gaps and broaden their knowledge.
In a minority of secondary schools, our EIF inspections continued to show that not all children were receiving a full and appropriate curriculum. In some inspections, we identified and reported on one or both of the following aspects:
- Curriculum narrowing, where a disproportionate or premature emphasis on teaching exam specifications was limiting pupils’ exposure to a broad and balanced curriculum over the course of their secondary education. As we mentioned in last year’s Annual Report, we have no view on the length of key stages 3 and 4, but we do expect all pupils to have access to a full curriculum, and not spend inordinate time preparing for GCSEs. The EBacc is a useful route towards a broad and balanced curriculum at key stage 4 that keeps options open for young people.
- Curriculum misalignment, where substantial numbers of pupils were being directed or encouraged into courses (often for GCSE-equivalent qualifications) in which they were likely to earn high grades but that were unlikely to help some of them to progress in the pathways that best suited their talents and interests, and could harm them by preventing them from taking courses that would suit them better.
Specialist curriculums
When people think of the curriculum, they often think of the national curriculum. However, we also inspect providers that have a specialist curriculum or that are not required to follow the national curriculum, and offer alternatives. The same principles of good curriculum design apply.
AP schools provide education for pupils who have left mainstream school. The curriculum in AP schools often includes a blend of academic and vocational subjects. Most AP schools need to achieve a balance between investing time in helping pupils to improve their behaviour and offering a curriculum with sufficient breadth.
The most successful AP schools take time to understand pupils’ specific needs at the point of entry (from their previous school or college). Leaders then formulate a curriculum that is matched to those needs. The curriculum is often strengthened where APs collaborate with partner schools, whether within a school trust or with partners such as their local authority or with leaders from other strong settings. This joined-up work can raise aspirations and give the AP school clear benchmarks for its pupils to aspire to. This type of collaboration also offers support for staff in training and development. Subject expertise can be a problem in AP schools, and linking with partner schools can mitigate this.
In state-funded special schools, we similarly find that the most effective schools have an ambitious curriculum that prepares pupils well for the future. The best special schools attend to both content and sequencing of the curriculum in all subjects. The best primary special schools systematically build pupils’ knowledge of phonics and promote a love of reading. Special schools judged less than good and those that are declining show weaknesses in both.
FES provision offers specialist curriculums based on the knowledge and skills needed for particular vocational routes, as well as often offering A levels. Given their highly specialised nature, we have found that FES providers have sometimes thought more deeply and for longer about curriculum sequencing and content than schools.
In most FES providers, the curriculum is carefully sequenced and builds on learners’ existing knowledge and skills. Large providers, such as general further education colleges, sixth-form colleges and some ILPs, tend to provide a well-considered curriculum with clear progression routes through levels to employment. Smaller providers and local authority providers often plan their curriculum offer to meet the needs of specific groups of learners, specific industries, and/or their local communities.
However, providers judged less than good often do not have a sufficiently ambitious curriculum for their learners and apprentices. The emphasis tends to be on achieving qualifications and the curriculum does not prepare learners and apprentices to gain the wider knowledge and skills required for work or their next steps. In outstanding providers, learners consistently achieve valuable qualifications, but do so through a rich and sequenced curriculum.
Overall, provision in FES is weakest in apprenticeship provision, where 1 in 10 providers are judged inadequate. This is clearly too large a number. We found that apprentices who receive training through apprenticeship standards tend to experience a more tailored and broad curriculum compared with those on the legacy apprenticeship frameworks. Nearly a quarter (24%) of providers that received new provider monitoring visits this year had at least one insufficient progress judgement. In many cases, this was down to weak leadership and a lack of co-development of the curriculum with employers.
We introduced the EIF in prison inspections in February 2020, and have made 4 prison inspections so far. The key issues affecting education in prisons are poor management of quality in education, skills and work and slow progress with improving the provision since the previous inspection. Only a third of prisons inspected since September 2019 deliver an appropriate curriculum to meet the needs of their prisoners. In many cases, the number of activity spaces available in education, skills and work is insufficient for the number of prisoners, or spaces are poorly allocated and used. Prisoners with additional learning needs receive insufficient support and the range of education, skills and work activities that vulnerable prisoners can access is poor.
Overall, these early findings from EIF inspections are encouraging. In the vast majority of schools, early years providers and FES providers, curriculums are well developed, thought through and implemented. Providers offering specialist curriculums can be more variable, sometimes either matching their offer well to the needs of learners or failing to have expert staff teaching well-considered plans.
As mentioned above, over the coming year, we will be looking more closely at individual subject curriculums in schools, and we will be doing in-depth subject reviews once we return to EIF inspections. The aim of these reviews is in part to provide information that can help subject leaders to further develop their subject curriculum. We will publish these over the next 2 to 3 years. In this report, however, we are able to comment in depth on early reading in the light of EIF evidence already gathered.
Early reading – the first priority
If we want to ensure that our children flourish, we need to help them make the best possible start. It should be the first priority of every primary school to make every child a proficient reader. Reading is not only the key to the curriculum and an essential life skill, it is also a protective factor: poor reading leads to later low attainment across subjects and to poor behaviour and self-control.[footnote 4] Phonics and early reading are the foundation for later success.
Fortunately, how to make sure children are proficient readers is one of the best evidenced areas in education. The ‘simple view of reading’, which finds that reading comprehension is a function of decoding skills and understanding of words’ meanings, has extensive scientific grounding.[footnote 5] We also have a very strong body of knowledge on how to teach the crucial decoding skills, using systematic synthetic phonics instruction.[footnote 6] This is why our inspections prioritise both the teaching of decoding skills and language comprehension in Reception and key stage 1. It has also been a theme of our work in the last few years, through Annual Reports and research.[footnote 7]
We have not been alone in our efforts. Many educators and researchers have been pushing at this door for a long time, and government has put in place a range of useful initiatives over the past 10 years: the introduction of the phonics screening check in 2012; the requirement to develop pupils’ phonics knowledge in the key stage 1 national curriculum; and the £43 million investment in primary English hubs to build a network of excellent phonics teaching in every region. There was an improvement in our ranking on reading in the international PISA tests between 2015 and 2018. England now outperforms the OECD average by 18 score points.[footnote 8]
It is therefore pleasing and unsurprising to see that leaders are increasingly prioritising early reading. Most schools we inspected this year, including those judged to be good or outstanding, had recently reviewed their curriculum for early reading. Some schools are taking specific action to improve early reading, for example by identifying the need for a phonics or reading lead who leads and/or teaches in either early years or key stage 1. In early years and key stages 1 and 2, there is growing attention to how regularly adults read to children, immersing them in a range of stories, rhymes, poems and non-fiction. Leaders rightly recognise that this will develop pupils’ language comprehension and instil an interest in reading for both purpose and pleasure.
Schools are also placing greater emphasis on the teaching of phonics. Phonics is frequently being taught from the start of Reception. Many schools have either introduced a new approach to the teaching of phonics or have made changes to improve the consistency of phonics teaching. Many have recently purchased sets of new books that are decodable.
However, it is extremely important that reading books closely match pupils’ phonics knowledge. Schools should be using a structured phonics programme that has decodable reading books in a sequence that carefully matches the letter–sound correspondences that children have learned. Otherwise, pupils will be expected to guess words for which they have not learned the letter–sound correspondence and will miss out on opportunities to practise their decoding skills. This guessing game can be very dispiriting for young children, particularly those at the lower attaining end or with special educational needs and/or disabilities (SEND), and in fact can put them off reading altogether.
In outstanding schools, leaders instil a sense of urgency in teaching the lowest attaining 20% of pupils to read, at both key stages 1 and 2. They do not settle for phonics screening check results that are in line with the national average or explain pupils’ poor progress by their background. In outstanding schools, books match sounds. This means that children build confidence and fluency from the very beginning of learning to read. Teachers read books aloud to pupils who cannot yet read them and they do not expect struggling readers to read books that include words they cannot read. The teaching of phonics is rigorous and is done by staff who have been trained to use the method well, which ensures that they choose appropriate activities so that pupils get lots of practice and keep up with the expected pace of the programme.
The phonics/reading leader in a school has to have expertise and experience in teaching phonics and be given dedicated time to fulfil their role. But all staff need a thorough understanding of the school’s chosen phonics programme. Well-trained staff can spot any child who has not secured the intended learning and provide extra support so that these pupils get additional practice in the specific aspects of phonics they are struggling with.

Of course, phonics just unlocks the code to becoming a reader. In the outstanding schools we have seen this year, once children are reading accurately and confidently, teachers use their deep knowledge of children’s literature to guide children’s independent reading choices. This heightens children’s enthusiasm for reading and starts to instil the love of reading we want to see in all schools.
However, this is not the case everywhere. There is still work to do to ensure that all children get the teaching they need to become proficient readers. Phonics programmes are not being implemented consistently well in all schools. Where schools use a phonics programme that is not supported by resources, including books and sufficient guidance for staff, this often leads to greater inconsistency and a lack of rigour in the teaching of phonics. These schools also find it more difficult to make sure that books are well matched to pupils’ phonics knowledge and that staff gain sufficient expertise in the teaching of phonics. Lower-attaining readers are not always receiving the right type or amount of support to help them catch up quickly. There are too many ‘lost’ readers in key stage 2 who are suffering from a legacy of poor phonics teaching. This is particularly noticeable in Years 2, 3 and 4 when struggling readers have often fallen further and further behind their peers. These pupils’ progress is hindered by limited practice or practice not being related precisely to the gaps in their learning. In turn, this means that not only do they then struggle with reading, but they consequently also have difficulty accessing the full range of curriculum subjects in key stage 2 and beyond.
In early years, teachers in the most successful schools and school nurseries put talking at the heart of their curriculum. They help children talk about what they are doing and learning throughout the day, in each area of learning. Early reading itself is built on a foundation of language and communication.
Our inspection evidence shows that providers in the registered early years sector recognise the importance of the curriculum for communication and language so children have the skills they need for the future. Outstanding providers are exceptionally skilful in developing children’s communication and language, for example through skilful questioning and animated storytelling.
Our new initial teacher education (ITE) inspection framework aims to reinforce our focus on phonics and address the remaining issues in phonics teaching, by ensuring that all inspections of primary and early years ITE include a focused review of early reading and phonics.[footnote 9] The framework requires that for primary provision to be rated good, training has to ensure that trainees learn to teach early reading using systematic synthetic phonics, and that trainees are not taught to teach competing approaches to early reading. Trainees should be taught the importance of providing pupils with enough structured practice to secure fluency in both reading and numeracy work.
Improving ‘stuck’ schools
Over the past few years, we have highlighted the plight of ‘stuck schools’. These are schools that have not had a rating of good or outstanding for 13 years, going back to 2007.
Before we introduced the EIF, there were 415 stuck schools. This year, we have looked at how many of those remain stuck, what our inspection evidence suggests about their characteristics and what it suggests about those that have become ‘unstuck’.
Under the EIF, just under half of stuck schools that were inspected improved to good. This supports the conclusions of our January 2020 research report ‘Fight or flight? How “stuck” schools are overcoming isolation’,[footnote 10] which concluded that no school should be written off, and that every school could improve to good if leaders concentrated on improving a small number of key things, starting with behaviour and high standards of teaching and learning. ‘Unstuck’ schools had also typically benefited from strong support from a multi-academy trust (MAT).
So far, 27% of the 415 original stuck schools have been inspected under the EIF (110 schools). Fifty-three schools had improved to good at their most recent inspection and 57 had not. Fourteen of the 23 inadequate schools moved up to a judgement of requires improvement this year, but are still ‘stuck’ as they are not yet good.
A number of factors distinguished schools that had improved, as shown in Table 1. It is no surprise that the schools that improved did so through planning an ambitious curriculum for all, focusing on phonics in primary schools and supporting staff to be experts in their subjects. All schools have the capacity to improve, but those that have struggled for a while should focus on getting basic processes around curriculum, behaviour and quality of teaching right.
Table 1: Characteristics of stuck and unstuck schools
| Schools that improved | Schools that did not improve |
|---|---|
| The curriculum is well planned and ambitious. Any variation between subjects is outweighed by leaders’ work to secure high-quality learning in most curriculum areas. | Curriculum planning is recent or incomplete. Some subjects are not taught in sufficient depth. Some staff lack the expertise to deliver the curriculum well. |
| There is strong provision for phonics and reading. In both primary and secondary schools, this includes effective support for pupils who have fallen behind. | There are issues in reading and phonics, particularly for the weakest readers. In some schools, staff expertise is a barrier. |
| There is high-quality, ambitious provision for pupils with SEND. Pupils’ needs are understood and met. | There are weaknesses in the provision for pupils with SEND. Too little focus is given to supporting these pupils to achieve academically. |
| There are high expectations for behaviour and attendance. Effective extra help is given to pupils who need it. | Disruptions to learning and poor attendance remain barriers. |
| Leaders place importance on developing personal, social and spiritual well-being. There is a broadening of pupils’ skills and perspective. Opportunities benefit all pupils. | Many pupils do not take up extra-curricular activities. Aspects of the personal, social, health and economic (PSHE) or spiritual, moral, social and cultural (SMSC) curriculum are new or are not implemented effectively. |
| There are effective challenge and support from governors. There is a shared and ambitious vision. | Governors need training so that they can hold leaders better to account. At times, a more effective interface is needed between governors and trustees. |
| There is a clarity of direction. Leaders have an accurate understanding of the school’s strengths and weaknesses. | There is an absence of accurate self-evaluation. There is not compelling evidence that plans are implemented as intended. |
| Staff feel supported to develop their subject knowledge through high-quality and motivational professional development. | There is often instability in staffing and higher-than- average staff absence. There are inconsistencies in the quality of support and training staff receive. |
Protecting vulnerable children
Helping protect vulnerable children and young people is one of the most important parts of our work. Vulnerable children are those whose needs are such that they require additional services from their local authority, such as children needing help and protection, those under the care of the local authority and those with an education, health and care plan (EHCP). We focus on this group of children through our inspection and regulation of social care providers, inspection of local authorities, regulation of early years providers and inspection of SEND arrangements. In addition, our education inspections emphasise the importance of high-quality provision for children and young people with SEND.
I will come on to the impact that disruption caused by COVID-19 has had on these children in the final section of this commentary. But there are also continuing systemic issues around our collective oversight of these children, partnership working in their interests and the capacity of the ‘market’ to deliver what they need.
Oversight and accountability
Our inspections of children’s homes, under the social care common inspection framework (SCCIF), show that the vast majority of homes (80%) are currently good or outstanding. In instances where we have required children’s homes to act and improve, this is most commonly to address weak leadership and management, and to improve the safety and protection of children.
There has been a significant rise in the number of requirements we have made in leadership and management. We see homes without strong leadership that make poor decisions for children and staff, who are also unsupported. Two-thirds of the requirements include reference to the poor quality of care, particularly in relation to the impact on children. For example, requirements have been made to ensure that managers and staff regularly review the quality of one-to-one work with children and the progress children make as a result of these interventions. Requirements have also been made in relation to managers using ideas and suggestions from children and young people to improve their care.
To improve the protection of children, we make requirements in relation to the skills of staff, their understanding of their roles in protection and their ability to take effective action. This includes requirements for staff to understand risk assessments and crucially how to manage risk to keep children safe.
The experiences and progress of care leavers are central to our inspections under the framework for inspecting local authority children’s services (ILACS). The ILACS inspections carried out before March reinforced familiar messages. In the strongest local authorities, young people had access to a good range of high-quality accommodation. Personal advisers went the extra mile to keep in touch and provide support. The views and feelings of young people are taken seriously and make a real difference to plans for their future and to wider service planning. Crucially, young people’s emotional well-being was an absolute priority. All practice was underpinned by corporate parents who had demonstrably high aspirations and ambition for their children and young people.
We were pleased to see examples of such strong practice in a rising number of local authorities, but important challenges remain, including, most commonly, the availability of suitable accommodation. In a small number of local authorities, difficulties in securing access to emergency accommodation for young people were particularly concerning.
Children with SEND are also a major focus of our work. Providing a quality education for these children is, of course, vital and we address this in a number of ways:
- In education inspections, we look at SEND provision
- In our social care inspections, we focus on the most vulnerable children, many of whom have SEND
- In ILACS, we also look more generally at provision for children and young people with SEND
- We and the Care Quality Commission (CQC) jointly scrutinise local provision in area SEND inspections
The combined evidence from these inspections clearly shows some serious weaknesses in SEND provision overall. The government’s forthcoming SEND review is an opportunity to address some of these failings.
Our area SEND inspections point to a lack of a coordinated response from education and health services in many local areas. Accountability is unclear: there is generally a lack of understanding about who is responsible for what between organisations, resulting in fractures in the way professionals in services work together. In many cases, the goal of creating a child-centred system is not being fully met. Area arrangements for identifying, assessing and meeting children and young people’s education, health and care needs are frequently slow. Too often, families are left feeling dissatisfied with their experience of area SEND arrangements because the quality of services and support fall short of what was envisaged in their children’s EHCPs.[footnote 11]
More positively, in some of the areas we re-visited, parents and carers had been given meaningful involvement in planning and decision-making. The role of the parent–carer forum featured prominently in the most successful areas, and leaders had understood that co-production meant working with families as equal partners. This is something to build on.
We also see a range of quality in SEND provision in schools, which we look at during inspections under the EIF. Good practice for these children is the same as good practice more generally, and the same important principles of curriculum design and behaviour management apply here. In outstanding schools, staff are skilled at identifying, assessing and meeting the needs of pupils with SEND, and pupils receive good support and achieve well. In schools judged as requires improvement or inadequate, our inspection reports often note low expectations, an unambitious curriculum and weaknesses in the support provided for pupils with SEND.
Some of our most vulnerable young people end up in alternative provision, as discussed above. Our inspection evidence shows that there are many good or outstanding AP providers in which pupils experience an appropriate curriculum and achieve well.
However, all too often, providers do not do enough to make sure that all pupils attend school regularly. In some cases, pupils were only in school for a fraction of the time that they should have been. This leaves them at risk of criminal exploitation as well as of educational underachievement.
Furthermore, vulnerable pupils in AP need consistency but often do not get it because of staffing turbulence. In almost half of providers, staffing instability was a significant issue, especially among leaders. In some cases, pupils do not successfully make the transition into post-16 settings. The government’s AP transition fund seeks to support AP schools with this.
Where we cannot see vulnerable children
I have talked in previous Annual Reports about unregistered and illegal provision being one of the most concerning issues in our sector at the moment. We are continuing to uncover these unsafe and unsuitable places. I have long called for legislation in these areas, but it has been slow to arrive. I must again emphasise how urgent it is for government to make this a priority.
This year, we continued our enforcement activity against unregistered schools. Since the last reporting year, our work has led to 3 further sets of convictions. One noteworthy case exemplified the risks associated with unregistered schools. Children were left unsupervised. The premises were inappropriate, with children sharing facilities with adults unconnected to the school. Children were sent home early to disguise the setting’s true hours of operation, without parents being at home. In the light of the seriousness of the concerns about the education offered and about children’s safety, the Chief Magistrate of England and Wales imposed an unprecedented custodial sentence. This helpfully reinforces the message that illegal schools face severe consequences, especially when they put children’s safety at risk.
Even when the outcome is not a prosecution, children benefit from settings addressing poor health and safety and safeguarding practices after inspectors uncover and report on them. As a result of our referrals to other agencies with enforcement powers, unregistered institutions have removed obvious fire risks, fixed filthy and dangerous premises and carried out more rigorous recruitment processes. We believe that improvements have been made in more than two-thirds of cases where we have reported such concerns.
Children also benefit from previously unregistered settings that register after our interventions. It is crucial that children receive their education in places subject to some oversight. Children are also more likely to move to registered providers when unregistered schools close following our interventions.
While we have made significant progress in tackling unregistered schools, there is no room for complacency or inaction. Thousands of children in unregistered schools are still out of reach because of weaknesses in legislation and in our investigative powers.
I particularly want to highlight the use of unregistered AP. Most secondary schools inspected last year make use of at least one AP provider, and we know that some of these providers are unregistered. Just over a third of AP settings in turn commission the services of other providers, many of which are unregistered. In these sub-contracted arrangements, there is often a lack of clarity around who is monitoring unregistered AP. It is not always plausible that the original school can do so effectively: for example, in one case a single school had sent children to 16 registered and unregistered AP providers. In another case, over half of the pupils nominally attending an AP school were actually being sent to another AP setting. Schools and local authorities need to do much better to understand which AP settings are registered.
We are pleased that government has taken steps towards resolving these issues. In particular, we fully support the proposal to close the legislative loophole that allows unregistered settings offering an extremely restricted curriculum to evade registration as a school. We also welcome the constructive engagement on equipping Ofsted with the tools to investigate suspected unregistered schools as thoroughly as possible. We urge government to ensure that this momentum is not lost, and to take meaningful further action as a priority.
We have growing concerns about unregistered children’s homes. The sufficiency issues we see in many areas may be leading to greater use of unregistered provision. It is hard to be exact, as the lack of a definition of ‘care’ in the legislation means it is not sufficiently clear which services require registration. In the absence of a clear definition, some providers operate children’s homes without realising they are doing so. We have seen children being placed in ‘other arrangements’ in settings that we consider require registration.[footnote 12] Some providers interpret the existing exemption in the children’s homes regulations to their advantage. For example, some providers are misusing the 28-day exemption intended for holidays and sports trips to accommodate children in a succession of short placements, denying them stability.
Revisiting the exemptions or explaining their purpose more clearly in care planning guidance would help the sector. More generally, there is an issue with the legislation: in particular, the Care Standards Act 2000 is out of date and the legislation does not support creative solutions or allow new service models to develop.
Our investigations into unregistered care suggest that a small number of companies are purposely setting up short-term arrangements to avoid registering as children’s homes. Whatever their intentions, they are filling a gap in current provision. Without further investment in the sector, this gap will remain. We have been proactive in visiting premises that are not registered but are providing care and accommodation to children – the definition of a children’s home. In these circumstances, the provider is acting unlawfully and we try to get it to register or to cease operating. In addition, we contact the placing local authority with the expectation that it has an appropriate plan for the child to move on and/or is actively encouraging the provider to register. If unlawful activity continues, we have powers to prosecute the offender.
What is clear from our work on provision for vulnerable children, whether in SEND, AP or social care, is that where our oversight is weakest (as in unregistered providers) or accountability is least clear (as in area SEND), the problems we find tend to be greatest. All children deserve high-quality education, care and health provision. We need the tools to make sure they get it.
Strong partnership working
Protecting the most vulnerable children and young people requires partnership and coordination. No one can do it alone. Strong partnership working is a feature of good provision in both social care and area SEND inspections. When education, health and social care providers work together effectively, we see better outcomes for children and young people.
Partnership working needs to go beyond good intentions and conversations at leadership level. It is about effective exchange of information between partners, and about taking joint responsibility for the welfare of children and young people through work on the ground. In good partnerships, information-sharing and an understanding of responsibility and accountability lead to rapid action.
However, the picture that emerges from our joint targeted area inspections (JTAIs) in social care and our area SEND inspections is mixed. In some of our previous JTAI reports, such as on neglect of older children or child sexual abuse in the family environment, we have been critical of a lack of effective partnership working.[footnote 13] The domestic abuse JTAI report showed that probation services do not always contribute to safeguarding children.[footnote 14] The JTAI report on child sexual abuse in the family environment also showed that practice was too often police-led and not child-centred, often with no involvement from health services.
Our forthcoming JTAI report on children’s mental health will present a more positive picture, however, with examples of partner agencies working well together to improve the range of services available to children and to make these more accessible. Specialist child and adolescent mental health services have been restructured in many areas to develop systems and processes, to improve pathways for children in need of a range of services, and to provide support to professionals, parents and carers. In many areas, this is leading to improvements in the identification of, and response to, children with mental illness. But in all areas, there are still gaps in services. Some children have had to wait too long for their mental health needs to be identified and to receive the right support. And while significant progress has been made, improvements are not consistent across areas or within all agencies.
Overall, our JTAIs are leading us to some solid conclusions on what the foundations of effective multi- agency work are. These are about both systems and culture. On the former, good systems are essential for sharing information, multi-agency auditing, clear understanding of the roles of different agencies, and multi-agency training. Culture is equally important. All partners need to share an ambitious and child-centred leadership approach, and a culture that values professional practice and disciplines while also encouraging strong support and challenge.
Our own partnership working is also making a difference. We evaluated the area SEND framework, and found that the joint inspection approach with CQC had led to better coordination between education, health and care locally, and that EHCPs had improved as a result of the increased focus on SEND and enhanced local collaboration. Areas described having clearer direction from their leadership and improved structures for enabling change.[footnote 15]
In other areas of social care, our joint work with other inspectorates has also had several positive effects. We have been able to gain a deeper understanding of the role each agency plays in multi-agency working, and of their impact on help and protection for children and young people. This has enabled inspectorates to much better understand each agency’s role. We have been able to share knowledge effectively across inspectorates, for example about service responses to child protection, and this has improved how inspectorates carry out their own individual inspections.

The JTAIs also influence inspectorates’ priorities and programmes. Our domestic abuse JTAI report showed that probation services do not always contribute effectively to child safeguarding processes. This led to a 2018 thematic inspection by Her Majesty’s Inspectorate of Probation on the work of community rehabilitation companies.[footnote 16] Her Majesty’s Prison and Probation Service is also working on a domestic abuse action plan in response to the report’s findings.
Effective partnership working is therefore not just important in providing vulnerable children and young people with the support they need, but also makes our own work better when we successfully model it and engage with partner inspectorates.
We recently reported on our research project exploring what contributes to good matching decisions for children in foster care.[footnote 17] As expected, we found that the serious shortage of foster carers was one of the most significant challenges in making successful matches for children. However, despite seeing many examples of effective work to identify suitable carers for children, there was room for improvement in several other important areas of matching practice.
For example, carers and fostering agencies often felt that the information that was shared with them about children was out of date, incomplete or too impersonal. Most importantly, children were not always sufficiently involved in the decisions and plans about where they were going to live. When children were given good information about their foster carers, it helped them to settle and develop a sense of belonging.
This project is the first of several looking at decision-making for children in care. We hope that the findings will be useful to everyone responsible for the care of these children and encourage improvement in this critical area.
Capacity of the ‘market’ to deliver vital services for vulnerable children
Social care and early years provision is provided in large part by private companies, operating in a ‘market’. The bigger players in these markets are steadily swallowing the smaller ones. While this does not seem to be currently affecting quality, it is clear that in some cases there are not enough places suitable to meet the needs of all vulnerable children in social care.
The percentage of private and voluntary children’s homes owned by the 10 largest providers has not changed from 2019 and remains at 30%. CareTech Holdings Limited owns almost 10% of children’s homes.[footnote 18]
Around 43% of nurseries and pre-schools operate as part of a group under a single registration. Since August 2018, there are about 800 fewer standalone nurseries and pre-schools, suggesting that more are joining a group. These groups tend to be small: only 6% of nurseries and pre-schools are in groups of 21 or more under a single registration.
Despite ‘market’ mechanisms, there are big issues with sufficiency in children’s social care. This remains a major concern. The current system is not working well for children. For example, there is a serious shortage of secure children’s home places: at any one time, around 25 children are waiting for a secure children’s home place and around 20 are placed by English local authorities in Scottish secure units due to the lack of available places in England.
We continue to see growth in parts of the country that already have high numbers of children’s homes, and a shortage of places where they are needed. No single local authority can fix this on its own. Commissioning is often linked to individual children and prices are high, so the ‘buyer’ is often not in a good position to negotiate the best solution. National and local action is needed to create a system that works for children. Local areas need to engage in co-production with children and families, local communities and providers to develop a mix of in-house and commissioned provision. However, no single local authority or regional grouping can solve this on its own, and addressing these issues needs to be a fundamental part of the forthcoming Care Review. Central government has a critical role to play.
Case study: instability in care
After being adopted at an early age and re-entering care in his early teens, Michael (now aged 15) has experienced several changes of foster carers and children’s homes. The local authority has struggled
to find a stable placement that can protect Michael and help him to feel safe. Due to a lack of suitable
alternatives, it was forced briefly to use unregulated provision for Michael, despite his young age and
complex care needs.
He is now living in a children’s home, where he is the only child. Although the local authority is working hard with the children’s home to help Michael settle, his future remains extremely uncertain.
Michael’s serious risk-taking behaviour has only escalated during his time in care. His self-esteem,
already fragile as a result of early adverse life experiences, has been further damaged by the serious
lack of stability and consistent care. His trust in adults is understandably low. If no one cares for him,
he wonders, why should he care about himself?
‘I just know that nobody gives a shit, it is obvious.’
Case study: sufficiency issues in foster care
One local authority reported to us that foster provision is primarily available for children under 10 years
old and who have lower-level needs that do not present complexities. When children present complex
issues and need foster placements, they are often not available. In these situations, the local authority
finds itself moving children quickly and maybe not into the best options, but what can be found at that
time. There is no time to plan. Last-minute changes mean children grow to distrust the local authority,
and it affects their ability to attach to carers. This is not a good start for the children.
One child, aged 6, had 6 foster-placement breakdowns, significant complex issues and safeguarding
concerns with her family. The number of placements compounded the significant attachment difficulties and trust issues she had. Her behaviour escalated and foster carers could not cope. She had no safe place to go, and was in a state of constant fear and anxiety. At a very young age, she had a range of significantly disrupted attachments and a fragmented identity. She found it difficult to cope with the intensity of family environments, so the local authority reluctantly placed her in a one-to-one therapeutic unit. Staff at the unit have started to calm her, always holding her hand whenever walking around (even indoors). This is providing ‘grounding with an anchor of a hand to hold’.
The impact of the COVID-19 pandemic
Both the education and social care systems in England have been severely disrupted by the COVID-19 pandemic. While it is in many ways still too early to fully judge its impact, and we are limited by not having the evidence from inspection that we have used for other sections of this report, we are starting to understand more about the effects on children and young people and on the providers we inspect.
I am proud of Ofsted’s response to the pandemic. We recognised early that much of our regular work would need to pause, but that other areas of government, along with local authorities and frontline services, would come under great pressure. We acted quickly to deploy many hundreds of staff to support the national response, in central and local government and elsewhere, while making sure that our critical regulatory work continued.
There has been no lowering of the standards that we expect providers to work to in either social care or early years. Although the Department for Education temporarily eased some regulations, we still expect high standards and a high-quality experience for children.
The crisis has underlined the importance of putting children’s welfare first. We continued to carry out our regulatory work, including monitoring and visiting settings of high concern. Where necessary and proportionate, we also continued to use our enforcement powers.
Disruption to education
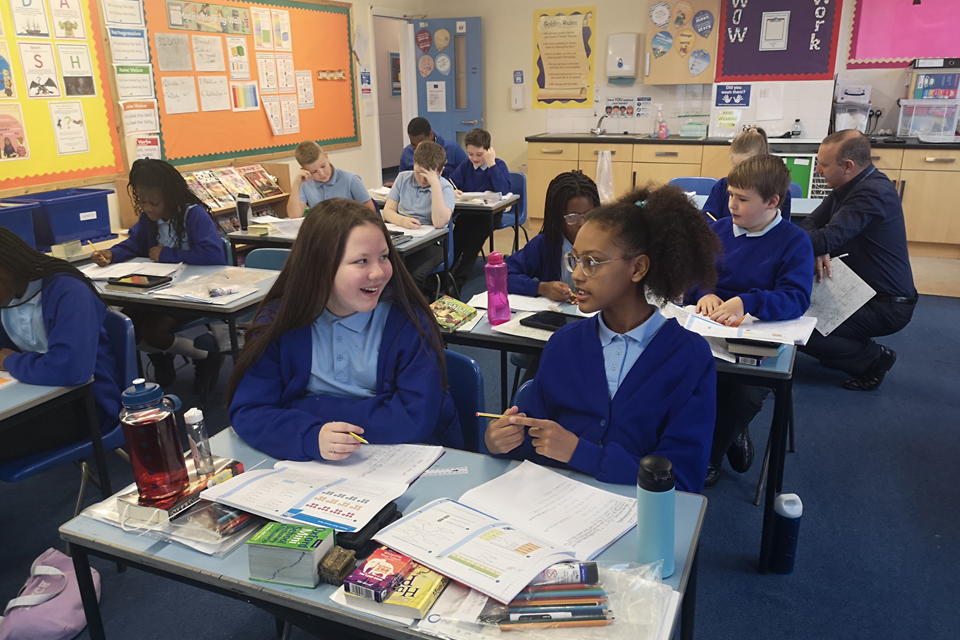
As schools, further education providers and early years providers closed their face-to-face provision from March to June for all but vulnerable children and children of key workers, the vast majority of children and young people have lost at least some learning time.
Most children went back to school in September 2020, having been out of school for 14 weeks. To put 14 weeks in context, it is about 3% of a child’s entire time in school, from Reception to Year 11.
Some schools tried to teach a full curriculum during the first national restrictions, through online lessons, work sent home and other means, but some did not, or could not. Of course, some parts of the curriculum do not lend themselves to remote learning. Even where schools made good provision, few children did as much schoolwork as they would have done at school.
Many children lost not just a term’s education, but also the consolidation of what they were taught in previous years. While we do not yet have reliable evidence on ‘learning loss’ from the pandemic, it is likely that losses have been significant and will be reflected in widening attainment gaps. The assessment company No More Marking tested over 112,000 Year 7 pupils in 644 secondary schools using a short writing assessment, which used comparative judgement. The results were placed on the same scale as No More Marking’s previous primary writing assessments. The average writing score of this Year 7 cohort (starting in September 2020) is almost exactly the same as the average score of 531 achieved in No More Marking’s most recent Year 5 assessment from November 2019. This average score was also significantly lower than the last time this cohort were assessed when they were in Year 6.[footnote 19] This suggests the picture is worse than just ‘no progress since the first national lockdown’. We cannot yet say how long it will take to retrieve lost ground.
This backs up previous research on pupils’ absence, which suggests that in normal times, 8 days of individual absence would move a pupil one place down a ranking of 100 pupils by achievement. There is also evidence of small but persistent negative effects of coordinated closures of schools on whole cohorts. The effects tend to be larger for disadvantaged pupils.[footnote 20],[footnote 21]
When schools set remote work, many children did not do it, or did little. Sometimes, this was because they did not have the hardware, connectivity or quiet space to work. Others struggled with the work without a teacher, for example because they have SEND or speak limited English, or simply because self-study is harder than being taught. In many cases, parents had competing demands from other children, jobs and wider family responsibilities and were not able to give children as much structure and support as they would need to cope with schools’ expectations. Some children struggled with motivation in the absence of the structures and routines of school, being in a classroom with a teacher, and seeing and being seen by their peers doing the same work.
Various studies confirm this. On average, research suggests children in England were spending 13 hours per week during lockdown on home learning, but one study by the Institute of Fiscal Studies suggests that the figure could be as low as 5 hours.[footnote 22], [footnote 23], [footnote 24] Children aged 11 to 16 were spending 6 hours more on school work than children aged 5 to 10.[footnote 25] There was also great variation in the amount of time spent learning at home. Seventeen per cent of children were learning for 4 or more hours per day and 1 in 5 were learning for 1 hour or less.[footnote 26]
Furthermore, it looks certain that learning loss will affect children and young people unequally. The Institute for Fiscal Studies and Institute of Education studies point to big differences both in provision (for instance, private schools offering more support and resources than state schools, on average) and in take-up.[footnote 27] These effects should not be seen only through the lens of the usual categories of disadvantage (although on average, disadvantaged pupils will be more affected). Factors such as differences in how much support the school provided, parents’ availability and pupils’ motivation all contribute to how much learning a child or young person has lost. The most affluent child in the country will probably not have achieved much during the first national lockdown if their parents were unavailable to help and they lacked motivation themselves.
Children with an allocated social worker were one of the categories of children generally expected to continue attending school through the summer. This group included children in care. In practice, it appears that most children in foster care and children’s homes did not attend school, or not regularly. This may be because what was on offer for them was often childcare rather than education.
Of course, some children will have had valuable experiences outside of school, and many parents have stepped in to teach or help their children. The government’s direction to schools to provide remote learning to pupils and bubbles who need to remain at home and the provision of devices for remote learning were also helpful in spurring development. Some education providers quickly developed remote learning offers, often using digital platforms. The work of Oak National Academy, for example, is noteworthy in its scope and the rapidity with which a large volume of material was developed across national curriculum subjects. However, it is clear from our recent review of online education in FES during COVID-19 that this can only ever be a partial solution to ensuring a good quality of education and training where education cannot happen face to face. Indeed, remote (including online) education can be, and is sometimes, delivered ineffectively.[footnote 28]
Our survey of online provision in FES showed that online education needs to be well integrated into the provider’s curriculum offer as a whole and adapted to the learning needs of learners in order to work effectively. Teachers need to be suitably able and trained to use it. Learners miss the face-to-face contact of the classroom, not only for social interaction but also for the instant feedback and opportunity to ask questions that it provides. Some providers say their learners’ engagement is good simply because learners have logged on to online sessions. The reality may be that the learners have logged on but are doing other things, and so are not fully engaged in the learning. Some learners admitted to being frequently distracted. To avoid those without sufficient access to online devices and connectivity falling behind, the Department for Education, colleges and other providers need to invest in this as well as in a suitable virtual learning environment and staff training.
These lessons from FES are likely to apply to schools as well. Online education is likely to have less benefit for younger children. For example, while some of the areas of learning set out in the early years foundation stage, such as literacy and mathematics, can be taught to a limited extent online, other areas such as developing fine motor skills in physical development or empathy in personal, social and emotional development do not lend themselves to remote learning. Even among older pupils in secondary and beyond, remote learning is not a substitute for in-class learning. Pupils’ motivation is often lacking,[footnote 29] parents cannot be expected to provide the levels of knowledge and support that teachers have, and teachers cannot replicate the experience of a good classroom.
It has been notable that many have tended to conflate remote and online learning. Unlike in many other countries, high-quality textbooks are not routinely used in most education provision in England, nor even available for all subjects and all age groups. Without these resources, schools and colleges have had to work fast to put together quite complex systems and programmes to support remote learning. In some cases, the use of non-digital resources (such as high-quality textbooks) would have made it quicker, easier and cheaper to establish a well-structured programme of remote learning.
And of course, some learners have seen their provision disappear entirely. Apprentices have missed out on work and learning during the crisis: 36% of apprentices were furloughed; 8% were made redundant; and 17% had their off-the-job learning suspended.[footnote 30]
Another concerning area is prison education. Education, skills and work activities in prisons stopped completely in order to control the spread of the virus, leaving prisoners with very few learning opportunities.
Our recent visits to education providers
I am pleased that inspectors have been able to visit providers during this autumn term, and that we are now sharing what we have found with parents, government and providers themselves.
Our initial findings from the interim visits to schools showed the great effort leaders made to respond to the challenge of fully reopening. Leaders reported wide variability in the extent to which pupils returned to school this term: not all pupils came back following the first national lockdown. And although in many schools, attendance rates for those who came back are comparable with normal for this time of year, in others attendance was affected by groups of pupils having to self-isolate. Leaders said that children were happy to be back at school and to see their friends, but were sometimes suffering from poor physical health.
Leaders said that they were making some adaptations to their curriculum, based on practical considerations or as a result of pupils having lost learning while not at school, or often both. Leaders were ambitious to return their schools to their usual, full curriculum as soon as possible. They also talked about the many challenges they were facing in keeping their schools safe and open.
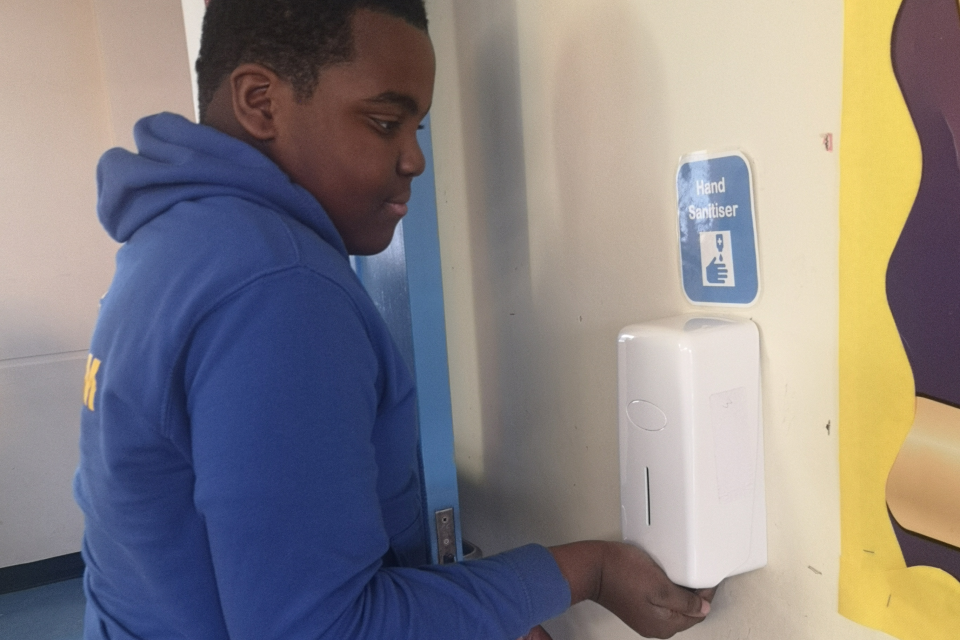
In FES, most providers we visited had remained open during the first national lockdown and continued to deliver provision remotely. To do this, many had changed their courses to be either fully remote or a mixture of remote and face-to-face teaching.
This move to remote learning often resulted in shifting around of course content, for example teaching theoretical work remotely and fitting in practical sessions in the autumn. A few leaders had started to change what they were teaching in response to changes in the economy and job market. Learners in some providers were also signing up for different courses than they were before the pandemic.
Learners’ experiences and the help they received from providers varied. Some learners missed the socialisation that face-to-face learning brought them and found it challenging to engage with learning remotely. Others told us that they liked the additional flexibility and independence that remote learning gave them.
Many of the leaders we spoke to also felt financial pressures. They said the pandemic had increased their costs at the same time as reducing their income streams and destabilising future funding.
In early years, providers told us that many children had not returned to early years provision. They said that the pandemic had significantly impacted the learning and development of children who had returned. Four in five providers told us that children had either not progressed, or their progression had declined, in communication and language, physical development, literacy and mathematics. However, the key area of development that providers were most concerned about was personal, social and emotional development. Fifty-three per cent of providers agreed that this had declined.
Many providers have given aspects of the curriculum a greater focus as a result of the pandemic. Most said they have placed more emphasis on personal, social and emotional development and physical development. Many recognise that children have had different experiences during this period and are planning around children’s individual needs. Some told us they are focusing more on gaps they have identified in what children know and can do. Many have made changes to the resources and routines in their settings and most have increased their teaching of personal hygiene.
Loss of sight of vulnerable children
A big concern for us during the period when schools were closed to most children was the lack of visibility of vulnerable children. Schools are crucial to children’s safety and welfare, and not just while they are on school premises. In normal times, around 20% of notifications to local authorities about children come from schools and early years settings. Teachers know their children and often recognise when something is not right.
The low numbers of children in school during the first national lockdown therefore directly affected the ability of local safeguarding partners to identify neglect and harm. Combined with disruption to community health services, which are the universal service for very small children, it became more difficult to identify children’s and families’ need for early help and protection. Instead, local authorities are more likely now to be responding to a legacy of abuse and neglect.
Agencies now need to work together to make sure cases that need following up most urgently are prioritised.
Some children were particularly vulnerable under the restrictions, including:
- children with SEND, who may have needed extra help to adapt to changes in routine and to understand what is going on
- disabled children who were no longer able to access educational support and already face increased risk of abuse
- disabled children who previously had visiting carers, which may have put extra pressure on parents to manage their child’s complex needs
- very young children in care who needed direct contact with birth parents and siblings
- young carers
- care leavers, who may have been socially isolated
- babies whose parents struggled when families could not visit and health visitors had to pause home visits
- children with pre-existing mental health problems
Unsurprisingly, partnership working has also been affected by the COVID-19 pandemic. There are, however, some reports of better multi-agency working. Some practitioners reported that it has been easier for agencies to join up virtually because many services operate remotely. COVID-19 has also reinforced the need for agencies to collaborate, and created a sense of urgency around this.
We have a concern around pupils with SEND. Their access to additional support and healthcare was sharply reduced. Early identification and assessment have suffered because children were not in school and had less access to universal health services. For some children, this will cause lasting harm. Most pupils with EHCPs did not attend school during the first national lockdown. Although many special schools never shut, and by the end of the summer most special schools were fully open, attendance remained low.[footnote 31] We have had reports that the lack of respite and support for families of children with highly complex needs affected those families’ ability to cope.
There are also clear issues for care leavers. Coram Voice reported that before the pandemic: 23% of care leavers had low well-being, 37% did not feel safe where they live and around a third did not feel that where they live is right for them. This makes self-isolation a particularly big problem for them, which is likely to affect mental health, in some cases quite severely.[footnote 32]
There are obvious concerns around the physical and mental health of children and young people as a result of the pandemic. The impact on children’s well-being will be multi-faceted. They will have worries about their future and about missing education, and there may be impacts on their family, such as possible bereavement. There are also concerns about children being lonely and therefore vulnerable to being groomed online.[footnote 33], [footnote 34] This is matched by concerns from parents about the impact on their children. The Office for National Statistics found that during the first national lockdown, 43% of parents whose children were not in school agreed it was negatively affecting their children’s well-being.[footnote 35]
Our recent focused visits have looked closely at how local authorities have maintained contact with children in care and care leavers, and at how they have enabled them to keep in touch with friends and families. When face-to-face visits were not possible, the use of technology for children and young people to keep in touch with people who were important to them became commonplace. Before March, our reports generally flagged the use of different media to speak to children and young people as noteworthy good practice. The pandemic has brought this practice into the mainstream, where it is likely to stay. As always, the strongest services will make use of a range of different options to meet children’s individual needs and wishes.
However, at this stage, we need to be cautious about drawing strong conclusions in light of the limited evidence of the actual impact of the pandemic.

COVID-19 has exacerbated concerns about sufficiency of provision
Earlier, I mentioned continuing concerns around sufficiency in the social care market. These concerns have been exacerbated by the pandemic. The number of children waiting for placements has doubled. A significant proportion of voluntary adoption agencies are reporting serious financial problems and their numbers have dropped by 22% compared with 31 March 2019 (50 to 39).[footnote 36]
We see similar issues in early years, where the largest expenditures are usually staff costs. Many nurseries have voiced significant concerns around delayed payments, particularly those associated with the Job Retention Scheme salary payments. Some nurseries that continued to provide childcare for key workers and vulnerable children have been able to secure additional bank support but many nurseries that were already struggling fear they will not be able to reopen.[footnote 37] A recent survey by the EY Alliance found that a quarter of childcare providers believe they are likely to close within the next year.[footnote 38]
In addition, the pandemic has led to growing concerns over sustainability in parts of the FES sector. COVID-19 has serious financial implications for FES because most further education colleges are partly dependent on funding through the apprenticeship levy, which is not currently guaranteed. Further government funding initiatives around capital expenditure and the national skills fund should help colleges to re-balance their finances to an extent. But those funded through the apprenticeship levy will not have this special relief available, and so hundreds of ILPs are dependent on funding from the Education and Skills Funding Agency and other schemes for cashflow and continuation. Their viability depends on businesses buying their training services, but some of those customers have gone, or will go, out of business themselves or reduce their training. The full impact of this remains to be seen, but some providers have already ceased trading.
We will monitor developments in these markets because sufficiency of provision is central to ensuring that children and young people receive the education and care they need.
Examples of resilience in a crisis
While a crisis such as the COVID-19 pandemic brings major concerns, we have also seen some impressively resilient responses from providers.
In social care, we have seen many remarkable examples of resilience, creativity and adaptability. These were witnessed first-hand by our inspectors who were deployed to support local authorities. Local authorities and agencies have shown a consistent commitment to putting the needs of vulnerable children first, despite complex circumstances.
Our interim visits to children’s homes showed us that most had been managing the challenges of the pandemic well.[footnote 39] They had put suitable measures in place to ensure that children were safe and they remained aware of the possible impacts on children’s emotional well-being. Inspectors were generally confident that children were safe and well cared for. Staff worked hard to make homes fun and provided activities to support learning. They helped children to maintain relationships with friends and families through messaging and video technology and worked with partners to ensure that specialist services continued. Unsurprisingly, homes also reported an increase in anxiety and frustration in children around COVID-19.
There was some evidence of less oversight in many homes, but much more evidence of strong leaders managing the challenges of the pandemic well.
Having remained open to care for the very youngest and most vulnerable children in our communities, early years settings were part of the wider return of children into education. There have been numerous challenges along the way, not least the financial burden of running settings below capacity, so as to adhere to social distancing and the preservation of ‘bubbles’. However, many providers have risen to this challenge, building parents’ confidence and ensuring the health and well-being of young children and their families.
Case study: effective communication
As highlighted by a nursery in Northumberland, effective communication is key.
Staff made sure to communicate: with parents so that they were able to allay their fears; with local
authorities in order to navigate their way through the very complex mechanics of funding systems and
ever-changing guidance; and perhaps most importantly, with other providers of care and education,
including local schools, in order to secure a smooth transition for children back into a learning routine.
Parents who chose to keep their children at home were not forgotten. Staff were on hand to provide virtual support with a plethora of issues, including behaviour and anxiety management.
This nursery recognised the complex web of support that wraps around children in the early years.
By understanding their community and working in partnership, staff created unique solutions, many of
which others will learn from.
In schools, we know leaders and staff have made huge efforts to provide education in the toughest of circumstances. Almost all schools were either providing remote learning to pupils who were self-isolating or said that they were ready to do so if needed. They have been communicating and working closely with parents, which in many cases has led to improved relations and understanding. Leaders have been working to support the well-being of both staff and pupils, sometimes at a cost to their own well-being.
Many FES providers were particularly quick in adapting to remote learning, putting systems in place and reorganising teaching to suit a remote approach. We found that leaders in many providers were working closely with employers, local organisations and partners to support learning. Many leaders told us that their relationships with employers and other organisations had become stronger over this period, and some providers successfully established links with new employers for placement and work-experience opportunities.
Our programme of interim visits this term is giving further insights into the impact of COVID-19.
Data on Ofsted’s activities
In 2019/20, Ofsted inspected or visited over 21,100 schools, colleges and providers of social care, early years and FES. Over half of this year’s inspections and visits (14,000) were to early years and childcare providers, 3,250 to state-funded schools, 2,550 to social care settings and over 400 to further education providers. The remainder related to independent schools, unregistered schools, ITE, area SEND and local authority inspections and visits.
This section provides a range of data on Ofsted’s activities and supports many of the findings highlighted earlier in the report.
Any comparisons of activity in 2019/20 and 2018/19 should be made with caution. This is due to the different mix of providers inspected in any 2 years, the different inspection frameworks used for these 2 years and the pause in most inspection activity since March 2020.
Data on our inspection activities can be downloaded from our management information and official statistics pages. For a more interactive look at changes in inspection outcomes over time, please visit the regional performance sections of Ofsted’s DataView pages.[footnote 40]
Early years and childcare providers
‘Early years’ refers to the care and education of children from birth to 5 years old. This includes providers registered with us, such as childminders, nurseries and pre-schools.[footnote 41] It also includes maintained nursery schools, and Nursery and Reception classes in schools.[footnote 42]
Ofsted operates 2 registers: the Early Years Register (EYR) and the Childcare Register (CR). The EYR is for providers that care for children in the early years age group somewhere other than in the child’s home. Registration is compulsory for these providers and they must meet the requirements of the early years foundation stage. The CR has 2 parts, compulsory and voluntary, with associated requirements that providers must meet. It was established to provide access for parents to tax credits and to give parents reassurance that the childcare provider has passed some basic checks to ensure that their children are protected.
Figure 1: Early years and childcare providers and inspections in 2019/20

Download a zip file with the underlying data in csv format.
Inspection outcomes
Most recent inspections
Of the inspected EYR providers, 96% were judged good or outstanding at their most recent inspection. This is unchanged since last year and a marked increase from 85% in 2015, the start of the CIF. Providers that are judged less than good have more opportunities to demonstrate improvement because they are inspected more frequently.
Of the relatively few nursery schools we inspect, a high proportion also have very positive inspection outcomes, with 63% judged outstanding at their most recent inspection.
Figure 2: Overall effectiveness of early years providers: 31 August 2020

Download a zip file with the underlying data in csv format.
Each year, Ofsted inspects a 10% sample of providers that are only on the CR. These inspections do not result in a quality (graded) judgement but a judgement as to whether the provider has met or not met the legal requirements for registration. We found that 86% of the inspected CR-only providers met the requirements of registration. Childminders had a higher proportion that did not meet the requirements (20%) compared with nurseries and pre-schools (13%).[footnote 43]
We define a nursery and pre-school group as at least 2 nurseries and pre-schools on the EYR under the ownership of the same registered person. Over half of nurseries and pre-schools operate as standalone provision, but around 43% operate as part of a group under a single registration.
The proportion of nurseries and pre-schools judged good or outstanding is similar across those in groups and those operating alone. However, the proportion of providers judged outstanding increases with the size of the nursery group.
Figure 3: Overall effectiveness of nurseries and pre-schools by group size: 31 August 2020

Download a zip file with the underlying data in csv format.
2019/20 inspections
In September 2019, we began inspections under the EIF. Routine inspections paused in mid-March 2020 as a result of the COVID-19 outbreak. Between September 2019 and August 2020, we carried out 8,540 inspections of early years and childcare providers. Of these, 7,330 were full inspections of providers on the EYR. We judged 89% of these providers as good or outstanding overall. A higher proportion of inspections resulted in an outstanding judgement compared with 2018/19. This may be due to Ofsted inspecting a higher proportion of previously outstanding providers as we near the end of an inspection cycle.
Figure 4: Overall effectiveness of early years providers by academic year

Download a zip file with the underlying data in csv format.
The proportion of key judgements that were good or outstanding is similar to the overall effectiveness judgement, but leadership and management and personal development are most closely aligned at 89% and 90% respectively.
Figure 5: Overall effectiveness and key judgements of early years providers, 2019/20

Download a zip file with the underlying data in csv format.
Providers and places
Since August 2015, the number of childminders has continued to fall steadily, while there has been minimal change in the number of nurseries and pre-schools. Early years places have remained stable at around 1.3 million, suggesting an increase in the average number of places offered by each provider over time.
Figure 6: Early years and childcare providers and places on the Early Years Register over time, by provider type

Download a zip file with the underlying data in csv format.
There has been a consistent downward trend in the number of Ofsted-registered childminders since 2011/12. The number of childminders joining the register has also been declining since this time, except in the last year, when 130 more childminders joined compared with 2018/19.
Figure 7: Childminder joiners and leavers since 2010/11

Download a zip file with the underlying data in csv format.
Early years regulation
Complaints and notifications
In 2019/20, we received 13,700 complaints and notifications related to around 9,070 providers.[footnote 44]
The number of complaints (6,640) was similar to the number of notifications (7,040). The large majority of these cases related to nurseries and pre-schools.
Around two-thirds of cases were logged for consideration at the provider’s next inspection because the issue did not require immediate action. This was the case for most notifications from nurseries and pre-schools. In contrast, we referred nearly two-thirds of the complaints made about childminders for regional action.
Figure 8: Outcomes of complaints and notification cases, by provider type

Download a zip file with the underlying data in csv format.
Regulatory visits and enforcement
In 2019/20, we carried out 4,740 regulatory visits to 3,460 early years and childcare providers. Most of the regulatory visits were due to complaints or notifications. Around 4% of visits were as a result of providers being judged inadequate at inspection.
The large majority of providers remained active on our registers following a regulatory visit. However, 5% resulted in the provider being cancelled or suspended and 11% resulted in the provider becoming active on our registers following a proposal to open or a prior suspension. Of the providers we visited in 2019/20, 7% resigned.
Overall, there were 2,260 cancellations and 200 suspensions of childcare providers in 2019/20. Most cancellations (91%) were due to the provider not paying their fees. Around 5% were because there were no children on roll.[footnote 45] Those remaining were about more serious issues (4%); the majority were about a continued failure to meet requirements and outstanding suitability checks.
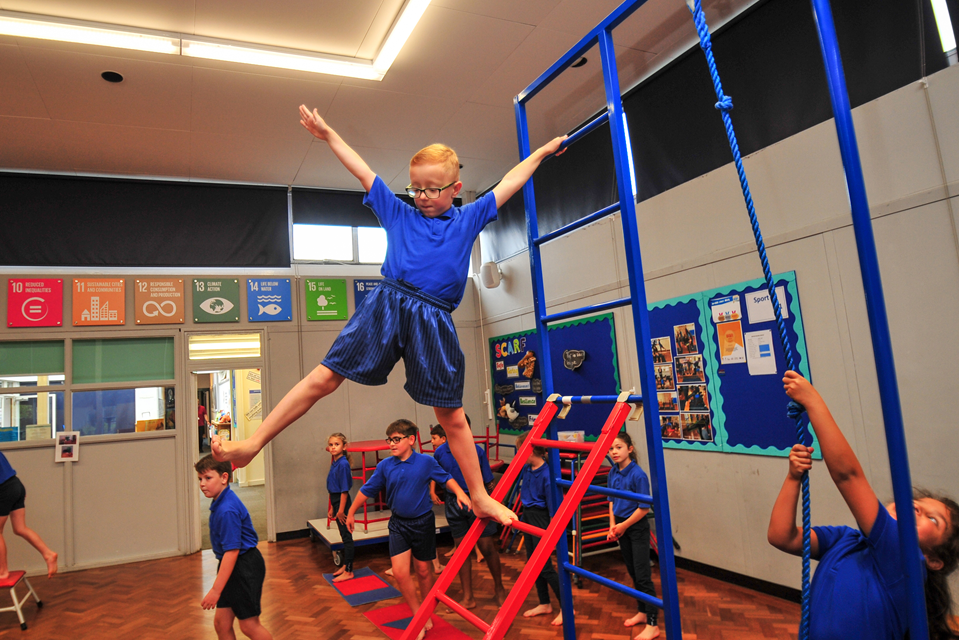
Schools
State-funded schools
There are currently nearly 22,000 state-funded schools. Forty-two per cent of schools are now academies. In 2019/20, we carried out 3,250 inspections.
Figure 9: State-funded schools and inspections in 2019/20

Download a zip file with the underlying data in csv format.
Inspection outcomes
Most recent inspections
Overall, 86% of all 22,000 schools have been judged good or outstanding at their most recent inspection. This proportion remains unchanged since 2018, but is a substantial increase from 68% in 2010. There have been small changes for some phases; for instance, the proportion of good and outstanding primary schools has increased from 87% to 88% this year.
Figure 10: Overall effectiveness of state-funded schools: 31 August 2020

Download a zip file with the underlying data in csv format.
There is some regional variation within this overall pattern. Grades are particularly high in London, where 31% of all schools were judged outstanding at their most recent inspection, and 62% were judged good. Pupils in London schools achieve good outcomes, which is reflected in the strong performance of this region on most attainment and progress measures.
Figure 11: Overall effectiveness of state-funded schools, by region: 31 August 2020

Download a zip file with the underlying data in csv format.
The grades also vary by type of school. For instance, 91% of local authority maintained schools were judged good or outstanding at their most recent inspection compared with 80% of academies. However, in some cases, the latest available grade for an academy relates to an inspection of the local authority school that preceded it, or before it joined its current MAT.

It is difficult to make fair comparisons between different types of schools for several reasons, including because:
- sponsor-led academies often replaced a struggling school
- we do not inspect new academies until their third year, so some have not yet been inspected as the new school
- outstanding schools (which include many converter academies) were historically exempt from inspection
- there is a range of different inspection frameworks under which schools have been inspected
2019/20 inspections
In September 2019, we began inspecting under the EIF. Between September and March, we carried out around 3,250 inspections, including 2,900 full inspections and section 8 visits to good and non- exempt outstanding schools (previously known as ‘short inspections’). This is far fewer inspections than in a normal year; in 2018/19 we carried out 5,560 inspections. This decrease is because in March 2020 schools closed to most children and inspections were paused.
Seventy-seven per cent of schools we inspected in 2019/20 were judged to be good or outstanding. This is slightly lower than the 80% judged good or outstanding in 2018/19. However, inspections in any single year are not representative of schools as a whole because we inspect weaker schools more often than stronger ones. The schools inspected in 2019/20 on average had slightly lower previous inspection outcomes than those inspected in 2018/19. This means we might have expected slightly lower results from this group of schools.
Figure 12: Overall effectiveness of state-funded schools, by academic year

Download a zip file with the underlying data in csv format.
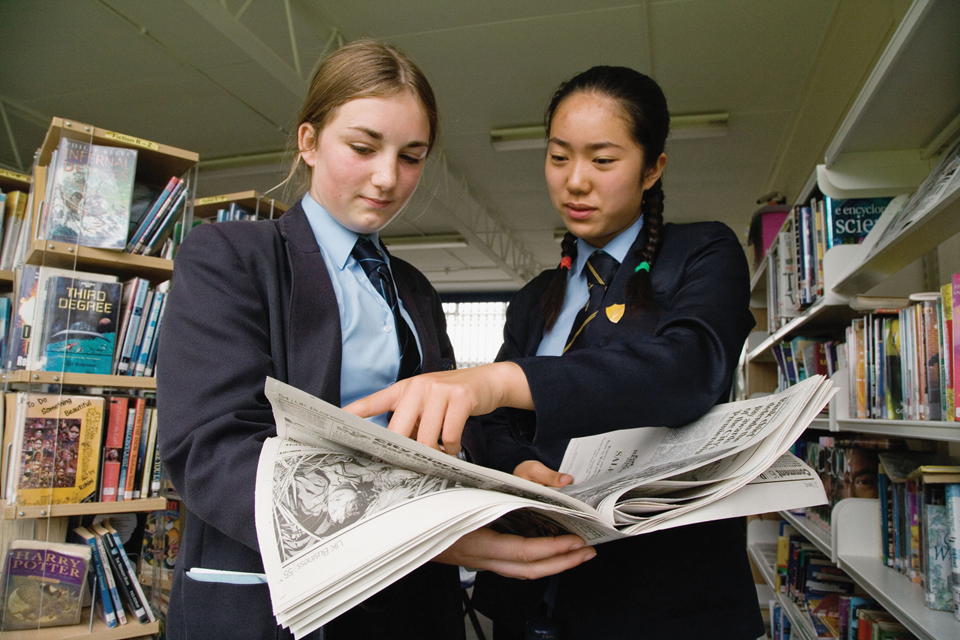
Around 1,550 of the inspections we carried out in 2019/20 were full inspections. Fifty-seven per cent of schools that received a full inspection were judged good or outstanding for overall effectiveness (compared with 62% the year before). This proportion is lower than the 77% we see when we look at all inspections (full inspections and section 8 inspections) as it does not include our visits to good and outstanding schools that did not convert to full inspections.
The proportion of schools judged good or outstanding for overall effectiveness at a full inspection (57%) is the same as for the new quality of education judgement (57%), but slightly lower than for leadership and management (66%). However, grades were often noticeably higher for the other judgements than for overall effectiveness (see Figure 13).
Around 16,800 schools have early years provision. Of these, nearly half take two- and three-year-olds.[footnote 46] Our early years judgement covers all of this provision, both Nursery and Reception. Of the schools with early years provision that had a full inspection this year, 76% were graded good or outstanding for that provision. No early years judgement is made on section 8 visits to good and non-exempt outstanding schools.
Figure 13: Overall effectiveness and key judgements of state-funded schools inspected, 2019/20

Download a zip file with the underlying data in csv format.
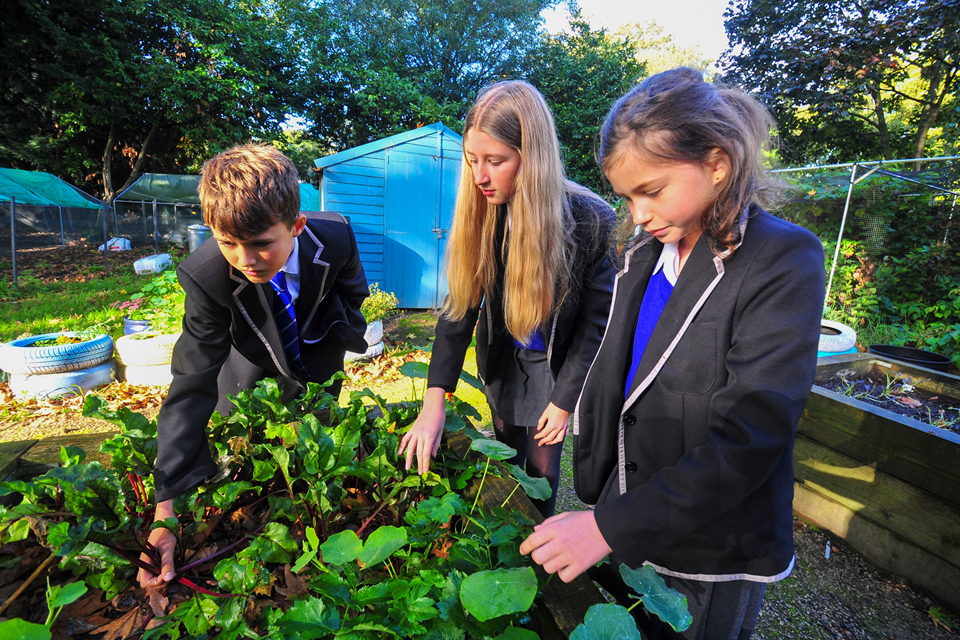
A higher proportion of schools with the least deprived intakes were judged good or outstanding than those with the most deprived intakes. This pattern was seen under the CIF between 2015 and 2019, and is still the case in the EIF in 2019/20. Nevertheless, over two-thirds of the schools we visited this year in the most deprived quintile were judged good or outstanding, so a positive inspection outcome is far from unusual for these schools.
Figure 14: Overall effectiveness of schools inspected in 2019/20, by level of deprivation

Download a zip file with the underlying data in csv format.
Academies and multi-academy trusts
Eighty-four per cent of academies are part of a MAT. Most MATs are small. Seventy per cent run 6 or fewer schools and 38% run 2 or 3 schools. Over the last 2 years, there has been a shift in the balance of schools in smaller MATs to larger ones.
Over the same period, the growth in the total number of MATs and academies has slowed. There are now just 510 academies more than a year ago. In contrast, we saw an increase of 800 in 2018/19, and around 960 each year between 2010 and 2018.
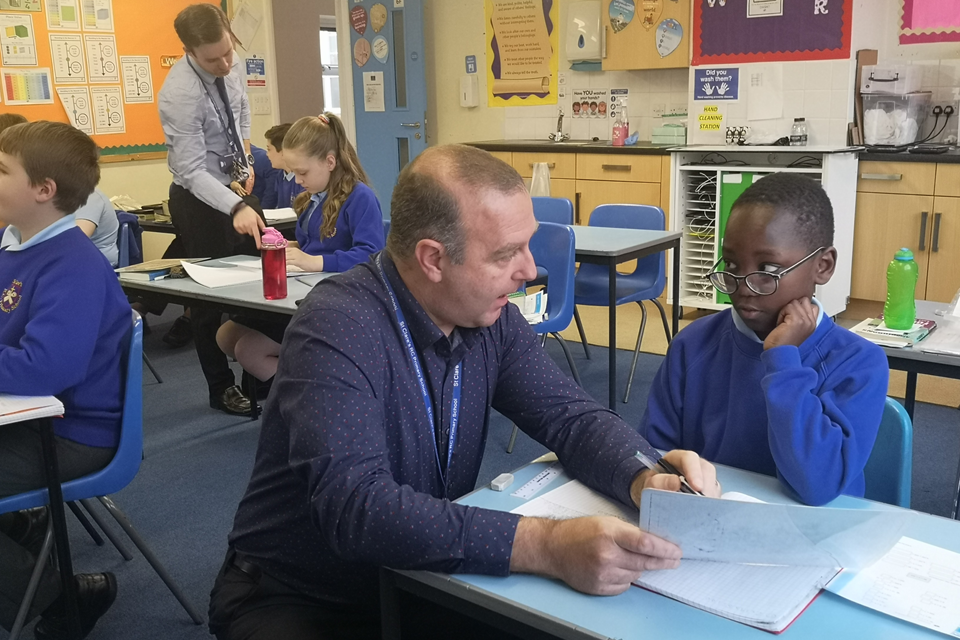
Table 2: MAT sector breakdown, by number of schools, 2019 and 2020
| Size of MAT | Number of MATs August 2019 | Number of MATs August 2020 | Change in number of MATs | Number of schools in MATs August 2019 | Number of schools in MATs August 2020 | Change in number of schools in MATs |
|---|---|---|---|---|---|---|
| Grand total | 1,180 | 1,180 | 0 | 7,130 | 7,680 | +560 |
| 2–3 schools | 490 | 450 | -42 | 1,200 | 1,110 | -94 |
| 4–6 schools | 380 | 370 | -6 | 1,790 | 1,780 | -10 |
| 7–12 schools | 200 | 220 | +25 | 1,740 | 1,960 | +220 |
| 13–19 schools | 65 | 83 | +18 | 980 | 1,260 | +280 |
| 20–29 schools | 24 | 29 | +5 | 580 | 710 | +130 |
| 30+ schools | 21 | 21 | 0 | 840 | 870 | +25 |
1. The numbers of MATs and schools are rounded. However, the ‘Change’ figures are based on the differences between the unrounded numbers for 2019 and 2020, so sometimes do not appear to add up.
Source: Department for Education
Around 330 of the new academies that opened this year were converter academies. At the end of the 2020 academic year, there were still over 11,600 good and outstanding schools remaining under local authority control.
There has been no net change in the number of MATs since August 2019. Most academies are now in a MAT and there has been a drop in the number of academies that transfer into or between MATs.[footnote 47]
The gradual stabilising of academisation is largely a continuation of longer-term trends, rather than a side effect of the COVID-19 pandemic.
Inspection outcomes
In 2019/20, we also carried out 3 summary evaluations of MATs. These were DRB Ignite Multi-Academy Trust, The Heath Family and the Wickersley Partnership Trust.
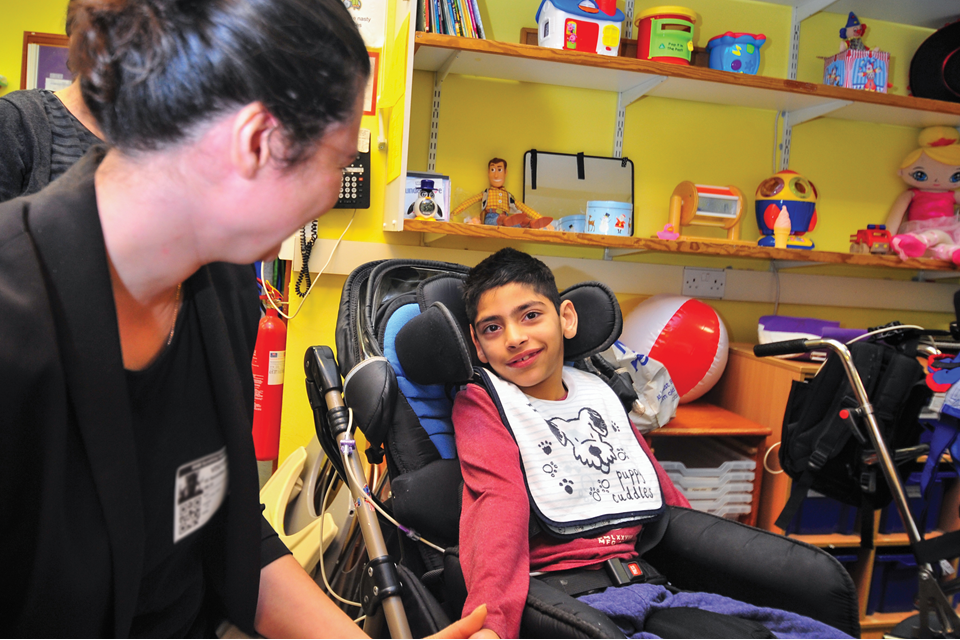
Children and young people with special educational needs and/or disabilities
In January 2020, over 1.3 million pupils were designated as having special educational needs (SEN).
Of these, over one million were receiving SEN support and almost 295,000 had an EHCP. Numbers in both categories have increased each year since 2016. Pupils with SEN now account for 15.5% of all pupils, an increase from 14.9% in 2019.[footnote 48], [footnote 49]
Figure 15: Number of pupils with SEN: January 2020

Download a zip file with the underlying data in csv format.
Most (82%) pupils with SEN are educated in state-funded primary and secondary schools. The majority (91%) of pupils with SEN support attend state-funded mainstream schools. In contrast, just under half (49%) of pupils with an EHCP attend state-funded mainstream schools, and 44% attend special schools.
Figure 16: Education provision for pupils with SEN: January 2020

Download a zip file with the underlying data in csv format.
Inspection outcomes
Most recent inspections
Since 2016, Ofsted and CQC have carried out joint inspections of services for children and young people with SEND in local areas.[footnote 50], [footnote 51] When routine inspections were suspended in March 2020 due to COVID-19, 116 inspections had been completed. This left 34 inspections remaining in the initial 5-year programme.[footnote 52], [footnote 53]
Just over half (59 out of 116) of the areas inspected have been required to produce and submit a written statement of action (WSoA) to HMCI, an indication of significant weaknesses in the areas’ SEND arrangements. The proportion of areas issued with a WSoA varies across the country and is over half in 5 of the 8 Ofsted regions.
Figure 17: Area SEND inspection outcomes by region: 31 August 2020

Download a zip file with the underlying data in csv format.
Ofsted and CQC revisit areas with a WSoA to determine whether sufficient progress has been made in addressing the significant weaknesses identified at the initial inspection. Between December 2018 and March 2020, 21 areas were revisited. Over half (12) were deemed not to be making sufficient progress.[footnote 54] The next steps for these areas are determined by the Department for Education and NHS England and may include the Secretary of State using their powers of intervention. When inspections were paused due to COVID-19, a further 38 areas required a revisit.
2019/20 inspections
During the 2019/20 academic year, Ofsted and CQC jointly completed 16 inspections. Over half (9 areas) required a WSoA due to significant weaknesses identified in each case, ranging from 2 weaknesses in 2 areas to 9 in another. The weaknesses varied across areas, but issues around education, health and care assessment and plans were cited in all 9 inspection reports, and joint commissioning and co-production were mentioned on numerous occasions.[footnote 55]
Ofsted and CQC returned to 10 areas to determine whether they had made sufficient progress in addressing the areas of significant weakness. Seven areas had not made sufficient progress in addressing all weaknesses detailed in the WSoA.
Initial teacher education
There are around 260 providers and 410 age-phase partnerships training teachers through school-centred initial teacher training and higher education institutions. We inspected 7 ITE age-phase partnerships in 2019/20. Five were judged outstanding and 2 were good.[footnote 56] We made only a limited number of inspections this year to develop and test a new inspection framework.
Table 3: Numbers of ITE age-phase partnerships by provision type: 30 June 2020
| Provision type | Number |
|---|---|
| Employer-based initial teacher training | 1 |
| Higher education institution | 170 |
| Initial teacher education in further education | 7 |
| School-centred initial teacher training | 220 |
| Teach First | 13 |
| Total | 410 |
1. Numbers over 100 are rounded.
This year, we also carried out 33 pilot inspections to test our new inspection framework. Following a consultation, the new ITE framework was published in June 2020 and will be used from January 2021.[footnote 57], [footnote 58] It aligns with the curriculum focus of the EIF and will ensure that the inspection of teacher education focuses on the substance of the ITE curriculum.
Inspection outcomes for ITE remain very high, with 100% of age-phase partnerships now judged good or outstanding. The split between good and outstanding varies by age-phase partnership. Joint primary and secondary ITE partnerships are most likely to be judged outstanding. Forty-four per cent of primary age-phase partnerships were judged outstanding at their most recent inspection.
Figure 18: Overall effectiveness of ITE, by age-phase partnership (number): 30 June 2020

Download a zip file with the underlying data in csv format.
Independent schools
There are around 2,350 independent schools in England. Of these, we inspect 1,100 non-association independent schools. The remaining independent schools are members of an association and are inspected by the Independent Schools Inspectorate (ISI). Of the non-association independent schools, 47% are special schools.
Figure 19: Non-association independent schools and inspections in 2019/20

Download a zip file with the underlying data in csv format.
Inspection outcomes
Most recent inspections
Overall, since August 2019, inspection outcomes for non-association independent schools have improved slightly. By 31 August 2020, 77% of schools were judged good or outstanding at their most recent inspection, compared with 75% at 31 August 2019.
Figure 20: Overall effectiveness of non-association independent schools: 31 August 2020

Download a zip file with the underlying data in csv format.
Across the 8 Ofsted regions, the number of non-association independent schools varies, from 75 in the South West to 250 in London. The regions with the highest proportion of schools judged good or outstanding at their most recent standard inspection were the North West and the West Midlands (82%), while the region with the lowest was the East of England (61%).
Figure 21: Overall effectiveness of non-association independent schools by region: 31 August 2020

Download a zip file with the underlying data in csv format.
2019/20 inspections
The EIF was introduced on 1 September 2019. We carried out around 250 standard inspections of non-association independent schools in the 2019/20 academic year. The proportion of schools judged good or outstanding in 2019/20 was 63%, slightly lower than the previous 2 years.
Figure 22: Overall effectiveness of non-association independent schools by academic year

Download a zip file with the underlying data in csv format.
The proportion of schools judged good and outstanding in the effectiveness of leadership and management judgement was closely aligned with overall effectiveness (63%). Judgements of behaviour and attitudes and personal development both had the highest proportion of schools found to be good or outstanding (86% and 81% respectively). The quality of education judgement was slightly higher than overall effectiveness, with 66% of schools judged good or outstanding (Figure 23).
Figure 23: Overall effectiveness and key judgements of non-association independent schools, 2019/20

Download a zip file with the underlying data in csv format.
Seventeen per cent of schools did not meet all the ISS at their most recent standard inspection, compared with 18% at 31 August 2019. If a school fails to meet any of the ISS, it cannot meet standards relating to the quality of leadership in and management of schools.
Table 4: Compliance with the ISS: 31 August 2020
| Met the standards (%) | Did not meet the standards (%) | |
|---|---|---|
| All standards | 83 | 17 |
| Part 1: Quality of education | 87 | 13 |
| Part 2: Spiritual, moral, social and cultural development of pupils | 94 | 6 |
| Part 3: Welfare, health and safety of pupils | 90 | 10 |
| Part 4: Suitability of staff, supply staff and proprietors | 96 | 4 |
| Part 5: Premises of and accommodation at schools | 94 | 6 |
| Part 6: Provision of information | 96 | 4 |
| Part 7: Manner in which complaints are to be handled | 98 | 2 |
| Part 8: Quality of leadership in and management of schools | 83 | 17 |
1. Includes inspections carried out by 31 August 2020 with a report published by 30 September 2020.
2. Percentages are rounded and may not add to 100.
When a school does not meet the ISS at a standard inspection, we follow up with a progress monitoring inspection (PMI). We carried out 97 PMIs in 2019/20, at which 57% failed to meet all the standards checked. This is a similar proportion to the previous 2 years.
Unregistered schools
Since the unregistered schools team was set up in January 2016, it has received 780 referrals about 740 different settings, all of which we have investigated.[footnote 59] Three hundred and fifty of the 740 investigations have resulted in on-site inspection. We have issued warning notices to 95 settings, after which 60 changed their service, for example by reducing their hours of operation or the number of children they cater for. In 4 cases, Ofsted did not have the legal powers to take further action.
Figure 24: Outcomes of investigations into possible illegal settings: 1 January 2016 to 31 August 2020

Download a zip file with the underlying data in csv format.
Since the first successful prosecution of an unregistered school in October 2018, there have been 3 further prosecutions: 2 in September 2019 and 1 in March 2020.
In the 2019/20 academic year, we opened new investigations into 120 settings. Fifty-four settings were inspected and 12 were issued with warning notices.
Further education and skills
The FES sector is mainly made up of colleges, ILPs and CLS providers. In total, the sector provides education, training and apprenticeships to around 2.9 million learners aged 16 and over every year.[footnote 60]
The sector offers a broad range of courses, relating to employment, social integration, community support, and improved health and well-being as well as qualifications that give access to further study. The type and quality of the provision are important both in meeting the needs of individuals and in meeting the needs of society and supporting the economy.
On 31 August 2020, there were almost 1,900 FES providers publicly funded and delivering education, training and/or apprenticeships recorded on Ofsted’s systems. This is a decrease of 2% compared with 31 August 2019, but a 60% increase compared with 2017. Most of the increase relates to new ILPs providing levy-funded apprenticeships. The number of ILPs, which include employer providers, more than doubled. We are yet to see the full impact of COVID-19 on the FES sector overall. Almost all of the providers remained in Ofsted’s systems between February and August 2020.
Figure 25: Further education and skills providers, inspections and monitoring visits in 2019/20

Download a zip file with the underlying data in csv format.
ILPs represent the largest number of FES providers. General further education colleges educate by far the largest number of learners: over 1.4 million in 2019 (almost 50% of all learners).
The type of provision that FES providers offer varies. General further education colleges usually provide all types. In ILPs, apprentices account for over two-thirds of learners and in CLS providers 9 out of 10 learners are taking adult education courses. Provision for learners with high needs can potentially be offered by all FES provider types.
Table 5: Make-up of provision by provider type: 31 August 2020[footnote 61]
| Provider type | Provision type: education programmes for young people – % of learners | Provision type: adult learning programmes – % of learners | Provision type: apprenticeships – % of apprentices |
|---|---|---|---|
| General further education colleges | 33 | 53 | 15 |
| Sixth-form colleges | 89 | 9 | 2 |
| Specialist further education colleges | 51 | 34 | 15 |
| Independent specialist colleges | 23 | 75 | 1 |
| Independent learning providers | 5 | 26 | 69 |
| Community learning and skills providers | 3 | 89 | 7 |
| 16 to 19 academies | 91 | 9 | 0 |
| Higher education institutions | 15 | 8 | 77 |
1. Providers at 31 August 2020 in Ofsted’s systems.
2. Proportion of learners/apprentices based on the latest published data for 2018/19.
3. Independent learning providers include employer providers.
4. Dance and drama colleges are excluded.
5. Percentages are rounded and may not add to 100.
Source: Ofsted, Department for Education
The vast majority of FES provision is delivered by directly funded providers. However, published data shows that approximately 14% of funding was used to pay sub-contractors working on behalf of the directly funded provider.[footnote 62], [footnote 63]
In 2015, the government began a review of post-16 education and training institutions in England, which resulted in a series of structural changes such as mergers.[footnote 64] On 31 August 2015, there were just over 200 general further education colleges recorded on Ofsted’s systems. Since then, nearly 100 colleges have been through a merger. This has reduced the number of colleges we report on to nearly 170. All of these merged colleges had previously been inspected. Most of the outstanding colleges did not merge (25 out of 34). Around half of the colleges judged either good, requires improvement or inadequate went through the merger process.
Ninety-two of the general further education colleges that did not merge have been re-inspected and 72% were judged good or outstanding. We have inspected 26 of the 46 colleges that were newly formed from a merger. Sixty-five per cent (17) were judged good or outstanding, and the remaining colleges judged requires improvement. Currently, this grade profile is lower than the original profile before the mergers, but nearly half of the merged colleges are yet to be inspected.
Inspection outcomes
In September 2019, we began inspecting under the EIF. Inspections paused in March 2020 because of the COVID-19 outbreak.
Most recent inspections
Overall, 80% of FES providers have been judged good or outstanding at their most recent inspection. This is a decrease of one percentage point compared with last year.
Figure 26: Overall effectiveness of further education and skills providers: 31 August 2020

Download a zip file with the underlying data in csv format.
The proportion of ILPs judged good or outstanding declined for the fourth consecutive year. In contrast, the proportion of CLS providers judged good or outstanding continued to increase.
Good governance was one of the key areas that helped CLS providers continue to improve this year, whereas it was missing from some ILPs that were not able to improve.
In 2019/20, we saw that CLS providers had strengthened their governance arrangements, resulting in managers being challenged to make improvements to their provision. The CLS providers also focused more on the most disadvantaged members of their local communities, which enabled them to design a curriculum to better meet local needs.
In contrast, in 2019/20 we saw in some ILPs that governance was not in place or was not sufficiently challenging in holding senior leaders to account to identify the aspects of the provision that needed to be improved. We also saw leaders, managers and the governance function not moving swiftly enough to implement the recommendations made at a new provider monitoring visit. ILPs did not focus enough on working closely with employers to develop a meaningful and well-thought-out curriculum to meet the training requirements of apprentices and employers.
Figure 27: Proportion of providers judged good or outstanding for overall effectiveness at their most recent inspection, by provider type and over time

Download a zip file with the underlying data in csv format.
2019/20 inspections
Between September 2019 and August 2020, we inspected just over 200 FES providers. The last inspection was carried out in March 2020, before COVID-19 paused inspection activity. Of those inspected, 68% were judged to be good or outstanding: 14 percentage points higher than in 2018/19. This was largely due to a higher proportion of short inspections (of providers previously judged good and that remained good) this year. Last year, we carried out far fewer short inspections, because the first three-year cycle of short inspections came to an end, and we carried out a large number of new provider monitoring visits.[footnote 65] The proportion judged good or outstanding this year is similar to the 2017/18 figure of 70%.
Figure 28: Further education and skills providers’ full and short inspection outcomes, by academic year

Download a zip file with the underlying data in csv format.
Around 150 inspections in 2019/20 were full inspections. Fifty-seven per cent of providers were judged good or outstanding. All key judgements, with the exception of apprenticeships, had similar or higher proportions of good or outstanding. Providers with effectiveness judgements less than good often see positive recognition in other areas, such as behaviour and attitudes and personal development. Adult learning programmes had the highest proportion of good or outstanding judgements. These providers did really well at working with local authorities, local employment partnerships and other stakeholder groups in their areas to make sure that what they offer their learners is closely aligned to the real skills needed and employment opportunities.
Figure 29: Overall effectiveness and key judgements of further education and skills providers from full inspections, 2019/20

Download a zip file with the underlying data in csv format.
This year, we inspected for the first time 50 providers that had previously had a new provider monitoring visit. Of the providers that were judged to be making reasonable or significant progress across all themes at their new provider monitoring visit, over three-quarters were judged good at their first inspection. The 4 providers previously judged insufficient across all themes were all judged inadequate.

Table 6: Overall effectiveness at first full inspection between 1 September 2019 and 31 August 2020, by new provider monitoring visit outcomes
| New provider monitoring visit outcomes (number of providers in brackets) | Outstanding for overall effectiveness at full inspection (number) | Good for overall effectiveness at full inspection (number) | Requires improvement for overall effectiveness at full inspection (number) | Inadequate for overall effectiveness at full inspection (number) |
|---|---|---|---|---|
| Reasonable/significant progress in all themes judged (32) | 0 | 25 | 6 | 1 |
| Mixed outcomes (14) | 0 | 3 | 10 | 1 |
| Insufficient progress in all themes judged (4) | 0 | 0 | 0 | 4 |
1. Based on inspections carried out by 31 August 2020 and with the report published by 30 September 2020.
In 2019/20, the proportion of providers that received at least one insufficient progress judgement at their new provider monitoring visits increased by 4 percentage points to 24%. Compared with 2018/19, a higher proportion of new providers did not ensure that there were appropriate arrangements in place to provide effective training or learning with a clearly defined purpose.
Some of the main issues we found were:
- staff do not collect or use the results of assessments completed at the start of the programme to plan a challenging curriculum
- staff do not ensure that there is a logical sequence to the curriculum
- leaders, managers and staff do not ensure that apprentices receive their entitlement to planned on- and off-the-job training
- staff do not train apprentices to develop enough new knowledge, skills and behaviours as part of their apprenticeship, instead merely accrediting existing skills that they already have
Figure 30: New provider monitoring visit outcomes for further education and skills providers by academic year

Download a zip file with the underlying data in csv format.
Twelve safeguarding follow-up visits were made after an insufficient judgement for safeguarding at a new provider monitoring visit. Four of these found that the provider was still making insufficient progress in safeguarding. These providers receive a full inspection within 6 to 12 months of their original new provider monitoring visit, if they continue to be funded. In 2018/19, we made 18 safeguarding follow-up visits and all providers were judged to have made at least satisfactory progress.
Education, skills and work in prisons and young offender institutions
Most recent inspections
Overall, 45% of prisons and young offender institutions have been judged good or outstanding at their most recent inspection. This is a decrease of 5 percentage points compared with last year.
2019/20 inspections
Only 9 of the 32 prisons and young offender institutions we inspected this year were judged good or outstanding. Of the 13 previously judged good, 7 declined to requires improvement and 1 declined to inadequate.
Nearly two-thirds of inspections this year showed poor management of the quality of education, skills and work. In the first year of governors’ autonomy in commissioning this provision, only a third of the prisons inspected were found to deliver an appropriate curriculum to meet the needs of their prisoners.
Other areas of concern at these inspections included:
- poor attendance and punctuality at education, skills and work-related activities
- around half of prisoners did not have their newly gained skills and knowledge adequately recorded by teaching staff, and therefore these went unrecognised
- too many prisons did not offer appropriate information, advice and guidance to prisoners to support their resettlement
Figure 31: Proportion of prisons and young offender institutions that improved, declined or stayed the same at their 2019/20 inspection

Download a zip file with the underlying data in csv format.
In 2019/20, we started to carry out prison monitoring visits to contribute towards Her Majesty’s Inspectorate of Prisons’ independent reviews of progress. Since 1 September 2019, we have carried out 7 prison monitoring visits. All prisons were judged to have made insufficient progress in at least one theme, and 2 prisons were judged to be making insufficient progress across all 3 themes.

Social care
‘Social care’ is the provision of support to children in need, in care, or subject to a child protection plan.
As well as regulating and inspecting social care providers, we also inspect local authority children’s services under the ILACS programme. Across England, 151 local authority children’s services support around 400,000 children (classed as ‘children in need’) each year. More than 78,000 of these children are in care.
There are just over 3,300 social care providers, offering a variety of services including residential care, fostering and adoption. Children’s homes make up the majority of providers (over 2,500), though around 75% of all children in care live with foster carers.
Inspection outcomes
Most recent inspections
As with other areas of Ofsted’s work, regular inspections paused in March 2020 because of COVID-19, though regulatory and safeguarding activity continued. This meant that the number of inspections carried out in 2019/20 was reduced by around a third compared with 2018/19. For most provider types, this resulted in small numbers of providers receiving a full inspection. For that reason, we are not commenting on inspections carried out in 2019/20. However, we are able to comment on the overall picture for all provider types at the end of the reporting year (see Figure 32).
Figure 32: Social care provider most recent inspection outcomes: 31 August 2020

Download a zip file with the underlying data in csv format.
Overall, 83% of the 2,910 inspected social care providers were judged good or outstanding at their most recent inspection. This is a very small decrease from 84% at the end of 2019. As in previous years, residential holiday schemes for disabled children continue to perform particularly well, though only a small number of these received an inspection in 2019/20, so there has been minimal change.
One of the 3 secure training centres (STCs), Medway Secure Training Centre, closed at the end of March 2020 because government had chosen its site for its plans to develop and pilot the first secure school.[footnote 66] Plans for the secure school have been delayed during the pandemic. The remaining 2 STCs are both judged requires improvement to be good, the same as last year.
2019/20 inspections
Most social care inspection cycles align with financial, rather than academic, years. Inspection cycle lengths also vary for different provider types. As a result, the providers inspected in 2019/20 are not necessarily representative of social care providers as a whole.
Figure 33: Social care providers and inspections in 2019/20

Download a zip file with the underlying data in csv format.

In 2019/20, we carried out 78 inspections or visits to local authority children’s services, and JTAIs in a further 6 local authorities.
Figure 34: Local authority inspections and visits in 2019/20

Download a zip file with the underlying data in csv format.
Overall, half of the 151 local authority children’s services in England have now been judged to be good or outstanding. This is an increase from just over one third after each local authority’s first inspection under the single inspection framework (SIF). The percentage judged inadequate is also lower, at 14%.
Figure 35: Local authority inspection outcomes over time

Download a zip file with the underlying data in csv format.
Registrations, complaints and enforcement actions
An important part of our work, which has continued through the pandemic, is the regulation and registration of social care settings.
From 1 April to 31 August 2020, we registered 176 children’s homes and de-registered 43 (compared with 136 and 47 respectively in the same period in 2019). Overall, this resulted in a net gain of 133 children’s homes, compared with 90 in the same period in 2019.
In 2019/20, we received 960 complaints about 620 providers. This is in line with 990 in 2018/19. Of these 960 complaints, 45% were received during the first five months of the pandemic, similar to the same five-month period in 2019.
We also received 150 child protection notifications over the course of the year, in line with 2018/19. However, the number of child protection notifications received increased from April onwards; 59% were received between April to August.
Of these 1,110 complaints and notifications, 850 had one or more actions recorded by the end of August 2020. Cases can have multiple actions taken, so the table below will add up to more than 850 cases.
Table 7: Number and type of actions taken 2019/20
| Action taken | Number of actions |
|---|---|
| Provider-led investigation | 350 |
| Key line of enquiry for next inspection | 330 |
| Continued monitoring by allocated inspector | 230 |
| Monitoring visit | 84 |
| Referred to child protection team in the relevant local authority | 84 |
| Inspection brought forward | 78 |
| Compliance and enforcement action | 54 |
| Other action taken not included in other categories | 85 |
| Not for Ofsted | 31 |
| Total actions taken | 1,330 |
In the same period, we carried out the following enforcement actions:
- 51 restrictions of accommodation
- 35 suspensions of providers
- 5 cancellations of providers
Unregistered children’s homes
Alongside our regulatory work, we receive and investigate notifications about potential unregistered children’s homes. In 2019/20, we undertook 250 investigations.
Just over a third of cases are still in progress. A further third of the settings did not need to be registered; many of these were providers of semi-independent living placements and similar unregulated placements.
Around a quarter should have been registered with us. Most of these (50 settings) have been sent a ‘cease and apply’ letter, encouraging them to apply to register with Ofsted as a children’s home. Most others have ceased to operate, either after realising they had made a mistake, or because the placement was short term and has now ended.
Bibliography: Ofsted’s publications this year
A list of Ofsted publications published on GOV.UK in this Annual Report’s reporting period, 1 September 2019 to 31 August 2020.
Research and analysis
‘Inspection of local authority children’s services framework: implementation review’, 26 September 2019.
‘Exploring moving to home education in secondary schools’, 15 October 2019.
‘Initial teacher education curriculum research’, 16 October 2019.
‘Social care questionnaires 2019: what children and young people told Ofsted’, 1 November 2019.
‘Fight or flight? How “stuck” schools are overcoming isolation’, 8 January 2020.
‘The multi-agency response to child sexual abuse in the family environment’, 4 February 2020.
‘Making the cut: how schools respond when they are under financial pressure’, 21 February 2020.
‘An evaluation of the framework for inspecting local areas’ special educational needs and/or disabilities services’, 9 July 2020.
‘Annual parents’ survey’, 14 July 2020.
Commentaries
‘HMCI commentary: managing behaviour research’, 12 September 2019.
‘HMCI commentary: the initial teacher education curriculum’, 16 October 2019.
‘Social care commentary: creating the environment for excellence in residential practice’, 13 February 2020.
‘Commentary on school funding’, 19 February 2020.
‘HMCI commentary: our plans for the autumn’, 6 July 2020.
‘HMCI commentary: the future of area special educational needs and disabilities inspections’, 9 July 2020.
Blogs
Education
‘Off-rolling: an update on recent analysis’, 6 September 2019.
‘Prosecution means protection: investigating and prosecuting unregistered schools’, 20 September 2019.
‘What is peer-on-peer abuse?’, 4 October 2019.
‘“Deep diving” in small schools’, 8 October 2019.
‘What does the new education inspection framework mean for further education and skills providers?’, 30 October 2019.
‘Early reading and the education inspection framework’, 4 November 2019.
‘Our latest statistics: a first look at the EIF’, 16 December 2019.
‘Making curriculum decisions in the best interests of children’, 9 January 2020.
‘Why we do research at Ofsted’, 23 January 2020.
‘Apprenticeships and the skills gap post-Brexit’, 7 February 2020.
‘Curriculum transition extended for a year’, 13 February 2020.
‘Careers education: a mixed picture’, 6 March 2020.
‘Online education in further education and skills: learning about what works’, 15 July 2020.
‘“We’re not here to make life difficult”: our further education and skills visits’, 30 September 2020.
Social care
‘ILACS implementation review – how are our children’s services inspections working?’, 26 September 2019.
‘The Care Experienced Conference’, 4 October 2019.
‘Kinship care: what are the issues?’, 11 October 2019.
‘National Adoption Week 2019 – a time for celebration, and reflection’, 17 October 2019.
‘Christmas in care – helping children enjoy the festive period’, 19 December 2019.
‘Domestic abuse: keeping the conversation going’, 7 January 2020.
‘Ofsted’s Annual Report: highlighting some of the big issues for social care’, 23 January 2020.
‘Adoption: let’s prioritise children, whatever their needs’, 31 January 2020.
‘Dealing with risks to children outside the family home’, 6 March 2020.
‘Leadership: what are the best local authorities doing?’, 17 March 2020.
‘Foster Care Fortnight 2020 – extraordinary times need extraordinary people’, 12 May 2020.
‘Secure children’s homes – helping the most vulnerable children’, 9 June 2020.
‘Children’s social care visits: what to expect’, 20 August 2020.
‘Our regulatory work during lockdown’, 1 October 2020.
Speeches
‘Amanda Spielman launches Ofsted’s Annual Report 2018/19’, 21 January 2020.
‘Amanda Spielman speaking at the Royal Opera House’, 27 January 2020.
‘Amanda Spielman at the Annual Apprenticeship Conference 2020’, 2 March 2020.
‘Amanda Spielman at ResearchEd Birmingham 2020’, 7 March 2020.
‘ASCL annual conference’, 14 March 2020.
Correspondence (published for transparency and information)
‘School inspection update: academic year 2019 to 2020’, 5 September 2019.
National and official statistics and management information
‘Children’s social care statistics’.
‘Early years and childcare statistics’.
‘State-funded schools statistics’.
‘Initial teacher education statistics’.
‘Non-association independent schools statistics’.
‘Further education and skills statistics’.
‘Unregistered schools management information’.
For more on our data, see: ‘DataView’. Ofsted’s DataView tool shows point-in-time inspection data in simple graphs that make the data quickly and easily accessible. You can compare and contrast performance in inspections between regions, local authority areas and parliamentary constituencies. A map feature presents an alternative way to explore the data.
-
Section 8 inspections do not come under section 5 of the Education Act 2005 and do not result in an inspection grade. For more information, see the Section 8 school inspection handbook. ↩
-
Learners with high needs are defined as young people aged 16 to 25 with learning difficulties and/or disabilities who require additional support to help them progress and achieve. Learners will receive additional funding for support, typically from specialist staff providing education, health and care services. ↩
-
‘Curriculum research: assessing intent, implementation and impact’, Ofsted, December 2018. ↩
-
‘Are reading and behavior problems risk factors for each other?’, PMC, May 2015. ↩
-
‘Examining the simple view of reading with elementary school children: still simple after all these years’, SAGE journals, September 2018. ↩
-
‘Bold beginnings and the importance of Reception’, researchED, July 2018. ↩
-
‘Bold beginnings: the Reception curriculum in a sample of good and outstanding primary schools’, Ofsted, November 2018. ↩
-
The Programme for International Student Assessment (PISA) is a worldwide study by the Organisation for Economic Co-operation and Development (OECD). ↩
-
Initial teacher education inspection framework and handbook, Ofsted, June 2020. ↩
-
‘Fight or flight? How “stuck” schools are overcoming isolation’, Ofsted, January 2020. ↩
-
‘HMCI commentary: the future of area special educational needs and disabilities inspections’, Ofsted, July 2020. ↩
-
‘Children Act 1989 guidance and regulations volume 2: care planning, placement and case review’, Department for Education, March 2010. ↩
-
‘Growing up neglected: a multi-agency response to older children’, Ofsted, Care Quality Commission, and HM Inspectorate of Constabulary and Fire & Rescue Services, July 2018. ↩
-
‘The multi-agency response to children living with domestic abuse: prevent, protect and repair’, Ofsted, Care Quality Commission, HM Inspectorate of Probation and HM Inspectorate of Constabulary and Fire & Rescue Services, August 2016. ↩
-
‘An evaluation of the framework for inspecting local areas’ special educational needs and/or disabilities services’, Ofsted, July 2020. ↩
-
‘Domestic abuse: the work undertaken by Community Rehabilitation Companies (CRCs)’, Her Majesty’s Inspectorate of Probation, September 2018. ↩
-
‘Matching in foster care: making good decisions for children in care and care leavers’, Ofsted, November 2020. ↩
-
‘Inspection outcomes of the largest children’s social care providers’, Ofsted, July 2020. ↩
-
‘Assessing secondary writing: writing attainment in Year 7, No More Marking, September 2020. ↩
-
‘Briefing note: school absences and pupil achievement’, Centre for Education Policy and Equalising Opportunities, UCL Institute of Education, April 2020. ↩
-
‘Impact of school closures on the attainment gap: rapid evidence assessment’, Education Endowment Foundation, June 2020. ↩
-
‘Children doing 2.5 hours’ schoolwork a day on average’, University College London Institute of Education, 15 June 2020. ↩
-
‘Coronavirus and homeschooling in Great Britain: April to June 2020’, Office for National Statistics, July 2020. ↩
-
‘Learning during the lockdown: real-time data on children’s experiences during home learning’, Institute for Fiscal Studies, 18 May 2020. ↩
-
‘Coronavirus and homeschooling in Great Britain: April to June 2020’, Office for National Statistics, July 2020. ↩
-
‘Coronavirus and homeschooling in Great Britain: April to June 2020’, Office for National Statistics, July 2020. ↩
-
‘Children doing 2.5 hours’ schoolwork a day on average’, University College London Institute of Education, 15 June 2020. ↩
-
‘Online education in further education and skills: learning about what works’, Ofsted, July 2020. ↩
-
‘Coronavirus and home-schooling in Great Britain: April to June 2020’, Office for National Statistics, July 2020. ↩
-
‘Up to three-fifths of apprentices have lost out on work experience or learning as a result of the pandemic’, The Sutton Trust, May 2020. ↩
-
‘Attendance in education and early years settings during the coronavirus (COVID-19) outbreak’, Department for Education, July 2020. ↩
-
‘Care leavers’ well-being during the COVID-19 pandemic: key messages for leaving care workers’, Coram Voice, April 2020. ↩
-
‘Lonely children are twice as likely to be groomed online’, NSPCC, 23 April 2020. ↩
-
‘How are pupils coping during lockdown?’, SchoolDash, 27 May 2020. ↩
-
‘Coronavirus and homeschooling in Great Britain: April to June 2020’, Office for National Statistics, July 2020. ↩
-
‘Children’s social care data in England 2020’, Ofsted, July 2020. ↩
-
‘Check if you can claim for your employees’ wages through the Coronavirus Job Retention Scheme’, HM Revenue and Customs, March 2020. ↩
-
‘A quarter of childcare providers fear closure within a year’, EY Alliance, May 2020. ↩
-
‘COVID-19 series: briefing on children’s social care providers’, Ofsted, September 2020. ↩
-
The term ‘nurseries and pre-schools’ is used throughout this report to describe childcare on non-domestic premises. ↩
-
Some primary and all-through schools have Nursery classes in which they look after children aged between 2 and 4, but these are exempt from registration on the EYR. ↩
-
When we find a provider is not meeting requirements following an inspection, we send a letter to the provider detailing the outcome of the inspection and any action required to ensure continuing compliance. When there is significant non-compliance with requirements,there are enforcement measures open to Ofsted such as cancellation, prosecution or, in certain circumstances, suspension. ↩
-
It is a legal requirement for early years and childcare providers to notify us about certain events that occur in their setting. We may also receive complaints about providers. ↩
-
We have the power to cancel a childminder when they have not provided early years childcare for a continuous period of more than 3 years during which they were registered. See Section 68(3) Childcare Act 2006. ↩
-
Data from the school census of January 2020. See ‘Schools, pupils and their characteristics: January 2020’, Department for Education, June 2020. ↩
-
‘Academy transfers and funding’, Department for Education, July 2020. ↩
-
‘Special educational needs in England: academic year 2019/20’, Department for Education, July 2020. ↩
-
In total, there were 390,000 children and young people (aged 0–25 years) with an EHCP by January 2020. This figure is higher than the number of pupils with an EHCP on roll in schools because it includes those who are under and over school age. Source: ‘Education, health and care plans: reporting year 2020’, Department for Education, May 2020. ↩
-
The local area includes the local authority, clinical commissioning groups, public health, NHS England for specialist services, early years settings, schools and further education providers. ↩
-
For further information, see ‘Joint inspections of local area special educational needs or disabilities (or both) provision’, Care Quality Commission and Ofsted, March 2020. ↩
-
Dorset was inspected before local government boundary changes in April 2019 and is not included in the figures. It required a WSoA. ↩
-
For information about our interim visits and the development of a new ongoing area SEND inspection programme and framework, see ‘HMCI commentary: the future of area special educational needs and disabilities inspections’, Ofsted, July 2020. ↩
-
Dorset received a revisit before local government boundary changes in April 2019. It is not included in the figures and was deemed not to be making sufficient progress. ↩
-
Co-production is when children and young people, families and those that provide services work together to make a decision or create a service that works for them all. ↩
-
‘Initial teacher education: inspections and outcomes as at 30 June 2020’, Ofsted, August 2020. ↩
-
‘Initial teacher education framework: a report on the responses to the consultation’, Ofsted, June 2020. ↩
-
Initial teacher education inspection framework and handbook, Ofsted, June 2020. ↩
-
A small number of referrals were received before the unregistered schools team was set up and some settings may have more than one referral. ↩
-
‘Further education and skills data: FE and skills learner participation by provider, local authority, funding stream, learner and learning characteristics: 2018 to 2019’, Department for Education, November 2019. ↩
-
‘Further education and skills data: FE and skills learner participation by provider, local authority, funding stream, learner and learning characteristics: 2018 to 2019’, Department for Education, November 2019. ↩
-
‘List of declared subcontractors’, Education and Skills Funding Agency, February 2020. ↩
-
‘Post-16 education and training institutions review’, Department for Business, Innovation and Skills and Department for Education, July 2015. ↩
-
Throughout this chapter, unless stated otherwise, when we refer to new provider monitoring visits, we exclude the 12 return safeguarding visits to new providers following an insufficient judgement for safeguarding at their initial new provider monitoring visit. ↩
-
‘Review of the youth justice system in England and Wales’, Department for Education, February 2016. ↩

