Suspected and laboratory-confirmed reported norovirus outbreaks in hospitals: outbreaks occurring in weeks 40 to 44, 2014
Updated 9 January 2015

© Crown copyright 2015
This publication is licensed under the terms of the Open Government Licence v3.0 except where otherwise stated. To view this licence, visit nationalarchives.gov.uk/doc/open-government-licence/version/3 or write to the Information Policy Team, The National Archives, Kew, London TW9 4DU, or email: psi@nationalarchives.gov.uk.
Where we have identified any third party copyright information you will need to obtain permission from the copyright holders concerned.
This publication is available at https://www.gov.uk/government/publications/reported-norovirus-outbreaks-in-hospitals-suspected-and-laboratory-confirmed-outbreaks-in-2014/suspected-and-laboratory-confirmed-reported-norovirus-outbreaks-in-hospitals-outbreaks-occurring-in-weeks-40-to-44-2014
The hospital norovirus outbreak reporting scheme (HNORS) recorded 24 outbreaks occurring between weeks 40 and 44, 2014, 23 (96%) of which led to ward/bay closures or restriction to admissions. Thirteen outbreaks (54%) were recorded as laboratory confirmed due to norovirus. From week 1 (January 2014) to week 44 (week beginning 27 October 2014) 483 outbreaks have been reported. Ninety-four per cent (452) of reported outbreaks resulted in ward/bay closures or restrictions to admissions and 65% (314) were laboratory confirmed as due to norovirus.
Suspected and laboratory-confirmed reported norovirus outbreaks in hospitals, with regional breakdown: outbreaks occurring in weeks 40 to 44 of 2014
| Region/PHE Centre | Outbreaks between weeks 40-44/2014 | Total outbreaks weeks 1-44/2014 | ||||
|---|---|---|---|---|---|---|
| Outbreaks | Ward/bay closure* | Lab-confirmed | Outbreaks | Ward/bay closure* | Lab-confirmed | |
| Avon, Gloucestershire and Wiltshire | 4 | 4 | 2 | 60 | 60 | 37 |
| Bedfordshire, Hertfordshire and Northamptonshire | – | – | – | 1 – | – | – |
| Cheshire and Merseyside | – | – | – | 1 | 1 | 1 |
| Cumbria and Lancashire | – | – | – | 20 | 20 | 11 |
| Devon, Cornwall and Somerset | 6 | 6 | 5 | 57 | 56 | 33 |
| Greater Manchester | – | – | – | 15 | 14 | 4 |
| Hampshire, Isle of Wight and Dorset | 2 | 2 | 1 | 24 | 24 | 14 |
| Lincolnshire, Leicestershire, Nottinghamshire and Derbyshire | 1 | 1 | 1 | 41 | 40 | 32 |
| London | – | – | – | 7 | 7 | 5 |
| Norfolk, Suffolk, Cambridgeshire and Essex | – | – | – | – | – | – |
| North east | 4 | 3 | 1 | 53 | 45 | 35 |
| Sussex, Surrey and Kent | – | – | – | 24 | 24 | 17 |
| Thames Valley | – | – | – | 15 | 13 | 5 |
| West Midlands | 7 | 7 | 3 | 65 | 64 | 35 |
| Yorkshire and the Humber | – | – | – | 101 | 84 | 85 |
| Total | 24 | 23 | 13 | 483 | 452 | 314 |
* Note: not all outbreaks result in whole wards closures, some closures are restricted to bays only.
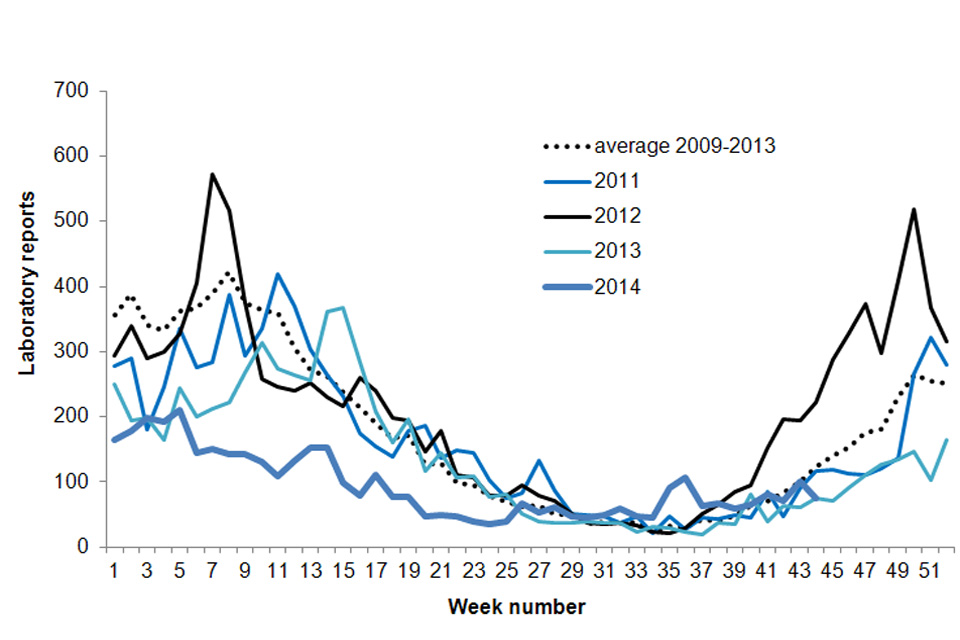
Figure 1. Current weekly norovirus laboratory reports compared to weekly average 2006 to 2010 (to week 44)
In the current season to date † (from week 27, 2014, to week 39, 2015), there were 785 laboratory reports of norovirus. This is 50% higher than the average number of laboratory reports for the same period in the seasons between 2009/2010 and 2013/2014 (523)*. The number of laboratory reports in the most recent weeks will increase as further reports are received.
† The norovirus season runs from July to June (week 27 in year 1 to week 26 in year 2) in order to capture the winter peak in one season.
Figure 2. Norovirus laboratory reports in the current season, compared with previous years (to week 44)