Superfast Broadband Programme Evaluation: Key Benefits and Impacts
Published 11 March 2025

© Crown copyright 2025
This publication is licensed under the terms of the Open Government Licence v3.0 except where otherwise stated. To view this licence, visit nationalarchives.gov.uk/doc/open-government-licence/version/3 or write to the Information Policy Team, The National Archives, Kew, London TW9 4DU, or email: psi@nationalarchives.gov.uk.
Where we have identified any third party copyright information you will need to obtain permission from the copyright holders concerned.
This publication is available at https://www.gov.uk/government/publications/superfast-broadband-programme-evaluation-benefits-and-impacts/superfast-broadband-programme-evaluation-key-benefits-and-impacts
1. Introduction to the programme
The Superfast Broadband programme was announced in 2010 in response to concerns that the commercial deployment of superfast broadband would fail to reach many parts of the UK. On the expectation that extension of superfast broadband coverage to these areas would produce economic, social and environmental benefits, the Government established the programme to fund further deployment. Building Digital UK (BDUK), an executive agency of the Department for Science, Innovation and Technology (DSIT), is the accountable body for the programme.
The scheme was initially backed by £530 million of BDUK funding, with the aim of extending superfast coverage to 90% of UK premises by December 2016 (Phase 1).
The Programme was expanded in 2015, with a further £250 million made available to extend coverage to 95% of premises by December 2017 (Phase 2). Phase 1 and Phase 2 of the Programme were funded under the State aid judgement SA.33671 (2012/N).
Phase 3 of the Superfast Broadband Programme began in 2016 and involved over £1 billion of public funding. It aimed to provide superfast broadband coverage (or faster networks) in areas where availability remained below the 95% coverage target and extend superfast coverage beyond 95% where possible. This Phase of the Programme covers contracts awarded between 2016 and 2020 and was funded under a new State aid Decision (State aid SA. 40720 (2016/N)). These projects had a greater focus on gigabit connectivity (download speeds of 1000Mbps) than those funded in prior Phases, aligning with broader Government objectives to increase Fibre to the Premises (FTTP) coverage in the UK. This evaluation found that as a consequence of this programme, the share of premises in the programme area able to access superfast speeds increased by between 41 percentage points and 47 percentage points.
2. Background to the evaluation
BDUK is committed to evaluating its programmes and has commissioned several rounds of evaluation. Ipsos UK were commissioned in 2021 to undertake an evaluation of the Superfast Broadband Programme. The final round of evaluation focussed on Phase 3 of delivery of the Superfast Broadband Programme. This summary will refer to the Programme in its entirety in addition to Phase 3 specific findings.
The evaluation of the Superfast Broadband Programme has been structured around the BDUK Evaluation and Benefits Realisation Framework, which delivers outcomes to demonstrate the impact of Government’s investment in improved digital infrastructure through BDUK.
Evaluation of the Superfast Programme’s benefits and impacts seeks to answer five key questions:
-
What are the outcomes of the programme?
-
How has the behaviour of individuals/organisations changed for these outcomes to come about?
-
How effective and efficient has the delivery of the programme been?
-
Was the investment cost effective?
-
What can we learn to improve future policy design and implementation?
To date, the Superfast Broadband Programme has been evaluated through the interim Superfast Broadband Programme Evaluation (published August 2018), the Superfast Broadband State Aid Evaluation Report and the Superfast Broadband Programme: Synthesis report. This marks the final round of evaluation for the Superfast programme.
3. Programme value for money
Cost benefit analysis was conducted for Phase 3 of the Superfast programme.
Based on its impacts between 2012 and 2021, the estimated Benefit to Cost Ratio (BCR) was between £1.76 and £4.57 per £1 of net lifetime public sector spending. This includes benefits from increased productivity and social benefits, which are outlined in further detail in the sections below and the individual technical annexes.
Allowing for future benefits to 2030, the BCR is estimated to rise to £1.87 to £4.70 per £1 of net public sector spending.
Estimated environmental benefits range from £0 to £959 million for Phase 3. Due to the range of benefits it has been excluded from the overall BCR, but if included the environmental benefits could drive the BCR to be as high as £8.01 for every £1 of public expenditure.
Despite having a higher cost than for previous Phases of the Superfast Broadband Programme, Phase 3 of the Programme still appears to be one of the most efficient Programmes supporting broadband deployment in the EU.
4. Driving growth in the economy
The programme has led to a range of national and local economic benefits in the areas that it has delivered to. Full details are available in the Superfast Broadband Programme - State Aid evaluation main report and Technical Appendix 3.
4.1 National economic impacts
The national economic impacts represent a real increase in economic activity that would not have occurred in absence of the Superfast programme at the national level. These impacts represent the cumulative benefits due to productivity gains and a reduction in long term unemployment between 2012 and 2021, whilst offsetting impacts such as the loss of jobs resulting from businesses relocating to areas with improved broadband infrastructure. These impacts are suitable for comparison against figures from the previous interim evaluation report.
At a national level, the estimated benefit of Phase 3 of the Programme is £8.4 million in productivity gains in total between 2016 and 2021, allowing for the offsetting effects.
The present value of current and future gross value added benefits (with a baseline of 2012) are estimated at £7.2 million by 2018 and between £20.8 million and £23.1 million by 2030.
4.2 Local economic impacts
The local economic impacts are defined as the economic benefits that accrue to the output areas that have received subsidised broadband coverage through the Superfast programme. It is worth bearing in mind that these figures are in part driven by firms relocating from other areas. Those areas may have experienced a loss of economic activity as a result. It has not been possible to estimate this impact as part of the evaluation.
Employment: Subsidised coverage was estimated to have increased employment in the areas benefitting from the Programme, leading to the creation of approximately 23,700 local jobs by the end of 2021.
Turnover: Subsidised coverage also increased the turnover of firms located in the areas benefitting from Phase 3 of the Programme by 1.6% , increasing the annual turnover of local businesses in Phase 3 areas by £827 per annum, and for the whole programme by 1.4%, approximately £2.6 billion per annum by 2021.
Turnover per worker:Turnover per worker of firms in the areas benefitting rose by 0.42% in response to subsidised coverage. Spatially stable firms saw their turnover per worker rise by 0.17% by 2021.
For Phase 3 contracts, the estimated impact of the programme on the turnover per worker of spatially stable firms was estimated at 0.002% per premises upgraded in Output Areas, implying an increase in turnover per worker of around £2. This gives a total effect on turnover driven by apparent efficiency gains of £63 per premises upgraded due to an average of 32 employees per output area for these spatially stable firms.
The overall effect on turnover per worker per premises upgraded was lower than estimated for prior Phases of the programme. This is likely driven by an increasing share of residential upgrades under Phase 3 of the programme.
Wages: The impacts of the Programme were also visible in wages. Employees working for firms located in the areas benefitting from subsidised coverage saw their hourly earnings increase between 0.6% and 0.8% in real terms in response to the upgrade.
Reduction in claimant count: Local job creation also appeared to translate into reduced unemployment, with the number of unemployed claimants falling by 34.3 for every 10,000 premises upgraded.
Elasticity of output: A 1% increase in broadband speed led to a 0.019% increase in GVA (Gross Value Added). For small and medium-sized enterprises, the elasticity was slightly higher at 0.26%, meaning that each 1% increase in broadband speed had a larger increase in gross value added.
Figure 1: Output elasticities by percentage for speed availability before upgrade (Mbit/s)
| Speed category before upgrade | Elasticity of output to broadband availability |
|---|---|
| 2Mbit/s | 0.018% |
| 5Mbit/s | 0.016% |
| 10Mbit/s | 0.035% |
| 30Mbit/s | 0.014% |
| 80Mbit/s | 0.007% |
Source: Ipsos analysis
Base speeds of below 10 Mbit/s were associated with elasticities of between 0.016% and 0.035%. The higher range was obtained where areas had a base speed of under 10Mbit/s but higher than 5 Mbit/s.
Estimated elasticities for upgrades above superfast were smaller and imply that improvements from superfast to ultrafast had a lower impact on output than changes from basic broadband.
5. Reducing the digital divide and providing public value
5.1 Reducing the digital divide
The digital divide is the gap between people in areas who are able to benefit from fast and reliable internet speeds and those who live in areas which cannot access these networks. This section summarises the Superfast programme’s impact on reducing the digital divide. Full details are available in the State Aid evaluation main report, Technical Appendix 1 and Technical Appendix 3.
Under Phase 3 of the Superfast Broadband Programme, 292,618 premises received subsidised coverage by September 2021.
Superfast availability: Subsidised coverage increased the share of premises in the programme area able to access superfast speeds by between 41 and 47 percentage points, and the share of premises with gigabit capable coverage by between 43 and 56 percentage points.
The impact of the programme on NGA (Next Generation Access) availability was relatively small however, indicating that in its absence, most premises would have benefitted from some form of enhanced connectivity.
Programme level additionality:The level of additionality associated with gigabit coverage was higher than for superfast availability. In this instance, additionality refers to the percentage of premises that would not have been upgraded in the absence of the programme.
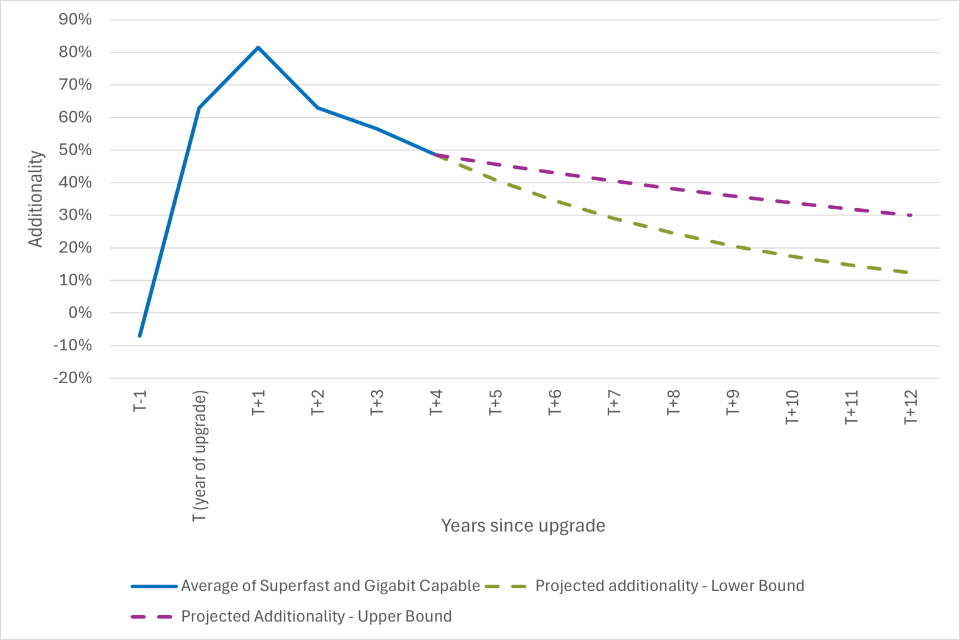
The level of additionality was estimated to peak in the year after the premises was upgraded (at 81%). Additionality was estimated to decay to 49% in the fourth-year post-installation (an average rate of decay of 16% per annum). This aligns with patterns observed for prior phases of the programme.
However, the estimated level of additionality associated with Phase 3 was notably higher than for prior Phases, indicating that the areas concerned were substantially less likely to benefit from commercial deployments without public sector support.
Figure 2: Additionality peaks at 81% a year after update and decays to 49% in the fourth-year post-installation
Source: Ipsos analysis
Superfast take-up: Subsidised coverage led to a significant increase in the maximum download speeds of connections taken by households and/or businesses by September 2021 (34 to 60 Mbit/s). However, the impacts of the programme on average download speeds were relatively small. This indicates that ‘early adopters’ have taken advantage of the enhanced broadband connectivity enabled by the Programme. However, the Programme had not led to widespread take-up of faster broadband services by September 2021.
It should be noted that most subsidised coverage was delivered in 2019 and 2020. As take-up will lag deployment, it is premature to draw any firm conclusions on the impact of the programme on take-up of faster internet services.
5.2 Providing public value
This section presents an overview of the public value the programme, through its social and wellbeing impacts.
This was measured through a longitudinal survey of households. Full details are available in the Household Survey findings.
Reported connection speed: The reported connection speed had improved at a greater rate in Superfast Broadband Programme areas than in comparator areas, with reported speeds having increased from 20 Mbps in both groups at baseline to 116 Mbps in Superfast Broadband Programme areas (compared to 63 Mbps in the comparator group).
Figure 3: Impact of the increase in connection speeds on the following aspects of life
| - | Comparator Area | Superfast Broadband Programme Area |
|---|---|---|
| Made watching entertainment and content easier | 66% | 82% |
| Made keeping in touch with friends and family easier | 54% | 66% |
| Doing things online makes things easier | 51% | 58% |
| Doing things online saves time | 49% | 55% |
Source: IPSOS analysis
The increase in connection speeds had a positive impact on the following aspects of life:
-
Made watching entertainment and content easier (82% of those in Superfast Broadband Programme areas that have upgraded felt a faster connection made it easier to watch entertainment)
-
Made keeping in touch with friends and family easier (66% of those in Superfast Broadband Programme areas that have upgraded felt a faster connection made it easier to stay in touch)
-
Doing things online makes things easier (58% of those in Superfast Broadband Programme areas that have upgraded strongly agreed with this statement)
-
Doing things online saves them time (55% of those in Superfast Broadband Programme areas that have upgraded strongly agreed with this statement)
However, nearly a quarter of households that have upgraded their connections in Superfast Broadband Programme areas also reported that they felt they were addicted to going online.
5.3 House price uplift
Findings suggested that the programme led to an average increase in house prices of between £1,900 and £4,900, suggesting that buyers were willing to pay a premium to obtain houses benefitting from subsidised upgrades. This can potentially be interpreted as a measure of the average gain in social welfare associated with access to superfast and gigabit capable broadband networks (i.e. on the basis that the maximum households are willing to pay should reflect the marginal gain in wellbeing derived from access to the technology).
5.4 Subjective wellbeing
The survey also asked residents about their overall wellbeing in both waves, as well as asking them about whether broadband specifically had improved their wellbeing in the follow-up.
The findings from these questions demonstrated that there was limited difference in the self-reported wellbeing measures between time periods and between the Superfast Broadband Programme and treatment areas. The only wellbeing questions where there appeared to be any differences were:
-
For the question around whether people felt what they do is worthwhile, where the proportion that felt what they do is worthwhile increased from 42% at the baseline to 48% in the follow-up survey (this increase was not observed in the comparator areas)
-
For the question around whether people feel lonely, the proportion of residents in Superfast Broadband Programme areas were significantly more likely to state that they ‘never’ feel lonely compared to the comparator areas in the follow-up survey (46% vs. 37%)
Statistical analysis was also undertaken on the survey results, using a difference in differences methodology to identify if the Superfast Broadband Programme had an impact on self-reported wellbeing. This analysis showed there was no detectable effect of the provision of enhanced connectivity on self-reported wellbeing using these measures. However, this may be a result of the metrics not being sufficiently sensitive to wellbeing changes from connectivity, as opposed to no actual wellbeing impact. Alternatively, the house price uplift can be used as a proxy to wellbeing, reflecting the value people place on the technology
6. Reducing impact on the environment
Previous evaluations have not included the Superfast Broadband Programme’s environmental impacts due to limited data. For the 2024 Superfast Broadband environmental impact evaluation, a range of analyses were completed to explore the potential environmental impacts of superfast broadband deployment. Full details are available in the Superfast Evaluation Synthesis Report.
Traffic levels around business parks: The analysis failed to find any significant impact between the intervention and the level of traffic on the road around business parks. This suggests that superfast broadband roll-out has not significantly reduced levels of commuting behaviour for those who work in a business park, by allowing residents to work more from home. It is possible that the nature and/or type of work undertaken at business parks may not be conducive to working from home – as such a second approach to addressing this research question was pursued.
Change in the number of people that report working from home: Data taken from the Census suggests that the rollout of superfast broadband is associated with a 9.3% increase in work from home behaviour per treated output area. However, it should be noted that the ONS recommend against comparing changes in work from home behaviour between 2011 and 2021 due to the disruption caused by the COVID-19 pandemic (and the lockdowns that were subsequently introduced).
Change in energy consumption: Energy consumption data for areas that have benefitted from the Superfast Broadband Programme was provided by the BEIS sub-national energy consumption statistics. The results suggest that receiving superfast broadband led to an increase in energy consumption.
For domestic energy consumption, the results suggest that:
-
Each additional connection in a postcode leads to an increase in domestic electricity consumption of 0.1% for an urban property; the equivalent to 0.36kWh per connection per year, and 0.04% for a rural property; equivalent to 1.27kWh per connection per year
-
Each additional connection results in a 0.02% increase in domestic gas consumption, for an urban property, equating to an additional 2.5kWh of gas consumption and 0.05% increase in domestic gas consumption, for a rural property, this is equivalent to an additional 7.3kWh
For non-domestic energy consumption such as businesses, energy consumption was estimated by Middle layer Super Output Area (MSOA). This is due to insufficient data at postcode level. A MSOA is larger than a postcode and usually comprise of between 2,000 and 6,000 households.
The results suggest that:
-
Each additional connection in a Middle layer Super Output Area (MSOA) increases non-domestic energy consumption by 0.004% (equivalent to annual increase of 0.29kWh per connection to the superfast broadband network)
-
Each additional connection made in an MSOA is associated with a 0.001% increase in non-domestic gas consumption; this is equivalent to approximately 1.68kWh of additional gas per connection to the superfast broadband network
Land use change and associated habitat disruption: Since 2015, the land use change has been lower in the comparison group compared to the treatment group (with the interventions starting in 2016), which suggests that there has been more change in land use in treatment areas than comparator areas over the course of the Programme. However, it does not fully explain the extent to which the roll out of superfast broadband caused the land use to change.
Traffic disruption: Analysis of permit records indicated that the total present value of costs in terms of greenhouse gas emissions resulting from traffic disruption was around £2.3 million (£0.3 million - £4.4 million) over a 17 year-appraisal period (2013 – 2030).
Economic value of environmental benefits: The Superfast Broadband Programme yielded an estimated value in environmental benefits totalling £3,477 million (£1,728 million - £4,554 million) over the evaluation period. This was primarily driven through reduced greenhouse gas emissions through reduced commuting, enabled by increased working from home (noting the uncertainty in the estimated impacts).
It is important to note that key environmental impacts (e.g. land use change and associated biodiversity impacts, embedded carbon in the fibre network, etc.) have not been estimated, nor monetised and so the estimated benefits present a partial view of the economic value of the associated environmental impacts.
7. Stimulating the broadband market
A rationale for intervention of the Superfast programme was a market failure of network providers to serve less densely populated areas that were deemed commercially unviable. The Superfast Programme was designed to provide an incentive effect for network providers to invest in these areas whilst at the same time minimising the amount of public subsidy required and market distortion effects. Network providers that are Superfast programme beneficiaries include: Openreach, Gigaclear, Airband, Callflow, and UK Broadband/Relish. Full details are available in the State Aid evaluation: main report.
7.1 Financial analysis
Progress with programme delivery: At the time of the evaluation, many Phase 3 contracts were yet to be completed. Much of the data on which the evaluation is based was also only available to September 2021. Just over half (52%) of the contracted number of premises to be upgraded were complete at this stage. This creates challenges in assessing the long-term additionality of the infrastructure upgrades for Phase 3 of the Programme, the effect of Phase 3 of the Programme on the market shares of beneficiaries, and the expected rate of return on the contracts awarded.
Effectiveness of contractual mechanisms: The contracts have been designed so that network providers are required to return resources to the public sector if build costs are understated or if take-up proves higher than expected (leading to higher levels of profitability). This aimed to limit the amount beneficiaries could earn excess returns on investments subsidised by the public sector. The mechanisms put in place to protect the public purse have substantially improved the value for money obtained from the Programme.
Comparisons with prior findings: The net cost per additional premises passed was by 2022/23 estimated at £1,270 for Phase 3, versus £217 for all Phases of the programme. This increase in cost was driven by a change in technical focus to gigabit capable technologies (which are more costly to deploy) and a change in spatial focus to areas that are harder to reach. Contracts awarded under Phase 3 are also expected to generate substantially lower levels of implementation and take-up clawback than contracts awarded under Phase 1 (which were often commercially viable without subsidy). Even with this being a higher cost than for previous Phases of the Superfast Broadband Programme, Phase 3 of the Programme still appears to be one of the most efficient Programmes supporting broadband deployment in the EU.
7.2 Market analysis
National market share: The market share for Openreach (including Sky and TalkTalk) across these areas declined between 2016 and 2022, from around 97% to 85% of all broadband connections. While this is higher than the national average (between 70% and 80%), the decline in market share aligns with the national trends for Openreach.
NGA connections: In terms of NGA connections, the pattern in Phase 3 areas remains the same, with a decrease in Openreach’s market share in the Phase 3 areas (91% to 82% of all NGA connections), but this is not matched by the national trends, where there is no clear pattern for Openreach’s market share.
Market share of smaller providers: The market share of smaller network providers rose faster between 2016 and 2022 in Phase 3 contract areas than nationally. Airband and Gigaclear – who have been awarded more contracts – saw larger increases in market share in the Superfast Broadband Programme delivery areas. However, the overall market share of these network providers is still relatively low, even at the local level, with no network provider having more than 5% of the total broadband market in 2022 in the areas where the Programme has delivered connections.
Figure 4: The percentage of broadband connections provided by smaller providers for Phase 3 compared to the national picture
| - | Phase 3 | National |
|---|---|---|
| 2016 | 1% | 0% |
| 2020 | 3% | 0% |
| 2022 | 9% | 1% |
Source: IPSOS analysis
8. Enabling public sector efficiency
A mixed methods approach was used to explore the effects that the Superfast Broadband Programme has had on public sector efficiency. Where secondary data was available, econometric analysis was also undertaken to explore the effect of the Programme on objective measures of public sector service performance. Full details are available in the Superfast Evaluation Synthesis report
8.1 GP practice outcomes
A statistical analysis found that the Superfast Broadband Programme had an impact in both raising awareness and usage of online services amongst patients registered with GP surgeries, in response to the provision of subsidised coverage:
Awareness of online services:
-
to book appointments rose by 9 percentage points
-
to order repeat prescriptions rose by percentage points
-
to review medical records online rose by percentage points
Usage: Usage of these services increased between 2% and 7%.
Time with GP: Subsidised coverage appeared to increase the proportion of patients that were satisfied with the amount of time given to them for their last appointment by 1 percentage point.
Access and continuity of care: However, subsidised coverage led to a reduction in the share of patients satisfied with the availability of appointments (by 4 percentage points) and the share of patients able to see their preferred GP most or all the time (by 5 percentage points). These are indicative of capacity pressures on GP surgeries receiving subsidised coverage.
Overall satisfaction with GP services: Overall, subsidised coverage appeared to reduce the share of patients that described their experience as fairly or very good by 2 percentage points.
Number of patients: Subsidised coverage increased the number of patients registered with GPs by 3.4% to 8.1% on average from 2012 to 2021.
Staffing: However, the number of staff employed by GP surgeries did not rise to the same degree.
Subsidised coverage led to an increase in the number of nursing and non-clinical staff of 5.6% to 5.7% and 5.6% to 7.6% respectively.
The number of GPs also increased by between 3.1% and 4.5% unlike in previous analysis.
These findings indicate that subsidised coverage has led to an increase in demand for primary care services (as visible in the positive effects on the number of patients registered with the GP). However, the increase in demand has not been met by an equivalent increase in the supply of primary care services.
8.2 Public services and the Covid-19 pandemic
In addition, qualitative research was undertaken in two local authority areas in the UK – Cumbria and Wolverhampton - to explore how public services adapted during the Covid-19 pandemic, and whether any changes in services had continued to be implemented since restrictions were lifted.
The two selected case study areas provided a good contrast in terms of type of area – with Wolverhampton being a very urban area with very good existing levels of broadband connectivity, whereas Cumbria has a lot of rural areas which have struggled and continue to struggle with broadband coverage.
The switch to digital solutions:
-
In Wolverhampton, there were no infrastructure challenges associated with switching to digital solutions when the Covid pandemic began. Schools and GP practices switched towards online communication for some GP consultations, (although some remained over the phone and in person), and for school lessons and homework
-
In Cumbria, the switch to digital solutions during the pandemic was more problematic. This was because there were still many premises in the area that did not have good broadband connections, therefore could not fully utilise online learning from schools or engage with GP practices online, alongside struggling to engage with other local government departments as a result of offices closing
Social and Community care: the approach to care provision in both areas did not alter much during the Covid pandemic as a result of enhanced connectivity. The major changes were around social distancing and the provision and wearing of Personal Protective Equipment.
However, in Cumbria, since the end of the pandemic, the ways in which social care is being delivered is altering. This is in part due to the increased connectivity being provided through the Superfast Broadband Programme. These are:
-
An increased use of online records and linking of records between services, with social workers typing up notes directly onto connected devices while visits are taking place, between visits or at home, which can then be uploaded directly onto central systems. These records are now starting to be connected to other databases, such as those at GP practices
-
Trials of automated social care visits. This includes the provision of tablet based social care visits, where a social worker will check in on a client digitally rather than in person. Additionally, in social care for older individuals, pilots have been trialled using automated and AI solutions for some clients, such as automated reminders for medication or tasks
Access in Wolverhampton:
-
Although most premises in the local authority could access decent broadband connections, due to the levels of deprivation in the area there were significant numbers of people that either could not access broadband because they could not afford the connection, or they did not possess the hardware (computers, laptops etc.) to utilise connections
-
This meant that there were many households that could not access education and health services. To increase access, the local authority, in partnership with neighbouring authorities and the local health board, provided a loan scheme for laptops and dongles to be provided to households for a month loan at a time. Households could be referred to the scheme by health and social care professionals
9. Next steps
This report is based largely on the 2024 Superfast Synthesis report, making this the final round of evaluations for the Superfast program. However, evaluation of BDUK’s large scale subsidies for fixed broadband will continue with Project Gigabit and will be available from the BDUK research portal.