Impact on households: distributional analysis to accompany Spring Statement 2025
Updated 2 April 2025

© Crown copyright 2025
This publication is licensed under the terms of the Open Government Licence v3.0 except where otherwise stated. To view this licence, visit nationalarchives.gov.uk/doc/open-government-licence/version/3 or write to the Information Policy Team, The National Archives, Kew, London TW9 4DU, or email: psi@nationalarchives.gov.uk.
Where we have identified any third party copyright information you will need to obtain permission from the copyright holders concerned.
This publication is available at https://www.gov.uk/government/publications/supporting-documents-for-spring-statement-2025/impact-on-households-distributional-analysis-to-accompany-spring-statement-2025
1. Distributional analysis of tax, welfare and public service spending decisions
This document sets out estimates of the impact of tax, welfare and public service spending decisions on household incomes, across the household income distribution. It contains the following charts:
-
Figures 1.A and 1.B illustrate the cumulative impact in 2028-29 of decisions announced from Autumn Budget 2024 onwards, including Spring Statement 2025
-
Figure 1.C shows how the overall level of welfare and public service spending received, and tax paid, is distributed across households, providing context beyond the impact of recent government policy decisions
The analysis contained in this document generally only considers measures with a direct impact on income from welfare benefits[footnote 1] , tax paid or the benefits-in-kind received through public services by UK residents. The analysis excludes the impact of business taxes, changes to regulation (including the National Living Wage), the impact of government borrowing and the impact of measures on non-UK residents (fuller details of the policy scope of the analysis are set out in Chapter 2).
The analysis also does not capture the impact of supply-side growth policies that may indirectly impact households, for example through increases in employment or higher wages.
Figures 1.A to 1.C in this document include the impact of the following Spring Statement 2025 measures that have effect in 2028-29:
-
Personal Independence Payment (PIP): Change the PIP assessment so claimants must score four points in any one activity from 2026-27
-
Personal Independence Payment: Increase capacity for processing award reviews from April 2026
-
Work Capability Assessment: Do not proceed with Autumn Statement 2023 descriptor reforms
-
Work Capability Assessment: Restart reassessments from April 2026
-
Universal Credit Health Element: Maintain at 2025-26 rate until 2029-30, reduce rate by 50% for new claimants from April 2026 and maintain until 2029-30
-
Universal Credit Standard Allowance: Increase above inflation for all claimants from April 2026, reaching CPI + 5% from April 2029, with the standard allowance expected to be worth £106 per week in 2029-30
-
Council tax: Increased flexibility for 6 local authorities and fire & police precepts in 2025-26
-
Employment Support: Invest in employment, health and skills support from 2026-27
-
Construction Skills: Funding for foundation apprenticeships, Skills Bootcamps, industry placement support, and uplifts for construction courses for learners aged 16+
All charts show the impact of government decisions in 2028-29 only, as this is the final year of Spending Review 2025 for Resource Departmental Expenditure Limits (DEL) spending, allowing HM Treasury to update this analysis in future with detailed plans following final settlements.
To estimate the distributional impact of public service spending decisions in 2028-29, this analysis assumes that spending on benefitsin-kind via public services in 2025-26 increases in line with growth in the overall Resource DEL envelope in 2028-29 (including changes to the envelope announced at Spring Statement 2025). 2025-26 is the final year for which there are detailed spending plans, as set out in Spending Review 2025, Phase 1. Including public service spending in the analysis provides a more comprehensive assessment of government decisions.
Analysis of decisions on household incomes in 2028-29
Figures 1.A and 1.B illustrate the cumulative impact in 2028-29 of decisions from Autumn Budget 2024 onwards. Both charts show the average impact on households, compared to a counterfactual in which the modelled policies and spending settlements were not introduced.
Figure 1.A shows that, on average, households in the lowest income deciles in 2028-29 will benefit the most from policy decisions as a percentage of net income and increases in tax will be concentrated on the highest income households. On average, all but the richest 10% of households will benefit as a percentage of income from policy decisions in 2028-29.
Figure 1.A Impact of decisions from Autumn Budget 2024 onwards on households in 2028-29, as a percentage of net income, by income decile
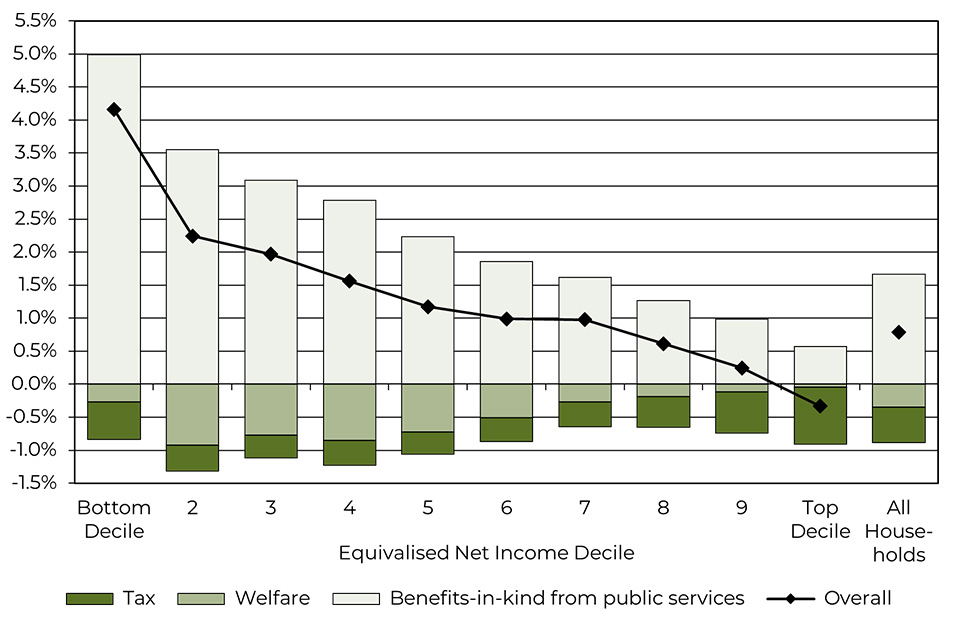
Source: HM Treasury distributional analysis model
Figure 1.B Impact of decisions from Autumn Budget 2024 onwards on households in 2028-29, in cash terms (£ per year), by income decile
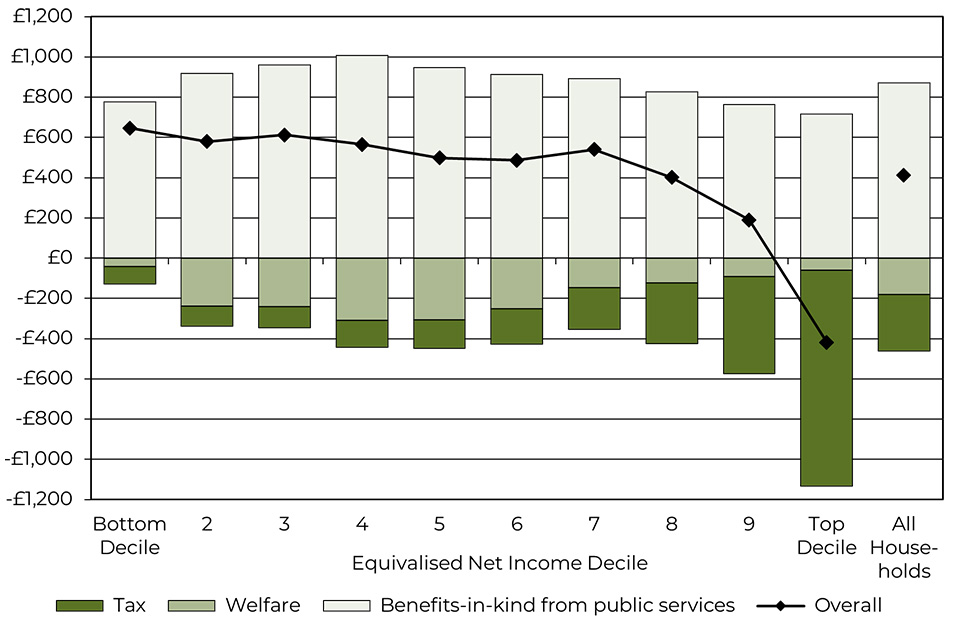
Source: HM Treasury distributional analysis model
Overall level of tax, welfare and public service spending
To provide context beyond the impact of recent government policy decisions set out in Figures 1.A and 1.B, Figure 1.C shows the estimated overall level of welfare and public service spending received, and tax paid, by households across the income distribution. This shows that government policy continues to be highly redistributive, and that in 2028-29:
-
on average, the bottom and middle of the income distribution – 60% of all households – will receive more in public spending than they contribute in tax[footnote 2]
-
on average, households in the lowest income decile will receive over four times as much in public spending than they pay in tax
Figure 1.C Overall level of public spending received, and tax paid, as a percentage of net income, by income decile, in 2028-29
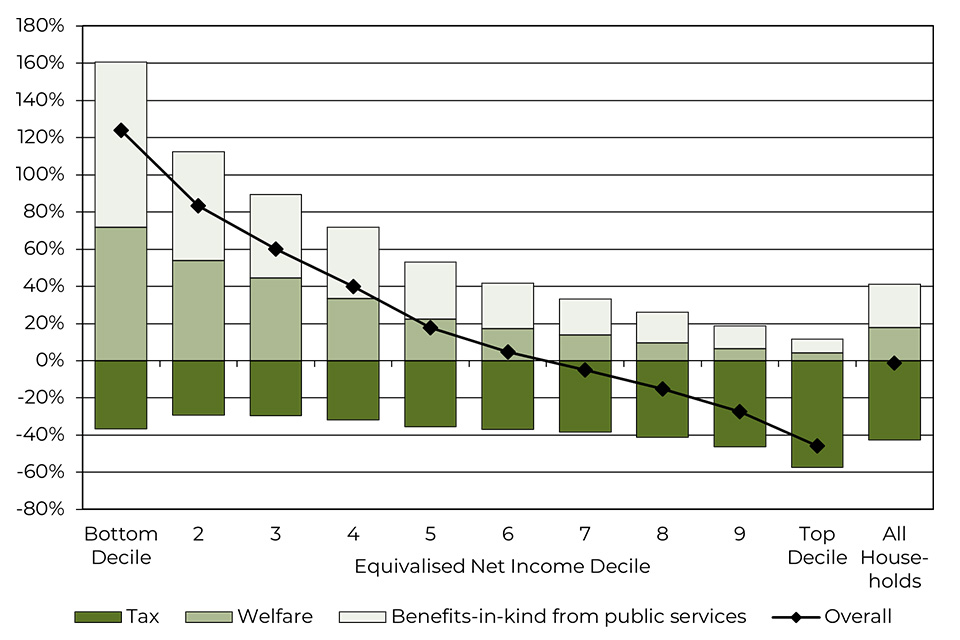
Source: HM Treasury distributional analysis model
2. Data sources and methodology
Table 2.A Data sources for charts
| Figure | Source |
|---|---|
| 1.A to 1.C | Internal HM Treasury modelling. See 2.1 to 2.28 |
Table 2.B Data sources for statistics
| Paragraph | Statistic | Source |
|---|---|---|
| 2.5 | Income movements | DWP, Income Dynamics: Movements between quintiles: 2010 to 2022, March 2024 |
| 2.6 | Expenditure distribution | Internal HM Treasury modelling |
Constructing Figures 1.A to 1.C
Policies in scope
Figures 1.A and 1.B illustrate the cumulative impact of tax, welfare and public service spending decisions announced from Autumn Budget 2024 onwards. All charts show impacts in 2028-29 and are relative to a counterfactual of no policy changes over the relevant period.
Figure 1.C shows estimates of the overall level of welfare and public service spending received, and tax paid, by households in 2028- 29 across the household income distribution. The chart accounts for those modelled measures announced from Autumn Budget 2024 onwards.
Throughout, measures are only included if they have a clear first order impact on the benefit income, tax paid, or the benefits-in-kind received through public services by UK residents. The following policy impacts are therefore outside the scope of this analysis:
-
the impact of changes to regulation, for example the National Living Wage, which are not direct changes to the distribution of tax or public spending
-
the behavioural impacts of most measures, for example where households might reduce consumption to reduce the amount of tax they might otherwise pay
-
impacts resulting from reduced fraud, error or debt in the welfare system, as full compliance with the rules of the welfare system is assumed throughout the modelling
-
impacts resulting from reduced tax non-compliance, as full compliance with the rules of the tax system is assumed throughout the modelling. Anti-avoidance measures are captured where they result in a change in tax liabilities in the year being analysed • impacts of decisions made by devolved administrations
-
impacts of taxes where the incidence of the tax does not fall directly on households, for example employer National Insurance contributions. We exclude such taxes from this analysis as we are unable to robustly determine the distributional consequences of how they could be passed through to households
-
the impact of measures without a direct impact in 2028-29
-
the impact of supply-side growth policies that may indirectly impact households, for example through increases in employment or higher wages
Additionally, smaller measures are routinely excluded from this analysis where there is insufficient data to robustly model the distributional impacts.
Defining household living standards
The analysis in this document uses household income as the measure of household living standards. While this is considered a standard approach, income may not always best represent some households’ general standard of living, as some households may finance their expenditure using wealth rather than income, or experience periods of low income temporarily (for example households containing students, the temporarily unemployed, or the self employed). The most recent analysis by the Department for Work and Pensions (DWP) has shown that, of those surveyed in 2021-22, 56% of those in the bottom quintile in 2015-16 were in a higher income quintile in 2021-22.
An alternative approach to approximating household living standards is to use household expenditure. While there is a strong correlation between income and expenditure, there are many households with both low income and high expenditure (and vice versa) – approximately 20% of households in the bottom income decile are in the top half of the expenditure distribution, for example. Due to a lack of data on expenditure in some of the datasets used in this analysis, an expenditure-based approach is not used here. However, the impact of government decisions on low-income households should be considered in the context of these methodological choices.
Defining income and ranking households
This distributional analysis uses equivalised net household income, before housing costs, as the main indicator by which to rank households from lowest income to highest income. This indicator is comprised of several components:
-
‘Equivalised’: equivalisation is a process that adjusts a household’s net income to take into account the fact that larger households will require a higher net income to achieve the same standard of living as a household with fewer members. The equivalisation factors used in the analysis are the modified OECD factors (as also used in DWP’s Households Below Average Income publication)
-
‘Net’: household incomes are ranked after deductions from direct taxes, and after additions from welfare benefits. Deductions from indirect taxes, or additions through benefits-in-kind from public services, are not used to rank households
-
‘Household’: incomes are assessed in aggregate at the household, not individual level. Comparing household, rather than individual, incomes reduces the subjectivity of this analysis, ensuring that no assumptions are made about how incomes or expenditure are shared between separate individuals within the household
-
‘Before housing costs’: housing costs such as rent or the cost of servicing a mortgage are not deducted from household incomes
The household income distribution is created by ranking households from the lowest equivalised net income to the highest equivalised net income, and then dividing this ranking into ten equally sized groups called deciles, across which the analysis is produced.
To provide an approximation of where different households might be found in the income distribution, Table 2.C below shows estimated median gross incomes (pre-tax private income including earnings, private pensions, savings and investments, plus benefit income) within each decile. This is a less precise estimate of a household’s position in the income distribution than net income, but is easier to understand because many people think about their incomes or salaries in gross rather than net terms.
For example, if a household consisting of two adults has a gross income of £33,800 per year between them, there is a high likelihood that this household will be found in the third income decile. However, this is not guaranteed, as different gross household incomes can result in different net household incomes, depending on how many earners there are in the household, the size of the household, and for which benefits the household qualifies.
Table 2.C Median gross income for each decile (£ per year, 2028-29) for different household compositions[footnote 3]
| Median gross income of households in decile | 1 adult | 1 adult and 1 child | 2 adults | 2 adults and 1 child | 2 adults and 2 children |
|---|---|---|---|---|---|
| Top decile | 98,800 | - | 139,900 | 189,800 | 246,900 |
| Ninth decile | 64,300 | - | 93,200 | 124,100 | 153,500 |
| Eighth decile | 50,800 | - | 75,200 | 98,400 | 122,500 |
| Seventh decile | 42,300 | 60,000 | 63,100 | 81,300 | 101,500 |
| Sixth decile | 36,900 | 51,400 | 54,400 | 71,500 | 85,600 |
| Fifth decile | 31,600 | 44,100 | 46,800 | 61,300 | 73,200 |
| Fourth decile | 26,600 | 34,300 | 39,800 | 51,300 | 61,800 |
| Third decile | 22,300 | 29,800 | 33,800 | 43,500 | 52,700 |
| Second decile | 18,300 | 24,100 | 28,100 | 35,300 | 42,000 |
| Bottom decile | 13,200 | 17,800 | 20,200 | 23,400 | 29,100 |
Source: HM Treasury distributional analysis model
Tax, welfare and public service spending methodology
Tax and welfare
Where possible, tax and welfare policy changes are analysed using HM Treasury’s Intra-Governmental Tax and Benefit Microsimulation model (IGOTM), which is underpinned by data from the ONS’s Living Costs and Food (LCF) survey. The sample size of the LCF means that in order to produce robust analysis three years of data have been pooled together, specifically 2017-18 to 2019-20.[footnote 4] This data is then projected forward to reflect the financial year being modelled, using historical Annual Survey of Hours and Earnings data on earnings growth at different points across the income distribution as well as the latest Office for Budget Responsibility average earnings and inflation forecasts. The model generally makes no changes to the underlying demographics, employment levels or expenditure patterns in the base data.
Not all measures can be reliably modelled using IGOTM due to data and/or modelling constraints. Tax and welfare changes that cannot be modelled using microsimulation modelling are, where possible, apportioned to household equivalised net income deciles. This is done according to the Exchequer costs or savings from the measures, applied to analysis on where the impacts are likely to fall.
Within the tax system, the main taxes microsimulated in this analysis generally include: Income Tax, employee and self-employed National Insurance contributions, Council Tax, VAT, Insurance Premium Tax, Fuel Duty, Alcohol Duty, Tobacco Duty, Stamp Duty Land Tax, and Air Passenger Duty.
Within the welfare system, the most significant welfare benefits microsimulated in this analysis generally include: the State Pension, Pension Credit, Winter Fuel Payments, Attendance Allowance, Jobseeker’s Allowance, Employment and Support Allowance, Housing Benefit, Universal Credit, Child Benefit, Disability Living Allowance, Personal Independence Payment and Tax-Free Childcare.
Not all households take up all the benefits to which they are entitled. HM Treasury’s microsimulation modelling takes this into account when calculating the effects of policy changes by using information on the take-up of benefits in the underlying survey data. This methodology provides a more accurate estimate of the impact of welfare changes on households.
Modelling of tax and welfare measures in IGOTM takes into account the devolution of decisions in some areas from the UK government to devolved administrations. UK government decisions are modelled as applying only to households directly affected by the measure, while decisions taken by the devolved administrations are not included as policy impacts.
In general, all charts in Chapter 1 assume that Universal Credit has been fully rolled out and claimants are no longer claiming benefits under the older legacy system. However, where measures relate directly to migration of legacy benefits, adjustments are made to account for these impacts.
Public service spending
The analysis of public service spending is aimed at quantifying the benefit that frontline public services provide to households. This covers services provided by the Department of Health and Social Care, the Department for Education, the Department for Work and Pensions, the Department for Transport, the Ministry of Justice, the Department for Culture, Media and Sport, and some services delivered by local government in England.
Public service spending estimates used in this analysis include the cost of providing the public services, including employment costs where relevant. This analysis excludes:
-
administrative spending
-
capital spending and the depreciation of capital assets
-
spending on public goods where it is not possible to identify the direct benefits from these areas of spending for specific households
To align with the definition of income used in DWP’s Households Below Average Income publication, the analysis of spending on public services also includes student loans. To account for this source of income, estimates of student loan outlay in a given financial year are counted as household income from public spending. Likewise, estimates of student loan repayments in that same financial year are reflected as a loss to households, again through the public spending bars.
Figures 1.A and 1.B illustrate the expected impact of changes to public service spending in 2028-29 compared to a counterfactual of planned spending at Spring Budget 2024. This analysis uses detailed spending plans for 2025-26 (as announced at Spending Review 2025, Phase 1), and assumes that spending on these benefits-in-kind via public services increases in line with growth in the overall Resource DEL envelope to 2028-29 (including changes to the envelope announced at Spring Statement 2025). This analysis provides a comprehensive assessment of government decisions by including public service spending.
Charts are presented on a UK basis, though any public service spending that is the responsibility of the devolved administrations is not reflected in this analysis. This means that any changes to devolved spending – whether positive or negative – have no impact on this analysis.
The analysis of the benefits-in-kind provided by public service spending is, as with tax and welfare measures, derived from HM Treasury’s IGOTM model. However, the modelling approach taken for public services is slightly different.
Where the use of a public service is reported in the LCF, no additional data is required and the approach is similar to that used for most tax and welfare modelling. The spending on a particular public service is allocated between all those households who are expected to use this public service, in proportion to each household’s expected use of the service.
Where information about the use of a service is not available in the LCF, additional data sources are required. This additional data is used to identify characteristics associated with the use of the service and then used to derive probabilities of service use conditional on these characteristics. The cash value spent on public services is converted into a one-for-one cash gain to households and distributed to households based on the probability that any given household uses the service.
Continuous improvements to modelling and analysis
The modelling underpinning our analysis of tax, welfare and public service spending is under continuous improvement, to enable us to provide the best estimate (subject to time, resource, and data constraints) of how households are impacted by the cumulative tax, welfare and public service spending decisions made by the government.
We also aim to capture the most comprehensive and up-to-date record of where government spending is directed to inform this analysis, noting this will continue to evolve as final departmental spending lines are decided. As such, the charts in Chapter 1 represent our best estimates of impacts at the time of publishing.
Finally, the analysis shown in our charts is based on the latest available Office for Budget Responsibility forecast. For these reasons, as well as those set out above, charts published at consecutive fiscal events are not directly comparable.
-
A list of the most significant welfare benefits microsimulated is included in paragraph 2.14. ↩
-
Households will usually move between income deciles over time, and may therefore make net contributions in some years while being net beneficiaries in other years. ↩
-
Categories with insufficient underlying sample sizes have been left blank ↩
-
More recent years (2020-21 and 2021-22) are affected by the COVID-19 pandemic and therefore not used for this analysis ↩