Temperature and dissolved oxygen trends in English estuaries: summary
Published 31 January 2025
Applies to England

© Crown copyright 2025
This publication is licensed under the terms of the Open Government Licence v3.0 except where otherwise stated. To view this licence, visit nationalarchives.gov.uk/doc/open-government-licence/version/3 or write to the Information Policy Team, The National Archives, Kew, London TW9 4DU, or email: psi@nationalarchives.gov.uk.
Where we have identified any third party copyright information you will need to obtain permission from the copyright holders concerned.
This publication is available at https://www.gov.uk/government/publications/temperature-and-dissolved-oxygen-trends-in-english-estuaries-over-the-past-30-years/temperature-and-dissolved-oxygen-trends-in-english-estuaries-summary
1. Chief Scientist’s Group report summary
In this project, Environment Agency monitoring data from English estuaries was used to determine trends in temperature and dissolved oxygen since 1990. This information can be used to infer some of the processes that have affected these parameters in estuaries, improving our awareness of what might be expected in the future.
1.1 Background
Climate change is anticipated to affect the water in English estuaries, yet there has been limited evidence on the magnitude of these changes., Fortunately, the extensive monitoring dataset collected by the Environment Agency for other purposes can be used to determine how some characteristics of estuarine water have changed over the last 30 years. This is important since the survival and functioning of aquatic species depend on the characteristics of the water they live in. Two characteristics that affect all species, either directly or indirectly, are the temperature and the amount of oxygen dissolved within the water (DO). Changes in temperature and dissolved oxygen stress some species but are helpful to others. This project provides the first overview of how temperature and DO have changed in English estuaries since 1990.
1.2 Approach
Water temperature and DO change throughout the year; a sample taken in summer will be warmer than one taken in winter, and oxygen released from photosynthesising organisms means that a sample taken in the day will have more DO than one taken at night. This variation poses an issue to determining any change from one year to the next, especially if water samples are not taken on a regular day and time each year.
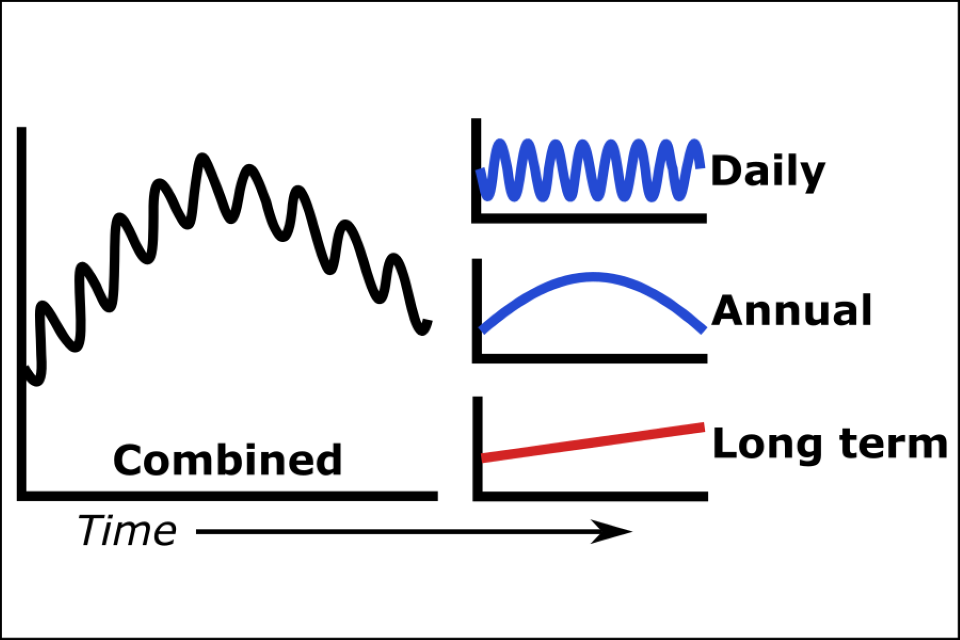
A modelling method called Generalised Additive Model (GAM, Figure 1) addresses this issue by breaking apart the different factors which might be causing temperature or DO change into separate components. This means the daily and annual components can be removed, leaving only the long-term change. Using this method, the spot sampled monitoring data from across all English estuaries was used to determine the average interannual change in temperature and DO since 1990.
Figure 1: A GAM breaks apart the combined signal into the different components, providing the long-term change.
1.3 Results
All the estuaries analysed warmed between 1990 and 2022, with an average increase of 0.037 ºC yr-1. There is considerable variation between different estuaries and across a single estuary (for example, in the Thames, warming is greater towards the riverine end of the estuary than towards the sea). The estuaries that have warmed the most are commonly adjacent to the areas of highest sea surface temperature increase over the same period.
Dissolved oxygen has increased in some estuaries and decreased in others. Three factors may explain this:
- Increases in water temperature would release oxygen dissolved in water to the air.
- Human influences on an estuary, such as a managed reduction in nutrient inputs from wastewater treatment, could increase DO. This process is typically observed in estuaries close to urban centres.
- Some biochemical reactions within the estuary itself can temporarily increase DO, for example, increased photosynthesis during periods of high algal or plant growth.
1.4 Publication details
This summary is based on a paper published in the journal Estuarine, Coastal and Shelf Science: https://www.sciencedirect.com/science/article/pii/S0272771424002804
This project was undertaken by the Environment Agency’s Chief Scientist’s Group, which provides scientific knowledge, tools and techniques to enable us to protect and manage the environment as effectively as possible.
Enquiries: research@environment-agency.gov.uk.
© Environment Agency