Trend Deck 2021: Climate change
Published 28 June 2021
1. Long term improvements in UK urban air quality
Urban background and roadside nitrogen dioxide (NO2) pollution has shown long-term improvements. In 2020, the lowest average annual mean concentrations since the start of the time series for both roadside and urban background monitoring sites were recorded. The time series began in 1987. Particulate matter (PM10 and PM2.5) show similar long-term improvements.
Urban background ozone pollution has an overall long-term increasing trend. There was, on average, no difference in the number of days of ‘moderate’ or higher pollution (including SO2) at urban pollution monitoring sites in 2020 compared with 2019. This goes against the recent trend (2015 to 2019) of an increase in days of ‘moderate’ or higher pollution at urban sites.
Annual mean concentrations of NO2 in the UK, 1990 to 2020
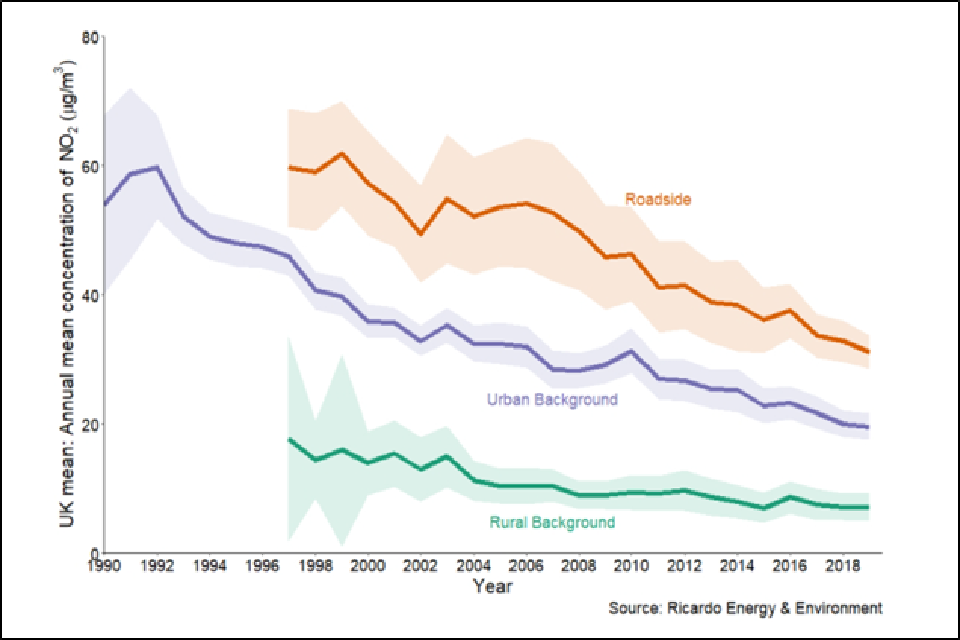
Line graph showing mean annual concentrations of nitrogen dioxide in the UK from 1990 to 2020. This shows a long-term decline in mean concentrations for roadside, urban and rural backgrounds.
Source:
- Air Quality Statistics Department for Environment, Food and Rural Affairs, April 2021
2. Global greenhouse gas emissions are increasing
Since 2010, global greenhouse gas emissions (GHG) without land use change have grown at 1.3% per year on average, with preliminary data suggesting a 1.1% increase in 2019. When including the more uncertain and variable land use change emissions, global GHG emissions have grown 1.4% per year since 2010 on average, with a more rapid increase of 2.6% in 2019 due to a large increase in vegetation forest fires.
CO2 emissions were expected to decrease by about 7% in 2020 (range: 2 to 12%) compared with 2019 emission levels due to coronavirus (COVID-19), with a smaller drop expected in GHG emissions as non-CO2 is likely to be less affected. Despite this drop atmospheric concentrations of GHGs continue to rise.
Global GHG emissions from all sources – methane (CH4), nitrogen dioxide (N2O) and fossil carbon dioxide (CO2)
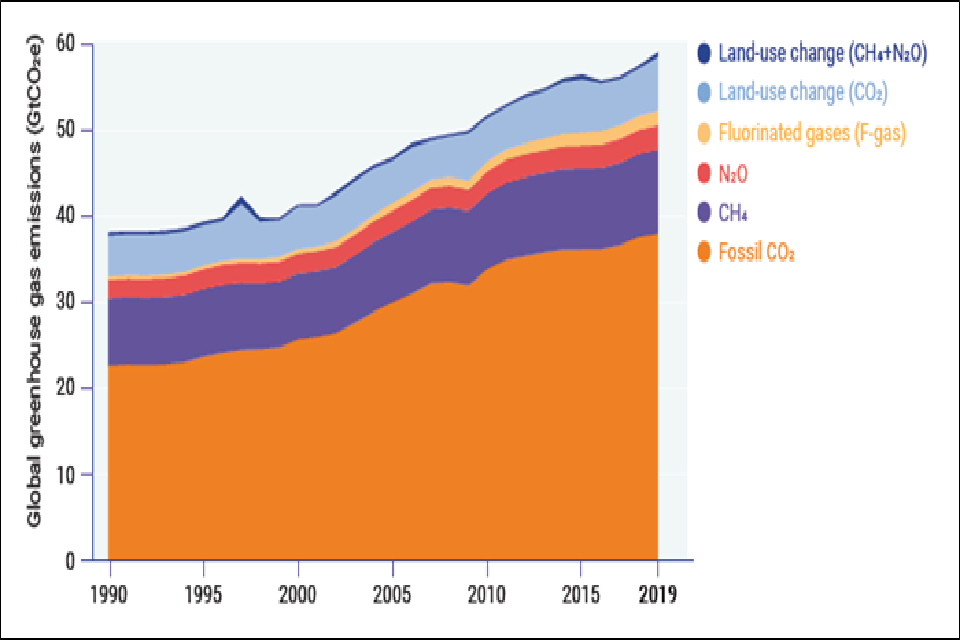
Line graph of global greenhouse gas emissions from 1990 to 2019. This shows an upward trend in emissions from land use change, fluorinated gases, nitrogen dioxide, methane and fossil carbon dioxide.
Greenhouse gases are measured in gigatonnes of carbon dioxide-equivalents (GtCO2e).
Sources:
- United Nations Environment Programme (2020). Emissions Gap Report 2020. Nairobi.
- 2019 UK greenhouse gas emissions national statistics: final summary Department for Business, Energy and Industrial Strategy
3. Increasing climate change policies and legislation
There is no country in the world that does not have at least one law or policy dealing with climate change. The most prolific countries have well over 20, and globally there are 1,800 such laws. Some of them are executive orders or policies issued by governments, others are legislative acts passed by parliament. Accounting for government effectiveness and the length of time laws have been in effect, the UK and South Korea are the most comprehensive legislators among the international forum of the G20 and Spain within the Organisation for Economic Co-operation and Development.
The ‘Climate Change Laws of the World database’ covers national level climate change legislation and policies globally
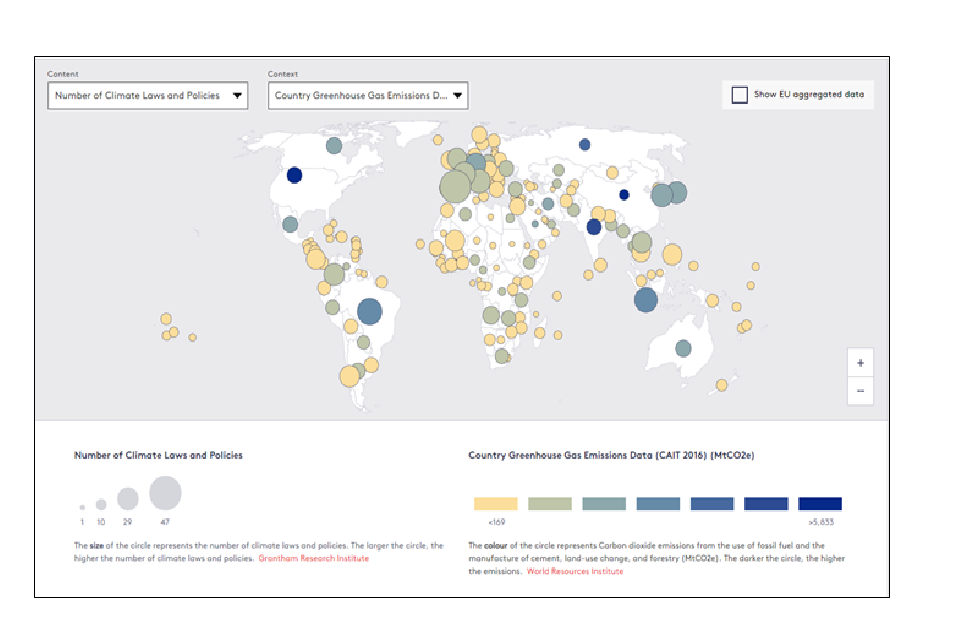
Map of the world showing climate change laws and policies. The larger the circle the more laws and policies, from 1 to 47. The darker the colour in the circle the higher the carbon dioxide emissions.
Sources:
- Global Lessons from Climate Change Legislation and Litigation Shaikh M. Eskander, Sam Fankhauser & Joana Setzer, US National Bureau of Economic Reseach working paper. June 2020.
- Climate Change Laws of the World database, Grantham Research Institute on Climate Change and the Environment and Sabin Center for Climate Change Law.
4. More countries passing net zero legislation
Sweden was the first country to pass a net zero law in 2017; in June 2019, the UK passed its net zero emissions law; France, Denmark, New Zealand and Hungary also have laws to achieve net zero emissions for 2050 and China by 2060.
The UK’s greenhouse gas emissions in 2020 were 51% below 1990 levels. This means the UK is now halfway to meeting its target of ‘net-zero’ emissions by 2050.
The UK is now halfway to net-zero greenhouse gas emissions
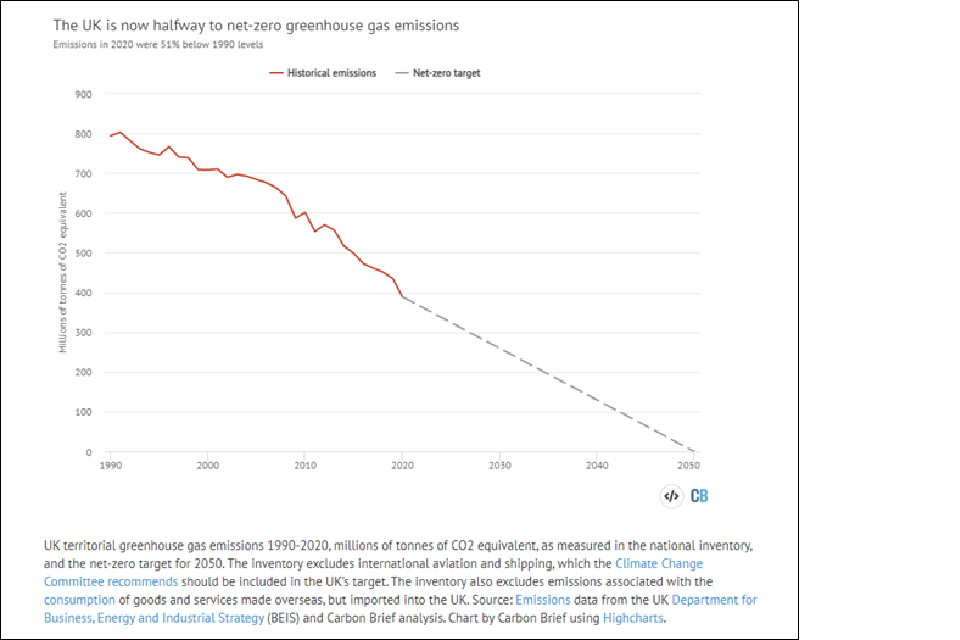
Line graph showing the decline in the emissions of millions of tonnes of carbon dioxide equivalent in the UK from 1990 to 2050. The projection shows the emissions reaching zero by 2050.
Source:
5. Global mean temperatures are rising
Global mean temperature in 2020 was the second warmest on record. The past six years, including 2020, are likely to be the six warmest years. The global mean temperature for 2020 (January to October) was 1.2 ± 0.1°C above the 1850 to 1900 baseline, used as an approximation of pre-industrial levels.
Global annual mean temperature difference from pre-industrial conditions (1850 to 1900)
The World Meteorological Organization assessment is based on five global temperature datasets. All five of those data sets place 2020 as second warmest for the year to date when compared to equivalent periods in the past (January to October).
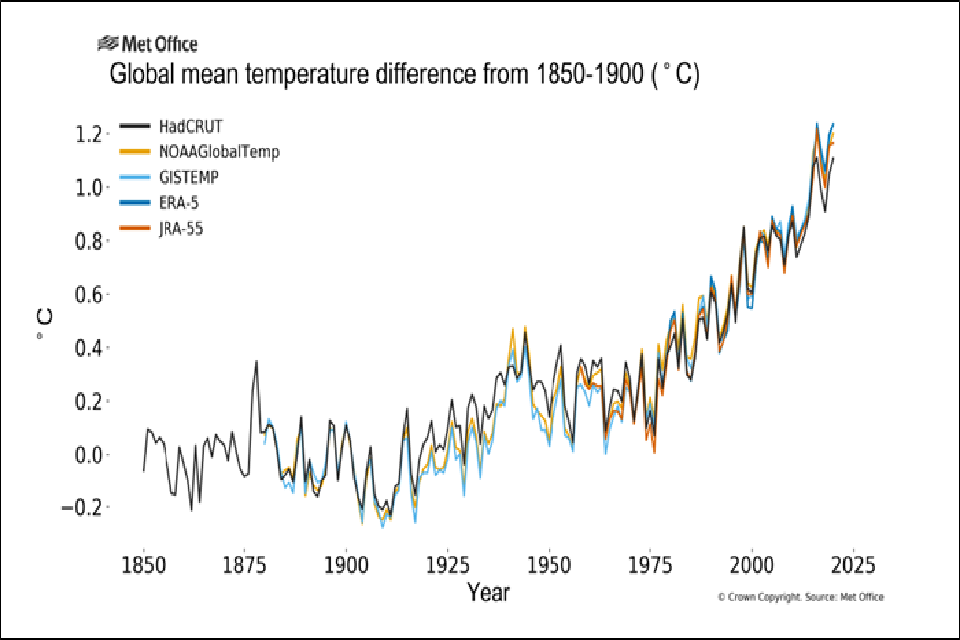
Graph with five lines of global mean temperature from -0.2 to 1.2 degrees centigrade, over the period 1850 to 2025.
Source:
- Provisional Report on the State of the Global Climate 2020 World Meteorological Organization, 2020
6. Global 2030 climate pledges are currently insufficient to limit warming to 2°C
Despite a brief dip in carbon dioxide emissions caused by the coronavirus (COVID-19) pandemic, the 2030 carbon emission reduction pledges, made by 184 countries under the Paris Agreement, aren’t enough to limit global warming to below 2°C and pursue 1.5°C. The world is still heading for a temperature rise in excess of 3°C this century.
Achieving 1.5°C would require global emissions to reduce by 7.6% every year. Even the most ambitious national climate action plans are far short of a 7.6% reduction. The world needs a five-fold increase in collective current commitments.
We are facing emission reductions so increasingly steep, it may soon be impossible to achieve 1.5°C
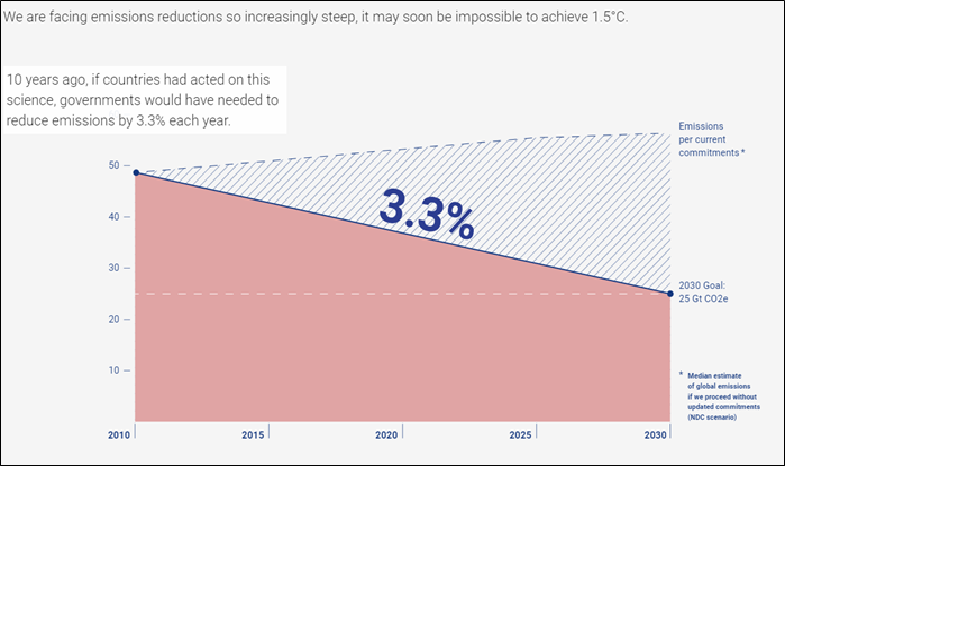
Graph of gigatonnes of CO2 equivalent from 0 to 50 between 2010 to 2050. This shows the gap in meeting the 2030 pledge to reduce CO2 emissions to below 2 degrees Celsius and the current trajectory of emissions leading to warming of over 3 degrees Celsius.
Sources:
- United Nations Environment Programme (2020). Emissions Gap Report 2020. Nairobi.
- United Nations Environnent Programme (2019). Emissions Gap Report 2019. Nairobi.
7. Average global ocean temperatures and sea levels are rising
Over 80% of the ocean area experienced at least one marine heatwave in 2020. 2019 saw the highest ocean heat content on record and the rate of warming over the past decade was higher than the long-term average, indicating continued uptake of heat from the radiative imbalance caused by greenhouse gases.
On average, since early 1993, the altimetry-based global mean rate of sea level rise amounts to 3.3 ± 0.3 mm per year. The rate has also increased over that time. A greater loss of ice mass from the ice sheets is the main cause of the accelerated rise in the global mean sea level.
Global Mean Sea Level
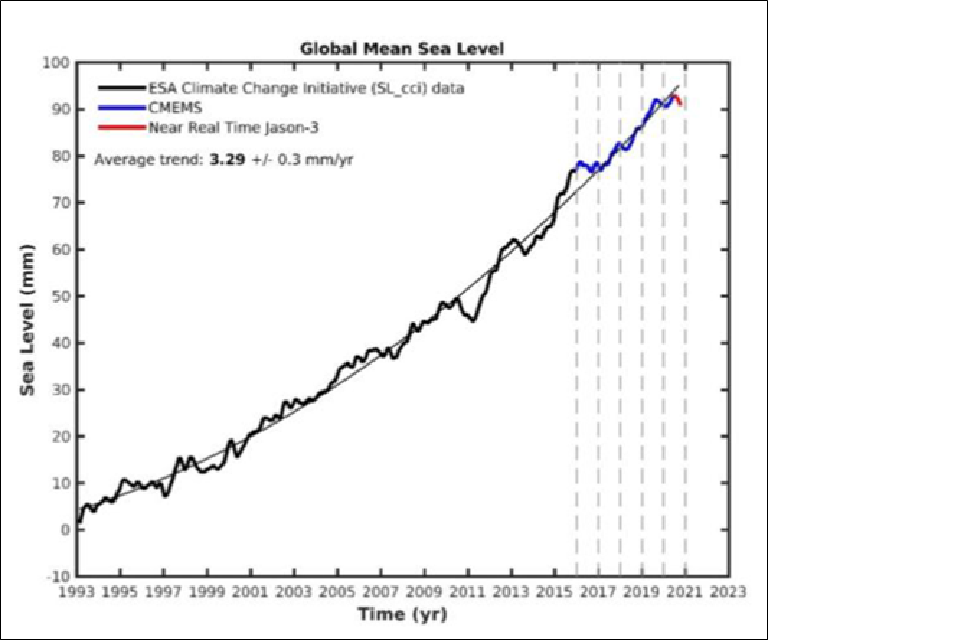
Line graph of sea level change in mm from -10 to 100 over the time period 1993 to 2023. The graph shows the increase in global mean sea level over this perioD.
Satellite altimetry-based global mean sea level for January 1993 to October 2020 (last data: 13 October 2020). Data from the European Space Agency (ESA) climate change initiative sea level project, from January 1993 to December 2015, (thick black curve); extended by the Copernicus Marine and Environment Service, CMEMS, until August 2020 (blue curve) and with near real time altimetry data from the Jason-3 mission beyond August 2020 (red curve). The thin black curve is a quadratic function that best fits the data. Vertical dashed lines mark the start of each year from 2016 to 2021.
Source:
- Provisional Report on the State of the Global Climate 2020 World Meteorological Organization, 2020
8. Increasing number of high impact climate and weather events affecting people
The most acute impacts of climate change are often felt during extreme meteorological events such as heavy rain and snow, droughts, heatwaves, cold waves, and storms. These can lead to or exacerbate other high impact events such as flooding, landslides, wildfires, and avalanches. In 2018, 61% of all internal displacements were triggered by weather-related disasters.
The achievement of many of the United Nations Sustainable Development Goals is put at risk by climate change causing high impact weather events.
Selected climate change related risks to the United Nations Sustainable Development Goals. Rising atmospheric carbon dioxide (CO2) concentrations lead to cascading effects via six of the other key climate indicators. Some of these processes also have the potential to release further greenhouse gases into the atmosphere in a feedback loop that can perpetuate warming. For example, rising temperatures can thaw permafrost releasing more carbon into the atmosphere.
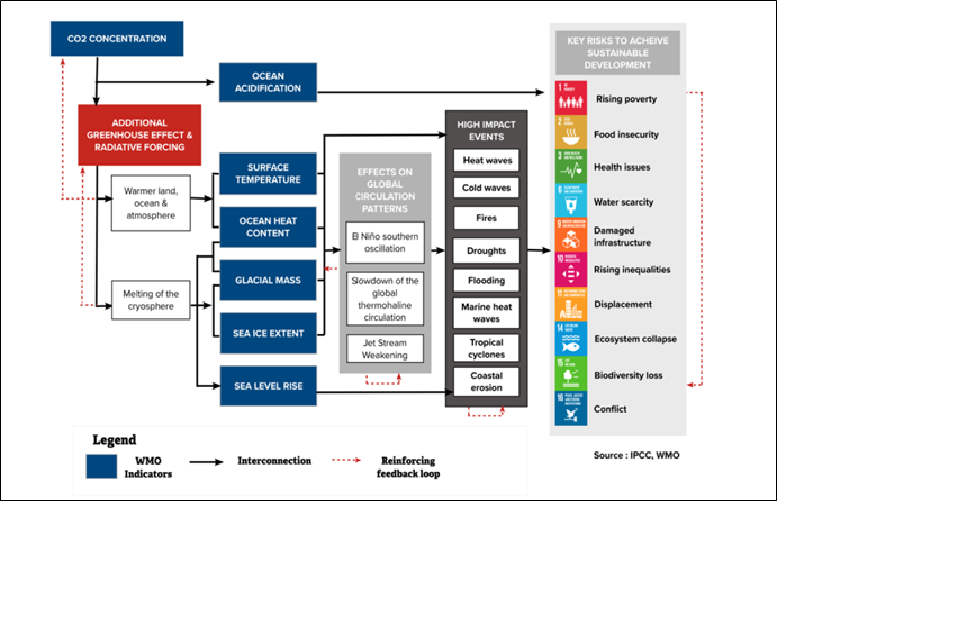
Infographic linking the effects of greenhouse gas emissions to climate indicators, global circulation patterns and high impact weather events. The high impact weather events are key risks to achieving the United Nations Sustainable Development Goals.
Sources:
- Provisional Report on the State of the Global Climate 2020 World Meteorological Organization
- Global Report on Internal Displacement 2019 Internal Displacement Monitoring Centre
9. Climate change is accelerating global biodiversity loss
Climate change is currently affecting 19% of species listed as threatened on the International Union for Nature Conservation Red List of Threatened Species, increasing the likelihood of their extinction.
Results of a synthesis of published studies in order to estimate a global mean extinction rate, suggest that extinction risks will accelerate with future global temperatures, threatening up to one in six species under current policies. Extinction risks are highest in South America, Australia, and New Zealand.
Predicted extinction rates from climate change by region and group
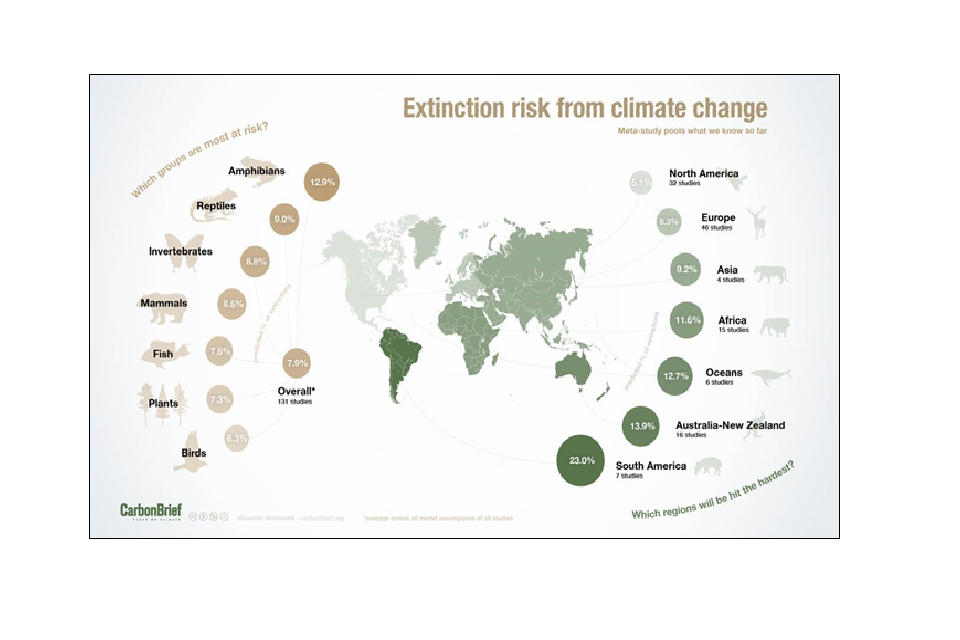
Map of the world showing which groups of species are at most risk in brown circles and which regions will be hit hardest by extinction risks in green circles. The larger and darker the circle, the greater the extinction risk.
Note: Projected extinction risks are an average across all model assumptions from 131 extinction risk studies.
Credit: Rosamund Pearce, CarbonBrief, based on data from Urban (2015).
Sources:
- Species and Climate Change Issues Brief, International Union for Nature Conservation, December 2019
- Accelerating extinction risk from climate change, Mark C. Urban Science 01 May 2015: Vol. 348,Issue 6234, pp. 571-573
- Climate change threatens one in six species with extinction study finds CarbonBrief April 2015
10. Climate change is projected to impact on food security
It has been estimated that a 2°C rise in temperatures will add 189 million more people to the 800 million already suffering from food shortages. Climate change is expected to have impacts on all four pillars of food security – food availability, access to food, food utilisation and stability of the food supply.
As well as direct impacts of extreme weather events, climate change is expected to affect foodborne pathogens, pests, global water quality and uptake of heavy metals by plants.
Experts from the World Food Programme have worked in collaboration with Met Office climate scientists to devise a Food Insecurity and Climate Change index which allows users to explore how different scenarios of global greenhouse gas emissions and adaptation to climate change could change the geography of food insecurity in developing and least-developed countries.
Food insecurity, climate change
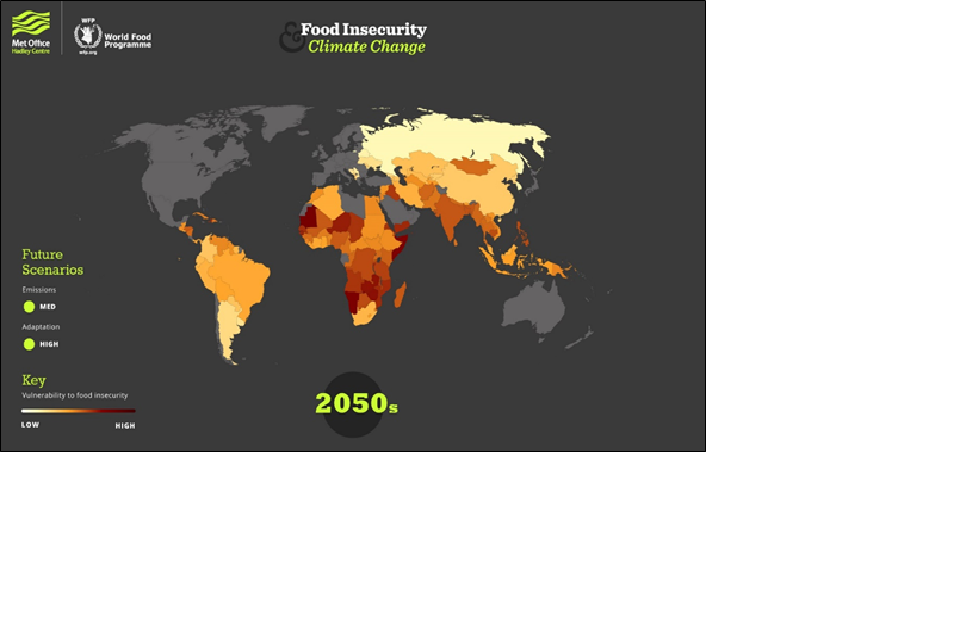
Map of the world illustrating vulnerability of countries to food insecurity. The darker the colour on the map the higher the insecurity.
Source:
- Food and Agriculture Organization (FAO). 2020. Climate Change: Unpacking the buden on food safety. Food safety and quality series No. 8. Rome.
11. Fluctuating economic and insured losses from extreme weather
Economic and insured losses resulting from extreme weather events present a major threat to global resilience. Worldwide, economic losses from natural and man-made disasters in 2019 were $146 billion, lower than $176 billion in 2018 and the previous 10-year annual average of $212 billion. The global insurance industry covered $60 billion of the losses, compared with $93 billion in 2018 and $75 billion on average in the previous 10 years.
While severe weather events were still the main driver of overall losses in 2019, amplified by socio-economic developments in affected areas and climate change effects, the decrease in losses primarily stemmed from the absence of large and costly hurricanes in the United States.
Top 10 risks over the next 10 years, Long-term risk outlook: likelihood
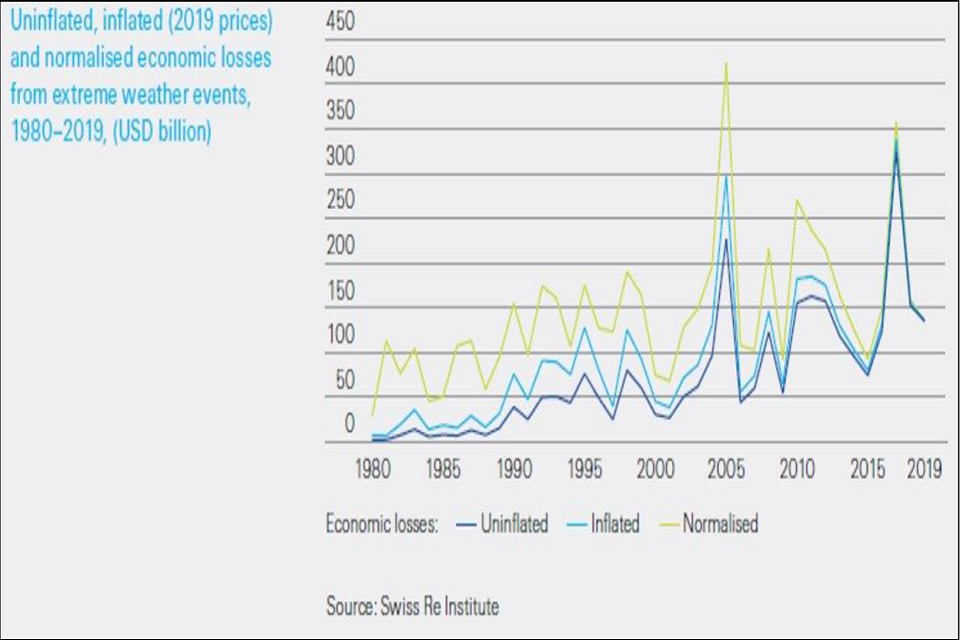
Line graph of costs in US billions of dollars from 0 to 450 over the time period 1980 to 2019. The dark blue line shows uninflated economic losses, the light blue line inflated economic losses and lime green line normalised economic losses.
To reflect that socio-economic factors change over time, Swiss Re attempted to ˝normalise” past losses resulting from weather-related events. Normalisation adjusts to show that an event in the past, if it were to occur at equal magnitude today, would cause more damage than in the year of occurrence due to value accumulation. A common approach is to apply real Gross Domestic Product and inflation factors to past economic losses. Using this approach, they estimate that the annual growth rate of normalised losses from global weather events between 1980 and 2019 was around 4%, still increasing but at much slower rate than shown by uninflated losses (10.9%) and also real (adjusted for inflation) losses (7.7%) over the same time period.
Sources:
12. Increasing industry greenhouse gas emissions
Industry related greenhouse gas (GHG) emissions have continued to increase. Global industry and waste or wastewater GHG emissions grew from 10.37 GtCO2eq (global tonnes of carbon dioxide equivalent) in 1990 to 13.04 GtCO2eq in 2005 to 15.44 GtCO2eq in 2010. These emissions are larger than the emissions from either the buildings or transport end-use sectors and represented just over 30% of global GHG emissions in 2010.
Total global industry and waste or wastewater direct and indirect GHG emissions by source, 1970 – 2010 (GtCO2eq per year) (de la Rue du Can and Price, 2008; IEA, 2012a; JRC or PBL, 2013)
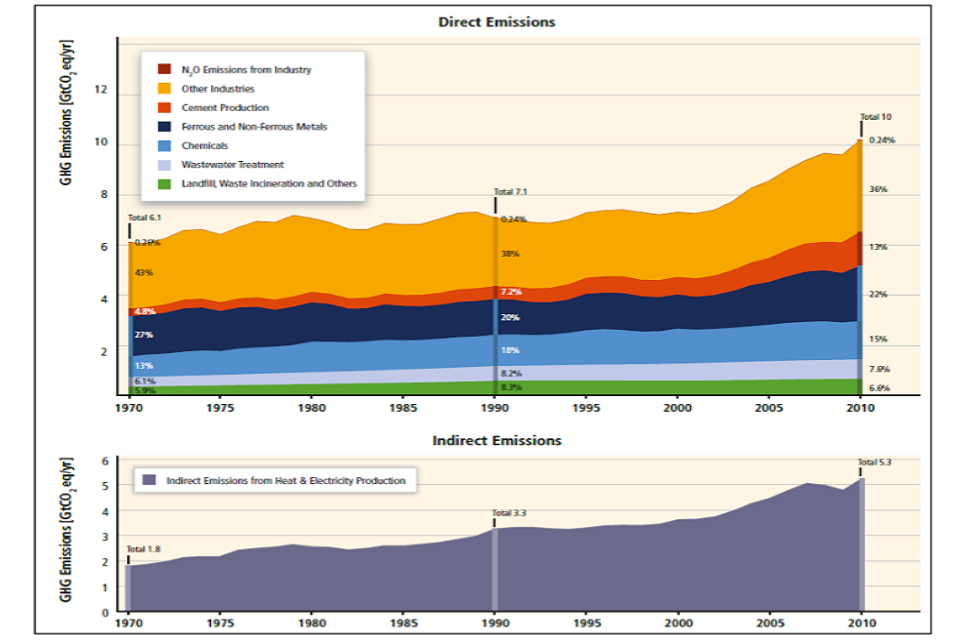
Infographics of greenhouse gas emissions (in global tonnes of carbon dioxide equivalent) over the time period 1970 to 2010. The top chart refers to direct emissions and bottom chart indirect emissions.
Source:
- Fischedick M., J. Roy, A. Abdel-Aziz, A. Acquaye, J. M. Allwood, J.-P. Ceron, Y. Geng, H. Kheshgi, A. Lanza, D. Perczyk, L. Price, E. Santalla, C. Sheinbaum, and K. Tanaka, 2014: Industry. In: Climate Change 2014: Mitigation of Climate Change. Contribution of Working Group III to the Fifth Assessment Report of the Intergovernmental Panel on Climate Change [Edenhofer, O., R. Pichs-Madruga, Y. Sokona, E. Farahani, S. Kadner, K. Seyboth, A. Adler, I. Baum, S. Brunner, P. Eickemeier, B. Kriemann, J. Savolainen, S. Schlömer, C. von Stechow, T. Zwickel and J.C. Minx (eds.)]. Cambridge University Press, Cambridge, United Kingdom and New York, NY, USA.
