UK international climate finance results 2022
Updated 19 July 2023
International Climate Finance
International Climate Finance (ICF) is Official Development Assistance (ODA) from the UK to support developing countries to reduce poverty and respond to the causes and impacts of climate change. These investments help developing countries to:
- adapt and build resilience to the current and future effects of climate change
- pursue low-carbon economic growth and development
- protect, restore and sustainably manage nature
- accelerate the clean energy transition.
Developed countries jointly committed to mobilise $100 billion per year in climate finance by 2020, to support developing countries to adapt and mitigate the impacts of climate change[footnote 1]. Estimates indicate this target was not achieved but it is now expected to be reached by 2023[footnote 2]. More broadly, the Intergovernmental Panel on Climate Change (IPCC) estimates that much greater annual investment from all sources will be needed globally for the world to transition to a low-carbon future and avoid warming exceeding 1.5°C[footnote 3].
The UK has committed to spending £11.6 billion of ICF between financial years 2021/22 and 2025/26 (the third phase of ICF, known as ‘ICF 3’). We aim to ensure a balanced split between mitigation and adaptation finance, and have committed to investing at least £3 billion of ICF in development solutions that protect and restore nature[footnote 4]. Previously, £9.8 billion was spent between 2011/12 and 2020/21. The ICF results presented in this report cover the full ICF period from 2011/12 to 2021/22.
The ICF portfolio is delivered jointly across three UK Government Departments: the Foreign Commonwealth & Development Office (FCDO); the Department for Business, Energy & Industrial Strategy (BEIS); and the Department for Environment, Food & Rural Affairs (Defra).
This publication presents the headline achievements of ICF since 2011. It brings together results against 11 key performance indicators (KPIs) from UK aid programmes that have climate change adaptation or mitigation as an objective. The ICF portfolio results framework does not attempt to capture the full benefits of ICF programmes, because individual programmes have context-specific aims that are not necessarily covered by the ICF KPIs[footnote 5]. Some programmes integrate climate as part of a broader development project, so not all their aims feed into the ICF KPIs, while others have indirect impacts that that are hard generalise across the ICF portfolio. This includes ICF programmes that deliver impact by facilitating wider benefits rather than direct intervention, such as those funding research and development, providing technical assistance, or improving governance. In some cases, our ICF results may underestimate the full breadth of ICF achievements, as some programmes have not reported all relevant KPIs due to capacity constraints or considerations of proportionality or value for money.
Climate change
The United Nations (UN) has warned that “the world is on the brink of a climate catastrophe, and the window to avert it is closing rapidly”[footnote 6]. In 2021, the global mean temperature was about 1.1°C above the pre-industrial level, making it one of the warmest years on record. To limit warming to 1.5°C, as set out in the Paris Agreement, requires a 43% decrease in global greenhouse gas emissions by 2030, and the achievement of net-zero global greenhouse gas emissions by 2050[footnote 7].
The latest assessment from the Intergovernmental Panel on Climate Change (IPCC) sets out how human-induced climate change is already having devastating impacts globally[footnote 8], and yet greenhouse gas emissions have continued to rise between 2010 and 20197. In 2022, Europe has experienced its worst drought in 500 years with records set across the continent including in the UK, causing widespread disruption and economic damage. China has had its most severe heatwave on record affecting 900m people across half its landmass. We’ve seen devastating flooding in Pakistan affecting a third of the country. The impacts of climate change extend across the Sustainable Development Goals (SDGs), with increased extreme weather events already driving mass mortalities in plant and animal species. The IPCC report emphasises the interdependence of climate, ecosystems and biodiversity, and human society, and the need for an integrated approach across these areas to solve the challenges we face. The mutually reinforcing crises of rapid climate change and unprecedented biodiversity loss are a key threat to global security and prosperity. Every year the window for action gets smaller, while the risks we face increase and become more complex. Climate change and biodiversity loss are closely linked: we cannot reach net zero or limit global temperature rises to 1.5 degrees without protecting and restoring ecosystems and managing the land and the ocean more sustainably. Therefore, improvements in agriculture, protecting and restoring nature and using land and the ocean sustainably are central to efforts to tackle and adapt to climate change, build resilience against wider shocks and to protect the global economy. By 2030, climate change and environmental degradation could push a further 100 million into poverty[footnote 9]. Millions of people are increasingly exposed to food and water insecurity, but it is the poorest and most vulnerable who are hit first, hardest and who are least able to cope[footnote 10].
While the IPCC assessment stressed the severity of the situation, it also outlines how it is still possible to achieve the necessary emissions reductions to keep global warming to 1.5°C[footnote 11]. Every 0.1°C of warming avoided will improve our chances of limiting climate catastrophe. Major transitions will be required in the energy sector to reduce our dependence on fossil fuels. Improvements in urban design and transport will be required to reduce energy consumption. More efficient use and recycling of resources in industry will be important to reduce greenhouse gas emissions. Substantial progress was made at the United Nations Climate Change Conference (COP26), hosted by the UK in 2021, which included:
- securing net zero commitments for over 90% of the world’s economy - up from 30% two years ago, when the UK began preparations for COP26.
- the Glasgow Climate Pact was agreed, which set out ambitious commitments to increase action on climate change[footnote 12] including phasing down coal and ending inefficient fossil fuel subsidies for the first time
- increased support to developing countries, including at least doubling adaptation finance to $40 billion per year by 2025
- leaders representing over 90% of the world’s forests pledged to halt and reverse forest loss and land degradation by 2030
The combination of net zero targets, enhanced 2030 emissions reduction commitments, protecting and restoring nature and global collaboration in key sectors can put the world on track to keep global warming below 2°C, provided there is concerted and dedicated delivery by all countries. However, increased action is needed to keep us to the lower 1.5°C limit set out in the Paris Agreement[footnote 13].
ICF Results 2021/22
Improvements to the publication for 2022
As we start to collect results from the third phase of ICF, improvements are being made to the breadth and depth of the reported results to enhance the publication’s usefulness and transparency:
- results against five additional KPIs are included. The number of programmes reporting against each KPI is provided for context
- graphs illustrating trends over time are included
- where the data are available, we show the categories that make up the headline results against each KPI. For example, for indicators that count people, disaggregated results show how we are reaching those who may be more vulnerable because of their sex, age, disability, or where they live
- we have included a list of all the ICF programmes that have contributed to these results since 2011.
Total Achieved Results
Achievements from ICF investments are reported for 11 KPIs[footnote 14]. Two-hundred-and-seventy-nine programmes have reported ICF results since 2011. Many of these programmes will continue to deliver further benefits after they have ended (see Annex).
The total cumulative results achieved for each KPI between April 2011 and March 2022 are shown in Table 1.
The KPIs are described in more detail in the sections below, alongside further data on their performance. The underlying methodologies can be found on the gov.uk website, as well as last year’s results publication[footnote 15]. Where the UK co-funds a programme with other donors, only ‘UK-attributed’ ICF results are included, in proportion to the UK’s donor share. For each KPI, results are added together across all relevant programmes and over time, to give cumulative results across the whole ICF portfolio. All indicators achieved increases in the cumulative results when compared to last year’s publication.
Table 1: ICF results achieved from April 2011 to March 2022[footnote 16].
| ICF KPI | KPI Name | Total achieved |
|---|---|---|
| KPI 1 | Number of people supported to better adapt to the effects of climate change | 95,000,000 people |
| KPI 2.1 | Number of people with improved access to clean energy | 58,000,000 people |
| KPI 2.2 | Number of social institutions with improved access to clean energy | 220 institutions |
| KPI 4 | Number of people whose resilience has been improved | 31,000,000 people |
| KPI 6 | Net Change in Greenhouse Gas Emissions reduced or avoided | 68,000,000 tCO2e |
| KPI 7 | Installed capacity of clean energy | 3,300 MW |
| KPI 8 | Area where deforestation has been avoided | 410,000 hectares |
| KPI 10 | Value of ecosystem services generated or protected | £5,300,000 |
| KPI 11 | Public finance mobilised for climate change purposes | £5,700,000,000 |
| KPI 12 | Private finance mobilised for climate change purposes | £5,200,000,000 |
| KPI 15 | Extent to which ICF intervention is likely to lead to transformational change | [Scorecard breakdown in KPI 15 section] |
| KPI 17 | Area of land that has received sustainable land management practices | 910,000 hectares |
Monitoring progress on inclusion
We are pleased to be able to present some disaggregated results for the first time in this year’s publication as an important step forward in monitoring how ICF programmes are reaching the most vulnerable. Requirements to break down beneficiary counts by sex, age, disability and geography have been strengthened in recent years, but not all programmes have monitoring systems that enable this information to be collected.
In particular, it is not always possible for programmes to report the individual-level data needed to monitor progress for people characteristics across multiple categories – such as elderly disabled women in rural areas. We are continuing to improve our data systems to support better disaggregated data collection and are working towards increased coverage of disaggregated results.
To protect sensitive data where the number of programmes reporting is very low, we suppress disaggregated results with fewer than 5 reporting programmes or fewer than 20 individual beneficiaries.
Results for each Key Performance Indicator
KPI 1: Number of people supported to better adapt to the effects of climate change
This indicator tracks the number of people directly supported by UK ICF to better adapt to the impacts of climate change. Many different types of interventions contribute to improving adaptation, including improving food security, water management and preparedness against climate-related natural disasters. These interventions support the achievement of SDG target 13.1 on strengthening resilience and adaptive capacity to climate-related hazards, as well as contributing towards SDG 2 on food security and SDG 6 on access to water.
A total of 95,000,000 people were directly supported to adapt to climate change through ICF from April 2011 to March 2022, reported by 110 programmes. This was an increase of 7,500,000 (9%) from the previous year (Figure 1), with eight new programmes reporting against this indicator. These results reflect the people directly reached by UK interventions, rather than indirect benefits to the wider community.
The programmes that contributed the largest increases in results for this KPI in the last year were ‘Building Resilience in Ethiopia’, the ‘Global Risk Financing Facility’ and ‘Strengthening Ethiopia’s Adaptive Safety Net’. There were also some programmes that revised their historical results as a result of improvements to methodologies and data quality, leading to a reduction of 620,000 in historical results.
Disaggregation of the results by sex has been reported for nearly 80% of programmes. Where results are available by sex, there was a split of 48% female beneficiaries compared to 52% male. Only about 1% of results were disaggregated by age, with most beneficiaries being adults where these data were available. On disability, where the data were available, only 3% of beneficiaries were recorded as having a disability. Where the geographic disaggregation was reported, 86% of beneficiaries were in rural locations, compared to 14% urban.
Figure 1: Number of people supported to better adapt to the effects of climate change
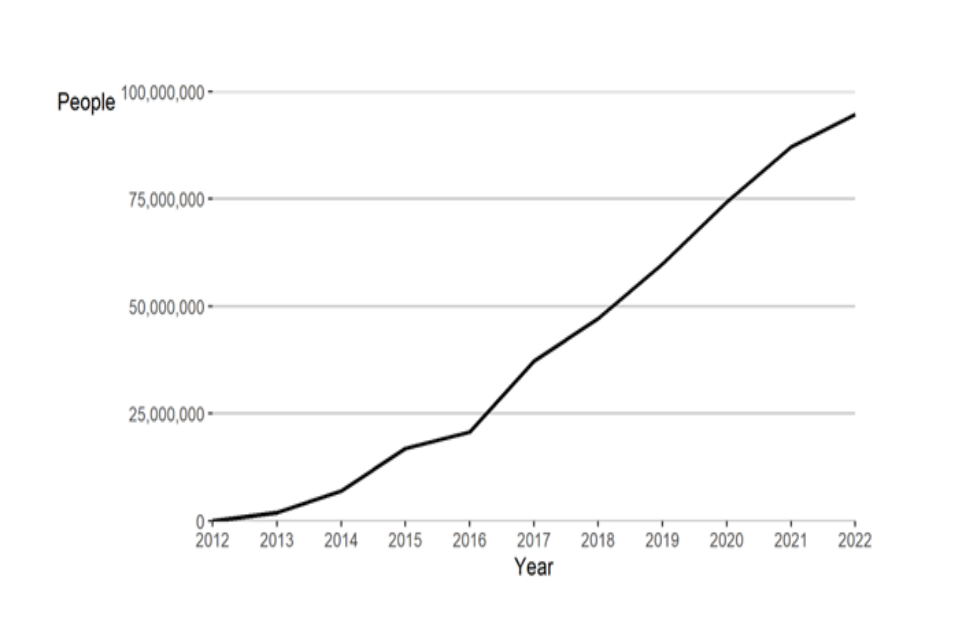
Figures 1 (KPI 1): The chart shows a near-linear, steady increase in the cumulative number of people supported to adapt to climate change from 18,000 in 2012 to 95,000,000 by 2022.
Cumulative annual results achieved for KPI 1 as a result of UK ICF, from April 2011 to March 2022. All charts in this report are based on the latest cumulative results and include any updates to historical data.
The chart shows a near-linear, steady increase in the cumulative number of people supported to adapt to climate change from 18,000 in 2012 to 95,000,000 by 2022.
Table 3: KPI 1 disaggregations for direct beneficiaries, by sex, age, disability and geography.
| Sex | Total Achieved | Number of Programmes |
|---|---|---|
| Female | 38,000,000 | 86 |
| Male | 42,000,000 | 85 |
| Unknown[footnote 17] | 14,000,000 | 55 |
| Age | ||
| Child (age 0-14) | 23,000 | <5 |
| Youth (age 15-24) | 15,000 | <5 |
| Adult (age 25-64) | 730,000 | <5 |
| Elder (age 65+) | 16,000 | <5 |
| Unknown | 94,000,000 | 105 |
| Disability | ||
| Disabled | 34,000 | 6 |
| Not disabled | 1,300,000 | 7 |
| Unknown | 94,000,000 | 105 |
| Geography | ||
| Rural | 6,200,000 | 23 |
| Urban | 980,000 | 5 |
| Unknown | 87,000,000 | 97 |
KPI 2.1: Number of people with improved access to clean energy
This indicator directly contributes to SDG 7 (affordable and clean energy), through the increased provision of clean, renewable energy options, which help to mitigate climate change through reduced carbon emissions. This also supports SDG 3 (health and wellbeing), as the use of polluting cooking fuels is a major contributor to poor health from indoor air pollution.
The types of interventions that contribute to this KPI include the installation of solar technology, green mini-grids for local power supply in rural areas, clean cookstoves that reduce people’s dependence on firewood and supporting improvements in energy efficiency.
A cumulative total of 58,000,000 people were supported with improved access to clean energy from 2011 to 2022, which was an increase of 13,000,000 (29%) since 2021 (Figure 2). There are 47 programmes reporting against this KPI, with the largest increases in achieved results coming from the programmes ‘Transforming Energy Access’, ‘Low Energy Inclusive Appliances’ and ‘Carbon Market Finance for Africa’. As well as the additional results achieved in 2021/2022, a small number of programmes made revisions to their historical results, which increased the total reported for previous years.
The results for KPI 2.1 were disaggregated by sex, age, disability and energy type. For the results where sex data were available (42%), there was a 50:50 split between male and female beneficiaries. Less than 1% of beneficiaries were disaggregated by age or disability. Geographic disaggregation was provided for 12% of the results, with 81% of beneficiaries in urban locations. Of the results where type of clean energy was reported (16%), clean electricity made up 87% and clean cooking 13%.
Figure 2: Number of people with improved access to clean energy
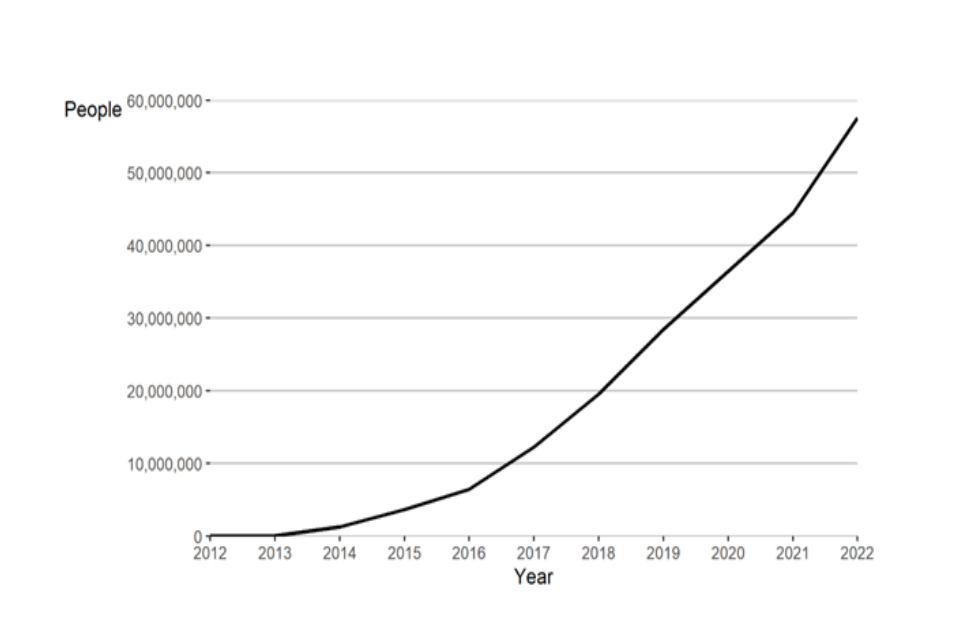
Figure 2 (KPI 2.1): Number of people supported with improved energy access over time. Results first reported in 2013 and have since increased, reaching 58,000,000 people by 2022.
Cumulative annual results achieved for KPI 2.1 as a result of UK ICF, from April 2011 to March 2022.
This chart shows the number of people supported with improved energy access over time. The first results for this KPI were reported in 2013 and have since increased although the rate of increase has been higher in later years, reaching 58,000,000 people by 2022.
Table 4: KPI 2.1 disaggregations
Data for KPI 2.1 disaggregated by sex, age, disability, geography and clean energy type.
| Sex | Total Achieved | Number of Programmes |
|---|---|---|
| Female | 12,000,000 | 24 |
| Male | 12,000,000 | 24 |
| Unknown | 33,000,000 | 33 |
| Age | ||
| Youth (age 15-24) | 11,000 | <5 |
| Adult (age 25-64) | 110,000 | <5 |
| Unknown | 57,000,000 | 45 |
| Disability | ||
| Disabled | 7,900 | <5 |
| Not disabled[footnote 18] | <20 | <5 |
| Unknown | 57,000,000 | 46 |
| Geography | ||
| Rural | 5,800,000 | 10 |
| Urban | 1,300,000 | 8 |
| Unknown | 51,000,000 | 40 |
| Clean Energy | ||
| Clean cooking | 1,200,000 | 6 |
| Clean electricity | 14,000,000 | 16 |
| Unknown | 42,000,000 | 34 |
KPI 2.2: Number of social institutions with improved access to clean energy
KPI 2.2 is similar to KPI 2.1 but focuses on social institutions[footnote 19] that have improved access to clean energy, which thereby provides benefits to the wider community. One of the biggest contributors to this KPI was the ‘Somali Health and Nutrition Programme’, which incorporated initiatives such as the installation of solar powered refrigerators and freezers in health facilities and supporting clean energy alongside healthcare access.
A total of 220 institutions have been supported with improved energy access between 2011 and 2022, through 6 programmes (Figure 3). There was an increase of 72 (47%) in the latest year, as well as an upward revision of results achieved in previous years. This was due to some programmes reporting results for previous years that had not reported previously.
Figure 3: Number of social institutions with improved access to clean energy
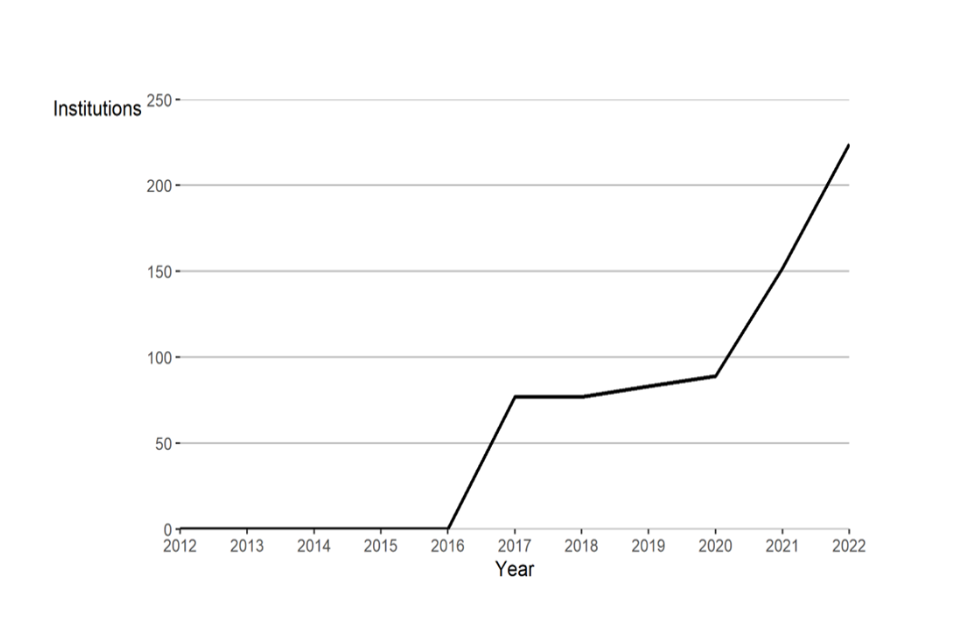
Figure 3 (KPI 2.2): 77 positive results reported in the first year. Slight increase 2017 and 2020, sharp increase from 2020 to 2022, total reached 220 institutions. Large increase because only 2 programmes were reporting this indicator before 2020.
Cumulative annual results achieved for KPI 2.2 as a result of UK ICF, from April 2011 to March 2022.
The first year that programmes reported positive results for this indicator was 2017, with 77 reported in the first year. Results slightly increased between 2017 and 2020, but there was a sharp increase from 2020 to 2022, when the total reached 220 institutions. The large increase is because only two programmes were reporting this indicator before 2020.
KPI 4: Number of people whose resilience has been improved
This indicator tracks the number of people for whom UK ICF interventions have improved their resilience to climate shocks and stresses. Programmes reporting on this indicator support the achievement of SDG target 13.1 on strengthening resilience and adaptive capacity to climate-related hazards.
Climate resilience can be considered as having three dimensions: adaptive capacity, anticipatory capacity, and absorptive capacity. ICF programmes are designed to improve climate resilience according to context-specific climate risks. Interventions may include building houses on plinths; preserving water catchments; strengthening flood defences; establishing early-warning systems and social protection. This indicator may overlap with KPI 1, as it can include helping people to adapt to climate change, but for this indicator there needs to be evidence of improved resilience across more than one dimension, supported by data before and after the programme interventions. This makes it more complicated than KPI 1, which simply reports how many people have been reached by our interventions.
Context-relevant indicators of resilience are defined across at least two dimensions of resilience for reporting against KPI 4. ‘Improvement’ on each indicator is demonstrated through repeated beneficiary surveys. These individual indicator results are combined in a predefined way to give a single result of ‘improved’ or ‘not improved’ in relation to each programme participant.
Resilience was improved for a total of 31,000,000 people across 21 ICF programmes from April 2011 to March 2022 (Figure 4). This was an increase of 8,400,000 (37%) from the previous year. The largest increase came from programme: ‘Weather and climate information and services for Africa’, reporting against this indicator for the first time.
Disaggregation by sex covers more than half of reported results on KPI 4. Where the gender of beneficiaries is known, there are 8,400,000 females and 11,000,000 males. No programmes reporting on KPI 4 included disaggregations by age. Less than 1% of KPI 4 results included disability status. Where disability status is known, there are 2,500 beneficiaries with a disability and 220,000 beneficiaries who are not disabled. Around 3% of KPI 4 results included geography. Where geography is known there are 890,000 rural beneficiaries and 12,000 urban beneficiaries.
Figure 4: Number of people whose resilience has been improved.
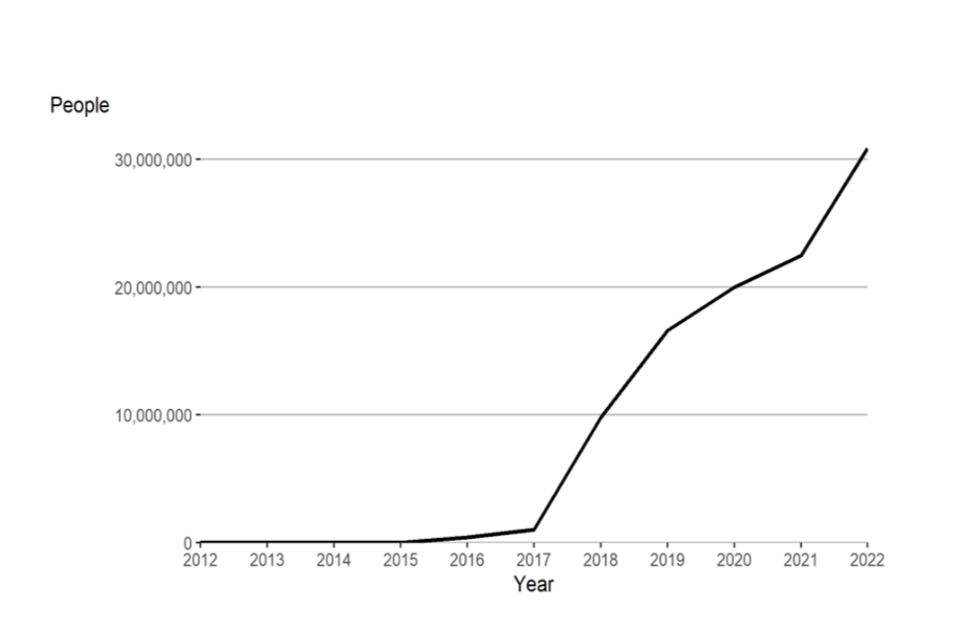
Figure 4 (KPI 4): No results reported for this KPI until 2016. For the first couple of years only small numbers were reported, but this rapidly increased after 2017, rising to 31,000,000 by 2022
Cumulative annual results achieved for KPI 4 as a result of UK ICF, from April 2011 to March 2022.
There were no results reported for this KPI until 2016. For the first couple of years only small numbers were reported, but this rapidly increased after 2017, rising to 31,000,000 by 2022
Table 5: KPI 4 disaggregations
| Sex | Total Achieved | Number of Programmes |
|---|---|---|
| Female | 8,400,000 | 16 |
| Male | 11,000,000 | 16 |
| Unknown | 11,000,000 | 7 |
| Disability | ||
| Disabled | 2,500 | <5 |
| Not disabled | 220,000 | <5 |
| Unknown | 31,000,000 | 20 |
| Geography | ||
| Rural | 890,000 | <5 |
| Urban | 12,000 | <5 |
| Unknown | 30,000,000 | 20 |
KPI 6: Greenhouse gas emissions reduced or avoided
This indicator estimates the reduction in greenhouse gas emissions as a result of UK ICF interventions, compared with expected emissions in the absence of this support.
UK ICF contributes to reducing emissions of greenhouse gases through programmes that cover all sectors of the economy. Activities that particularly deliver against this KPI include those that replace fossil fuels with renewable energy sources (such as solar, wind or geothermal); promote low carbon alternatives to non-sustainably sourced wood for domestic cooking; and reduce deforestation. This indicator is aligned with SDG indicator 13.2.2[footnote 20]. which also measures the net change in annual greenhouse gas emissions.
Benefits can be delivered against this indicator even after a programme has closed if emissions continue to be reduced or avoided. For example, solar panels will continue to generate clean energy and reduce greenhouse gas emissions after the end of the programme which funded installation, for as long as they continue to function. This explains why the expected total lifetime results (Annex 1) are much higher than the results achieved so far against this indicator.
It is estimated that 68,000,000 tonnes of carbon dioxide equivalent were reduced or avoided as a result of ICF programmes since 2011, an increase of 20% compared to the cumulative results up to 2021 (Figure 5). Three programmes also reported against this KPI for the first time in 2022, taking the total number of ICF reporting programmes to 52. Large increases were reported in ‘Reducing Emissions from Deforestation and Forest Degradation (REDD) Early Movers programme’, ‘Climate Investment Funds- Clean Technology Fund’ and ‘Climate Smart Development for Nepal’. By way of example, the Nepal programme covers a wide range of climate adaptation and mitigation interventions, including development of Local Adaptation Plans and supporting Nepal to implement its NDC and other climate commitments made at COP26. Substantial increases to historic results also contributed as the REDD Early Movers programme were able to report against some historic activities for the first time this year. Details of the other programmes referenced here, and throughout this publication, can be found on devtracker [footnote 21].
Sector breakdowns have been reported by 28 programmes, which represent 38% of the total greenhouse gas emission reductions. The Energy Supply and LULUCF (Land Use, Land Use Change and Forestry) sectors contributed the largest emissions reductions with 12 mtCO2e each reduced or avoided to March 2022. These were followed by Industrial Processes (1.6mtCO2e) and Waste Management (420,000tCO2e). The remaining sectors (Residential, Transport and Business) all recorded smaller amounts of emissions reduction. Please note, these are not representative of the ICF portfolio as a whole and as more programmes are able to report disaggregated data over time it is likely these splits between sectors will change.
Figure 5: Greenhouse gas emissions reduced or avoided
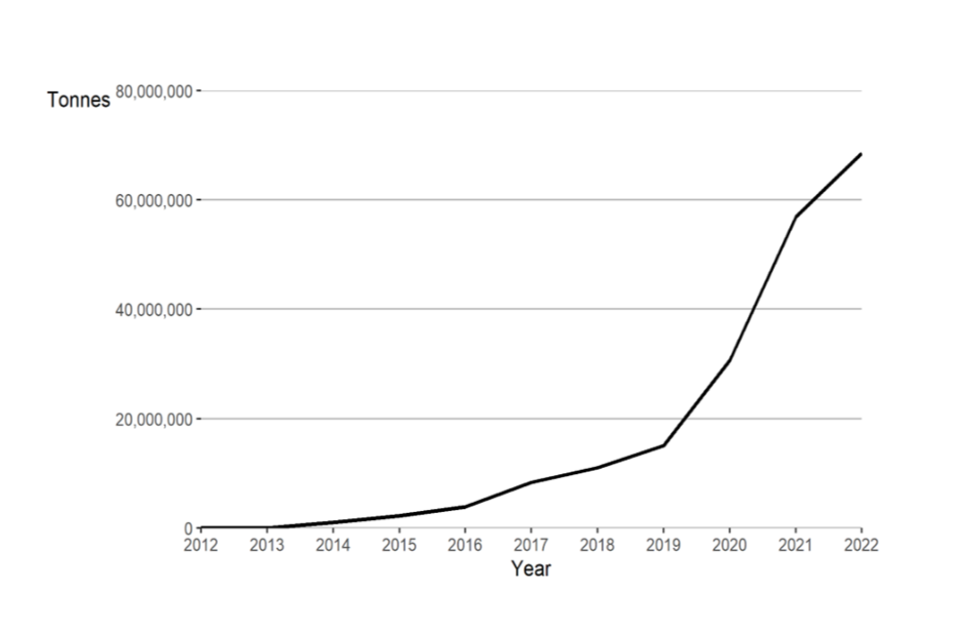
Figure 5 (KPI 6): This chart shows a steady increase in results for this KPI between 2012 and 2019, and a more rapid increase from 2019 to 2022, reaching 68,000,000 tonnes by 2022.
Cumulative annual results achieved for KPI 6 as a result of UK ICF, from April 2011 to March 2022, measured in tonnes of greenhouses gases (CO2 equivalent)
This chart shows a steady increase in results for this KPI between 2012 and 2019, and a more rapid increase from 2019 to 2022, reaching 68,000,000 tonnes by 2022.
Figure 6: Net Change in Greenhouse Gas Emissions (tCO2e) reduced or avoided due to ICF disaggregated by Sector (KPI 6)
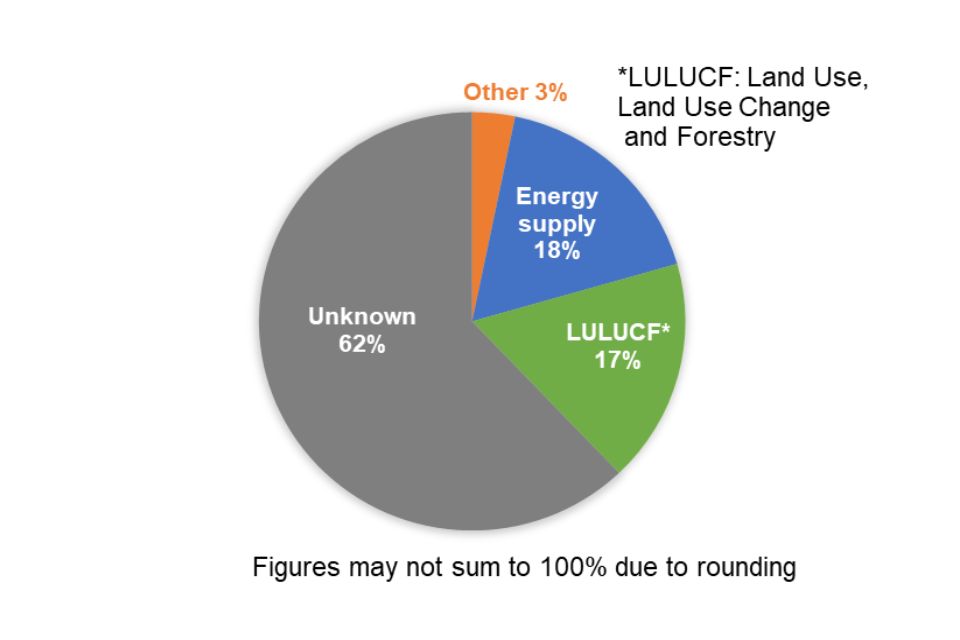
Figure 6 (KPI 6): Shows majority of emissions reduced are not assigned to a specific sector, but of those that are, the 2 largest areas for emission reductions are Energy supply and Land Use, Land Use Change and Forestry.
This chart shows that the majority of emissions reduced are not assigned to a specific sector, but of those that are, the two largest areas for emission reductions are Energy supply and Land Use, Land Use Change and Forestry.
KPI 6 disaggregated results
| Sector | Total achieved (tCO2e) | Number of programmes |
|---|---|---|
| Energy supply | 12,000,000 | 12 |
| Land Use, Land Use Change and Forestry (LULUCF) | 12,000,000 | <5 |
| Industrial processes | 1,600,000 | <5 |
| Waste Management | 420,000 | 5 |
| Residential | 160,000 | <5 |
| Transport | 60,000 | <5 |
| Business | 3,300 | <5 |
| Unknown | 43,000,000 | 36 |
KPI 7: Installed capacity of clean energy
This indicator measures clean energy capacity installed as a result of UK ICF interventions. It tracks both on- and off-grid clean energy sources, such as wind, solar, or geothermal energy; and clean cookstoves. Installed capacity refers to the rated power output when the clean energy source is operational.
Access to energy is a primary constraint to inclusive economic growth and job creation. This supports SDG target 7.b[footnote 22], to expand infrastructure and technology to supply modern, sustainable energy for all in developing countries. In many cases, the generation of energy from clean sources partially displaces fossil fuel energy generation, resulting in reduced greenhouse gas emissions and thereby also contributing to KPI 6 ‘Net change in greenhouse gas emissions’.
It is estimated that 3,300 megawatts of clean energy capacity were installed by ICF programmes between 2011 and 2022, a 30% increase on the cumulative installed capacity up to 2021 (Figure 7). Large increases in results were seen in ‘Supporting Structural Reform in the Indian Power Sector’ and ‘UK-INDIA Partnership on National Investment and Infrastructure Fund -Green Growth Equity Fund’. ‘UK Climate Investments’ which invests in renewable energy and energy efficiency projects across sub-Saharan Africa and India saw a downwards revision to results following an improvement to the methodology for attributing results to UK investments. However, due to the nature of the programme this still delivered substantial results towards this KPI.
A total of 40 programmes have reported against this KPI, 4 programmes more than reported in 2021. The annual increase of 30% represents the fastest growth year-on-year since reporting began, illustrating new clean energy projects delivering results.
Installed clean energy capacity results are disaggregated by Geography, Technology Type and Grid Connectivity. Of the 16 programmes that reported against Geography there was a broadly equal split between Urban and Rural locations (54% to 46%). Disaggregation by Technology Type covers over half the reported megawatts of clean energy capacity installed. Solar photovoltaic (PV) recorded the largest results for this KPI, followed by the ‘Other’ category. Other technology types include mixed renewables, geothermal and smart grids, as well as projects which span multiple technology types. Around a quarter of results reported disaggregation by Grid Connectivity. Most of these reported clean energy generation projects that are feeding into a national or regional grid (On-grid). These projects will typically be utility-scale, in the order of tens or hundreds of MWs.
Figure 7: Installed capacity of clean energy
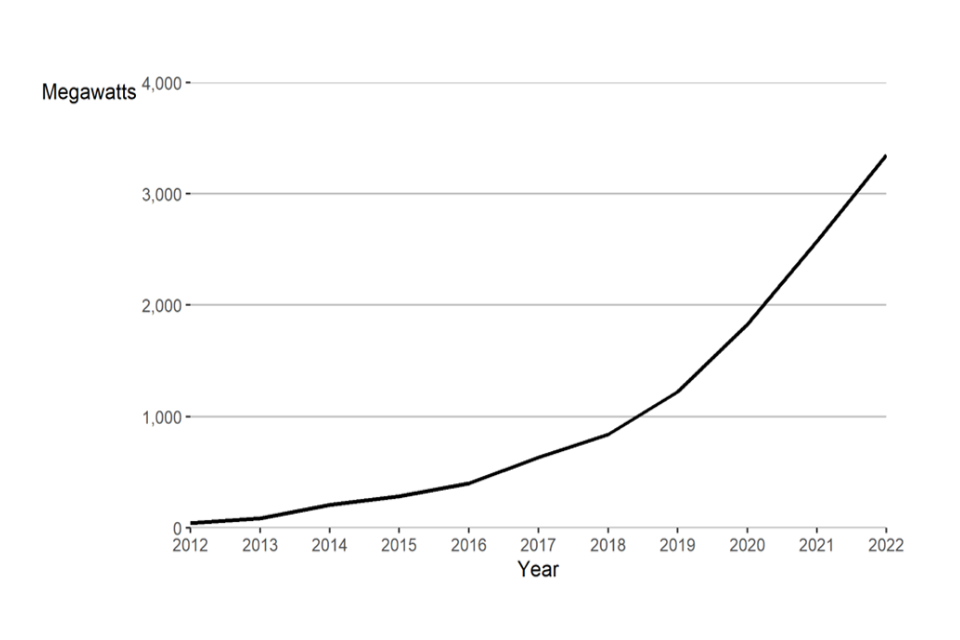
Figure 7 (KPI 7): This chart shows that the results achieved for this KPI have been steadily increasing since 2012, with a slightly steeper increase in results from around 2018.
Cumulative annual results achieved for KPI 7 as a result of UK ICF, from April 2011 to March 2022, measured in megawatts of installed energy capacity.
This chart shows that the results achieved for this KPI have been steadily increasing since 2012, with a slightly steeper increase in results from around 2018.
Table 7: KPI 7 results disaggregated by Geography, Technology Type and Grid Connectivity
| Geography | Total Achieved (MW) | Number of Programmes |
|---|---|---|
| Urban | 270 | 7 |
| Rural | 230 | 7 |
| Unknown | 2,900 | 33 |
| Technology Type | ||
| Solar photovoltaic (PV) | 970 | 19 |
| Wind power | 160 | <5 |
| Hydropower | 140 | <5 |
| Concentrated solar power (CSP) | 74 | <5 |
| Biofuels | 32 | <5 |
| Other | 440 | <5 |
| Unknown | 1,500 | 26 |
| Grid Connectivity | ||
| On-grid | 830 | 12 |
| Off-grid | 82 | 12 |
| Unknown | 2,400 | 28 |
KPI 8: Area of land where deforestation has been avoided
This indicator provides a broad measure of how ICF has helped to reduce deforestation globally. Prevention of deforestation contributes to climate change mitigation by reducing greenhouse gas emissions, as well as helping to preserve biodiversity and reduce poverty through the provision of forest ecosystem services. This indicator includes both areas where deforestation has been avoided (for example, an area of land previously vulnerable to deforestation has had new protections put in place) and areas where afforestation or reforestation has taken place.
Between April 2011 and March 2022, a total of 410,000 hectares of land have avoided deforestation, reported by 14 programmes (Figure 8). Since 2021, there has been a 2% increase in area (8,000 Ha), almost all achieved by the REDD Early Movers programme. This programme is currently operational in Latin America, and rewards pioneers in forest protection and climate mitigation through conditional payments. This small annual increase is mainly due to the timing of old programmes ending and new programmes not yet having large results to report, but we would expect further increases in future years. There has been an increase of 13,000 Ha in the historical results, also mainly due to improved reporting from the REDD Early Movers programme for previous years. Overall, the largest contributions to this KPI have come from the programme ‘Improving Livelihoods and Land Use in Congo Basin Forests’, which completed in 2020. This programme focused on providing support to forest zoning and independent monitoring, civil society forest advocacy and strengthening legal frameworks for community forestry.
Figure 8: Area of land where deforestation has been avoided
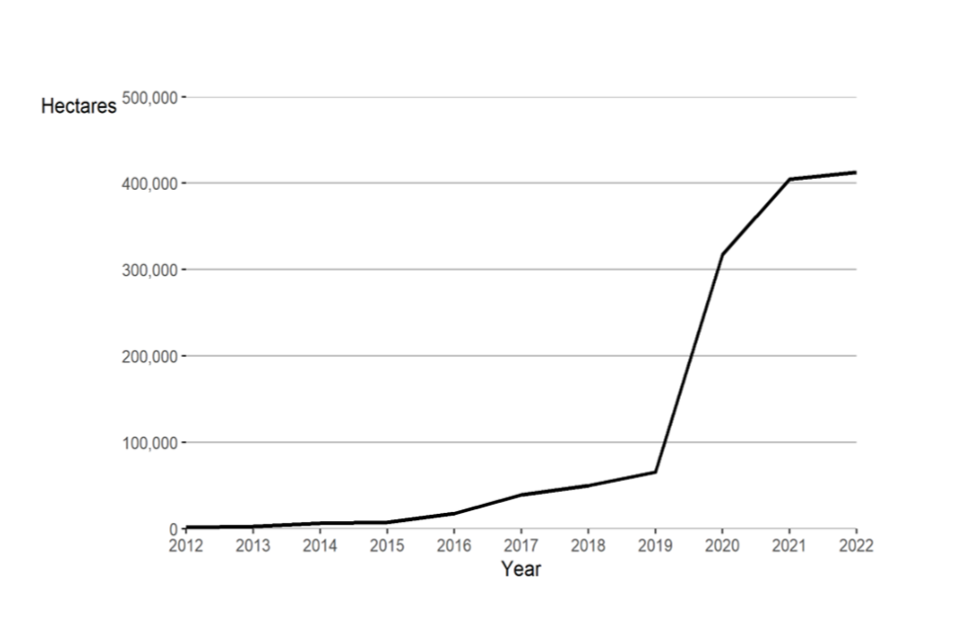
Figure 8 (KPI 8): A slow increase in results for this KPI from 1,400 Ha in 2012 to 66,000 Ha by 2019, and then a much steeper increase to 2021. Small increase from 2021, reaching 410,000 Ha in 2022.
Cumulative annual results achieved for KPI 8 as a result of UK ICF, from April 2011 to March 2022, measured in number of hectares.
There was a slow increase in results for this KPI from 1,400 Ha in 2012 to 66,000 Ha by 2019, and then a much steeper increase to 2021. From 2021 there has only been a small increase, reaching a total of 410,000 Ha in 2022.
KPI 10: Value of ecosystem services generated or protected
Ecosystem services are the principal framework for expressing the value of nature to human health and wellbeing[footnote 23]. They represent benefits that people receive from the natural environment. Ecosystem services can be divided into four categories: provisioning services (e.g., energy, food, medicine), regulating services (e.g., flood protection, climate regulation, pest control), cultural services (e.g., education, recreation, spiritual), and supporting services (e.g., services that underpin ecosystem functioning such as nutrient and hydrological cycles that underly the provision of other services).
From April 2011 to March 2022, £5,300,000 worth of ecosystems services have been generated or protected as a result of ICF interventions in forests. The largest contributions for this indicator come from the programmes ‘Reducing deforestation and Forest Fires in the Brazilian Cerrado’ and ‘Blue Forest Initiative’. These programmes operate across Brazil’s Cerrado biome and both Madagascar and Indonesia respectively. The types of interventions contributing to this indicator include reducing deforestation of mangroves and other forests, sustainable practices within forest habitats and improved resource management.
This KPI has so far only been reported by three programmes and has not seen an increase in results from last year. The low reporting of this indicator is partly because the current methodology is based on KPI 8, so this indicator is restricted to ecosystem services provided by forests and can only be reported by programmes that already collect data on KPI 8. We are in the process of reviewing the methodology for this indicator and plan to make improvements that will help us to better capture the range of ecosystem services supported across the ICF portfolio. No annual breakdown of the results has been provided for this indicator due to the small number of programmes reporting.
KPI 11: Volume of public finance mobilised for climate change purposes
Delivering the UK’s climate change objectives requires substantial amounts of finance from non-UK sources. This indicator estimates the amount of money from non-UK public sources that has been mobilised for climate change as a result of UK ICF interventions.
Mobilised finance measured under this indicator is from public sources including partner country governments, UN agencies and multilateral or regional development banks. The mobilised funds must either be additional funds, or existing funds diverted from a more fossil-fuel-intensive use to be counted.
A total of £5.7bn is estimated to have been mobilised since 2011, an increase of 17% in comparison to 2021 (Figure 9). Results for this KPI have been reported by 62 programmes since 2011. Large increases in achieved results were seen in the programmes ‘Cities and Infrastructure for Growth’, ‘Transforming Energy Access’ and ‘Climate Investment Funds (CIFs) - Clean Technology Fund’. Cities and Infrastructure for Growth supports inclusive economic growth and strengthened investment to help city economies become more productive and improve access to renewable power for businesses and households. Transforming Energy Access supports early-stage testing and scale-up of innovative technologies and business models that accelerate access to affordable clean energy in developing countries, including through strategic partnerships that leverage additional finance for clean energy research and development. The year-on-year increase is broadly in line with the increases seen in the last few years, with 6 additional programmes reporting against this KPI for the first time in 2022.
The largest volume of public finance mobilised was sourced from developing countries (those which are ODA eligible), with 53% of the known finance disaggregated coming from developing countries. Of the programmes that reported public finance disaggregated by mitigation or adaptation theme, 78% of finance was reported against the mitigation theme.
Figure 9: Public finance mobilised for climate change purposes
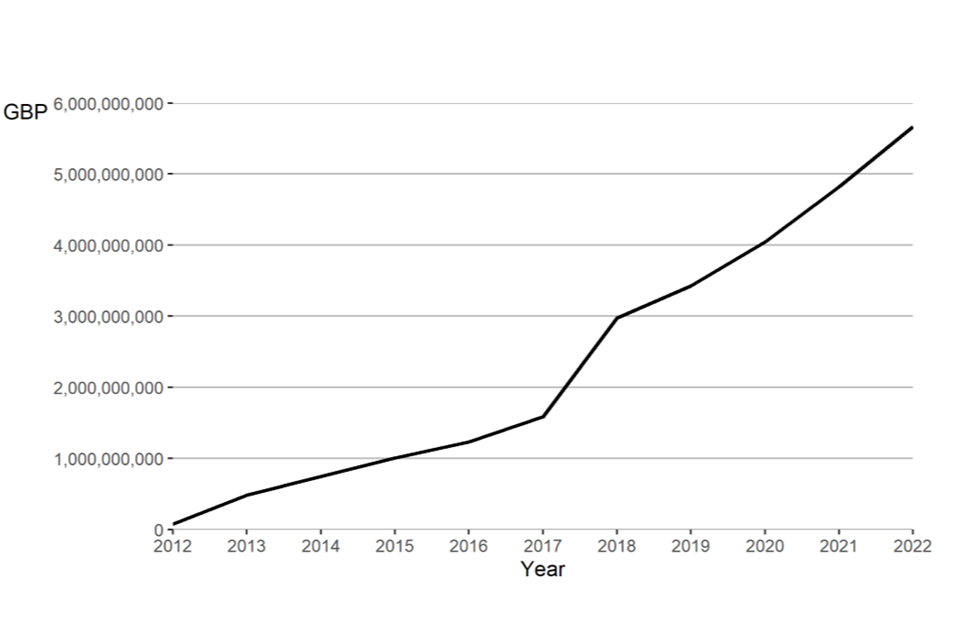
Figure 9 (KPI 11): This chart shows a steady increase in public finance mobilised from 2012 to 2022, with the largest rate of increase between 2017 to 2018.
Cumulative annual results achieved for KPI 11 as a result of UK ICF, from April 2011 to March 2022, measured in GBP.
This chart shows a steady increase in public finance mobilised from 2012 to 2022, with the largest rate of increase between 2017 to 2018.
Table 9: KPI 11 results disaggregated by Climate Theme and Origin of public finance mobilised
| Climate Theme[footnote 24] | Total Achieved (£) | Number of Programmes |
|---|---|---|
| Mitigation | 1,900,000,000 | 20 |
| Adaptation | 530,000,000 | 17 |
| Unknown | 3,300,000,000 | 34 |
| Origin of public finance mobilised[footnote 25] | ||
| Developing country finance | 710,000,000 | 10 |
| Donor finance | 530,000,000 | 8 |
| Multilateral finance | 94,000,000 | <5 |
| Unknown | 4,300,000,000 | 49 |
Information: KPI 11 and 12 Climate Theme Disaggregation
The UK is committed to a balanced split between mitigation and adaptation programmes through its climate finance. Disaggregation by Climate Theme represents the theme where additional finance has been mobilised and is not representative of ICF spending.
KPI 12: Volume of private finance mobilised for climate change purposes
This indicator tracks the amount of private finance mobilised for climate change purposes as a result of UK ICF interventions.
Mobilised finance measured under this indicator is from non-public sources such as banks (excluding multilateral or regional development banks), private companies, pension funds, non-governmental organisations, Clean Development Mechanism financing[footnote 26] , voluntary carbon credit market, insurance companies, private savings, family money, entrepreneurs’ own capital and sovereign wealth funds. It includes all types of finance such as equity, debt and guarantees. This indicator helps measure the UK’s contribution to the commitment made by developed countries to mobilise $100 billion of public and private finance per year to help developing countries respond to climate change, as set out in SDG target 13.a.
It is estimated that £5.2bn of private finance has been mobilised to 2022, an increase of 55% when compared with the cumulative results up to 2021 (Figure 10). Ten additional programmes reported against this key performance indicator for the first time this year bringing the total to 63 reporting programmes. Large increases against this key performance indicator were also seen in ‘Cities and Infrastructure for Growth’, ‘UK-INDIA Partnership on National Investment and Infrastructure Fund -Green Growth Equity Fund’ and ‘Transforming Energy Access’.
Of the programmes that reported the origins of private finance mobilised, 85% of results were from multiple origins. Simple co-financing arrangements were the most frequently used by the programmes which reported against this disaggregation (57% of results from the reporting programmes). These refer to various business partnerships, business surveys, matching programmes and similar, but also result-based approaches to leveraging finance.
Figure 10: Private finance mobilised for climate purposes
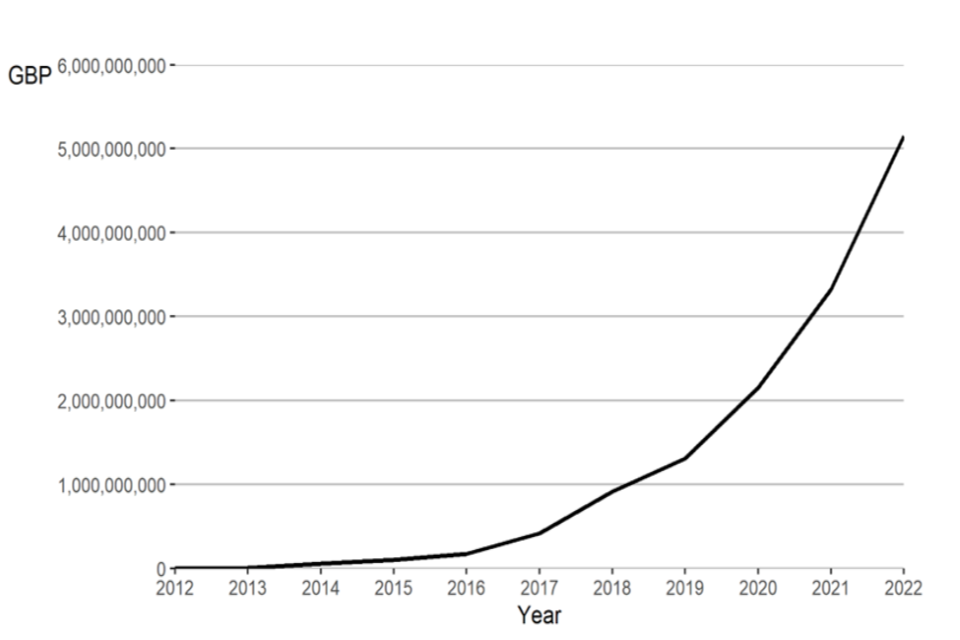
Figure 10 (KPI 12): This chart shows an increasing rate of finance mobilised, with more finance mobilised in recent years compared to earlier years.
Cumulative annual results achieved for KPI 12 as a result of UK ICF, from April 2011 to March 2022, measured in GBP.
This chart shows an increasing rate of finance mobilised, with more finance mobilised in recent years compared to earlier years.
Table 10: KPI 12 results disaggregated by Climate Theme, Origin of private finance mobilised and Leveraging mechanism and role position
| Climate Theme[footnote 27] | Total Achieved (£) | Number of Programmes |
|---|---|---|
| Mitigation | 3,400,000,000 | 36 |
| Adaptation | 460,000,000 | 14 |
| Unknown | 1,300,000,000 | 22 |
| Origin of private finance mobilised[footnote 28] | ||
| Multiple origins | 3,700,000,000 | 47 |
| Recipient country | 380,000,000 | 11 |
| Third high-income/OECD country | 250,000,000 | 5 |
| Provider country | 3,900,000 | <5 |
| Unknown | 850,000,000 | 7 |
| Leveraging mechanism and role position[footnote 29] | ||
| Simple co-financing arrangements | 1,900,000,000 | 37 |
| Direct investment in companies/SPVs, equity | 720,000,000 | 9 |
| Credit lines | 230,000,000 | 6 |
| Common share in flat collective investment vehicle | 210,000,000 | <5 |
| Project finance | 190,000,000 | <5 |
| Shares in the riskiest tranche of structured collective investment vehicle, first-loss share and other | 110,000,000 | <5 |
| Unknown | 1,800,000,000 | 16 |
KPI 15: Extent to which ICF intervention is likely to lead to Transformational Change
International Climate Finance forms only a small part of the necessary action required to tackle climate change, so should aim to be ‘transformational’ to maximise the impact. Transformational change[footnote 30] is ‘change which catalyses further changes’ and is a multi-dimensional concept. This indicator is particularly important for capturing the impacts of programmes that have a strong influencing element, or provide technical assistance to support further interventions or interventions that provide a proof-of-concept that can then be replicated and scaled up by others.
Transformational change is measured differently to many of our other indicators, in that we use a programme level scoring approach. This indicator uses criteria for drivers of transformation to assess the extent to which ICF support can be linked to likely Transformational Change. Programme-specific metrics[footnote 31] are then defined for each criterion, and these are used as evidence for a qualitative assessment of the likelihood of leading to transformational change. Therefore, this indicator cannot be aggregated to provide a total score for the ICF portfolio overall. Evidence can include independent evaluations on the transformational impact of programmes, case studies and management information to report against quantitative and qualitative metrics.
A total of 95 programmes have reported on this indicator between April 2011 and March 2022. Since 2020/21, 13 new programmes have started reporting on this KPI. The majority of programmes have maintained their scores since last year, while 9 reported an increased likelihood of transformational change, and 5 reported a decrease. While scores of 0 (transformational change judged unlikely) are infrequent, there are several reasons why programmes may report this score. This includes timing, where programmes do collect evidence of transformation but may not show any signs of progress in their first few years, for example where COVID-19 may have disrupted delivery, or pilot interventions that are then found unsuitable for scaling up but may still provide local-level benefits. Some of the programmes scoring the highest category of transformational change (4: very likely) were ‘Forest Governance, Markets and Climate’, ‘Partnership for Market Readiness’, ‘Clean Energy Fund Technical Assistance Programme’ and ‘Support to the multilateral Climate Investment Funds’. By way of example, an independent evaluation of the Climate Investment Funds’ transformational impact was used as supporting evidence for this programme. The evaluation took a theory-based approach focused on exploring the mechanisms of how and under what circumstances transformational change takes place and identifying the role that the Climate Investment Funds has played in these changes. The conclusions showed signals of transformational impact across the four funds, with the Clean Technology Fund and the Pilot Program for Climate Resilience (PPCR), two sub-funds of the Climate Investment Funds, showing advanced signs of transformation[footnote 32].
Figure 11: Extent to which ICF intervention is likely to lead to transformational change
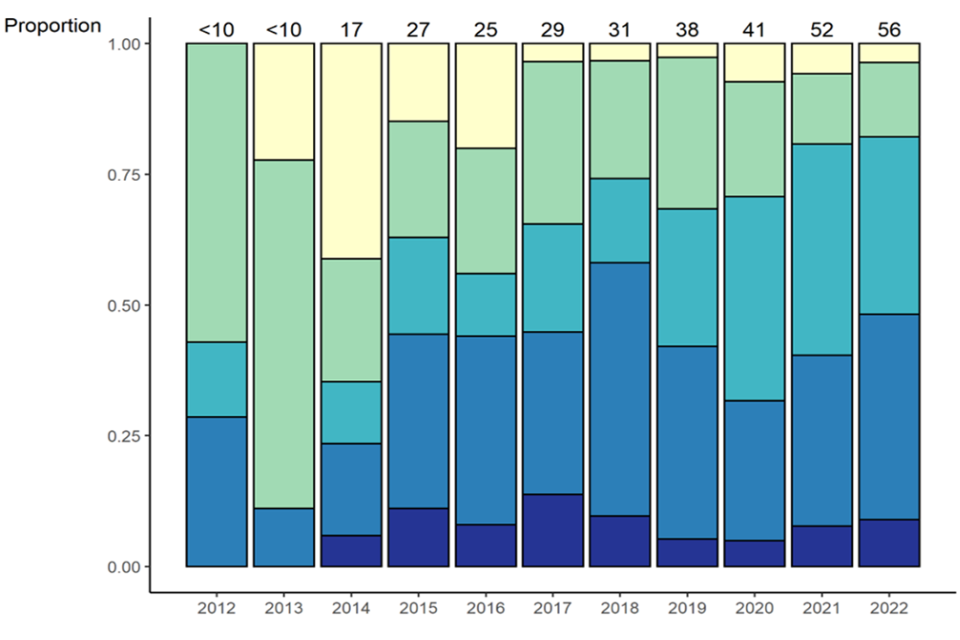
Large increase in the number of programmes reporting KPI 15 since 2012. Programmes scoring the lowest scores (0 or 1) has decreased. Programmes scoring 2 or 3 has increased substantially.
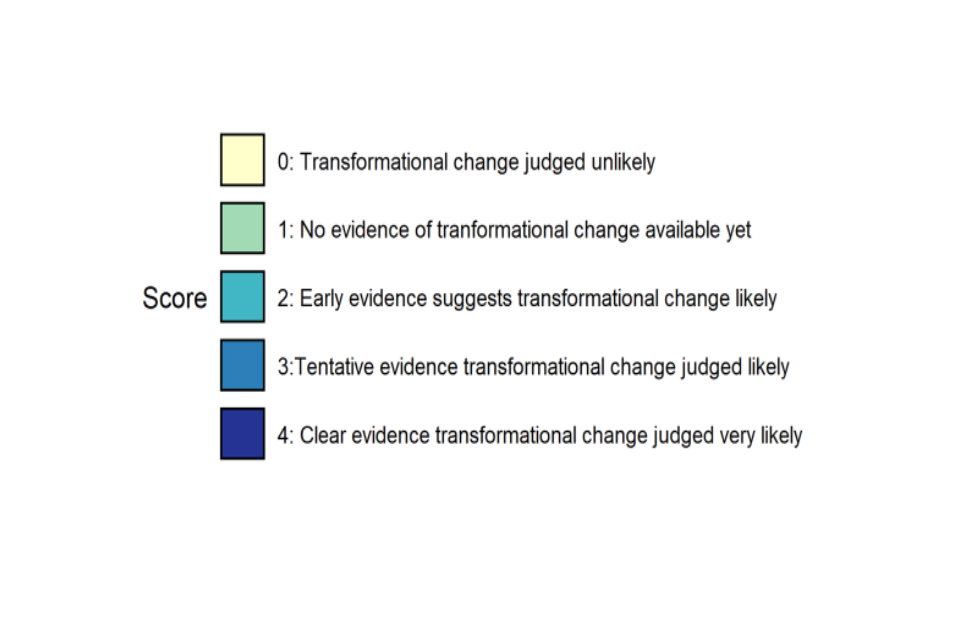
Annual results achieved for KPI 15 from April 2011 to March 2022. This shows the proportion of programmes achieving each score per year on the y axis, and the total number of programmes reporting this KPI is annotated above the bars for context.
There has been a large increase in the number of programmes reporting KPI 15 since 2012. The proportion of programmes scoring the lowest scores (0 or 1) has decreased, with very few scoring 0 in recent years. The number of programmes scoring 2 or 3 has increased substantially. Only a small number report the highest score (4).
KPI 17: Area of land[footnote 33] under sustainable land management
Land degradation is a major driver of biodiversity loss and carbon emissions, and negatively impacts the benefits that people receive from the natural environment, including contributions to their livelihoods, health and wellbeing. Land degradation is exacerbated by a changing climate, along with other human activities. By working to manage land systems sustainably, we can mitigate the impacts of climate change, protecting ecosystem services and biodiversity while also making them more resilient to future climate shocks.
What constitutes sustainable land management is context specific and will vary geographically, as well as depending on the dominant land uses in the region. Sustainable management may include but is not limited to reforestation, agroforestry, habitat protection or restoration.
This indicator was introduced to the ICF portfolio in 2017. Since then, a total of 910,000 hectares have received sustainable land management practice, delivered through 11 programmes (Figure 12). There was an increase of 190,000 Ha (27%) since last year, with 6 programmes reporting new results this year, including the ‘BioCarbon Fund Initiative for Sustainable Forest Landscapes’ reporting results for the first time. This programme provides technical assistance and results-based finance for REDD+ implementation, and helps secure private sector partnerships to reduce emissions through avoided deforestation. One of the programmes that has made the largest contribution to this KPI is the ‘Adaptation for Smallholder Agricultural Programme’, which supports sustainable land management through improved water storage and irrigation systems, tree planting and soil conservation practices. This programme also reported for the first time this year and included results for previous years, which led to an increase in the historical results for this KPI. Another of the leading programmes for this KPI is the ‘Blue Forests Initiative’, which supports community led projects to reduce the deforestation of mangrove habitats in Madagascar and Indonesia.
Figure 12: Area of land under sustainable land management.
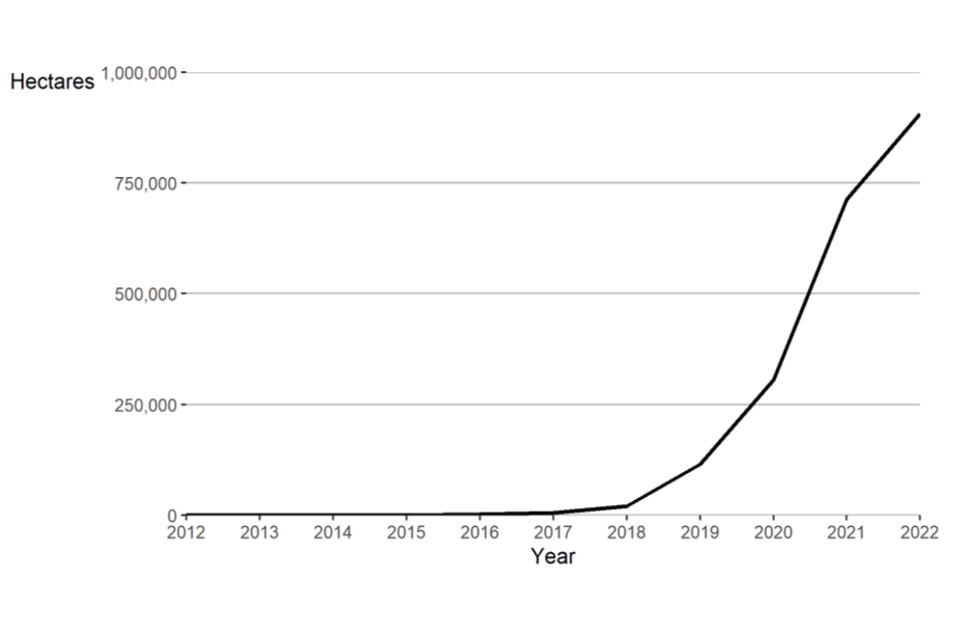
Figure 12 (KPI 17): This indicator was introduced in 2017. From 2018 there has been a steep increase reaching 910,000 Ha in 2022.
Cumulative annual results achieved for KPI 17 as a result of UK ICF, from April 2011 to March 2022, measured in number of hectares.
This indicator was introduced in 2017 so there are no results before then, apart from some results reported retrospectively for 2016. From 2018 there has been a steep increase reaching 910,000 Ha in 2022.
Data quality
Results accuracy is dependent upon the quality of the underlying data. For ICF, data sources include routine monitoring by implementing partners, management information systems of partner country governments and household surveys. Verifying data quality is not straightforward in fragile and conflict-affected states due to access difficulties. COVID-19 compounded existing monitoring challenges through public health measures as well as staff shortages due to illness.
Results against the ICF key performance indicators are quality assured at programme or country level before submission. For programmes with a high volume of results, or high spend, results are quality assured again at the portfolio level by climate analysts in FCDO, BEIS and Defra. These quality assurance steps improve adherence to prescribed methodologies, and minimise errors such as counting the same beneficiary more than once across different years, claiming more results than can be directly attributed to ICF or claiming results that would have occurred without ICF support.
ICF results are not designated as official statistics. But, where possible, FCDO, BEIS and Defra voluntarily apply the UK Statistics Authority’s Code of Practice for Statistics in their production. To enhance transparency, the three departments have published a joint statement of voluntary compliance describing how the ICF results demonstrate trustworthiness, quality and value. This statement can be found on our ICF results page on gov.uk.
Corrections
If an error in any of these results is discovered after publication, a proportionate response will be made depending on whether the incorrect value would lead to a materially different conclusion. If it would, FCDO will issue an ‘unscheduled revision’ as soon as possible after the error is discovered. Errors which are smaller in magnitude will be corrected in the next annual update.
If you have an idea to improve this publication, please get in touch at fcdo.correspondence@fcdo.gov.uk.
Appendix
Annex 1: ICF Expected total programme benefits
Expected total programme benefits include all past and future benefits from current or previous ICF programmes. Benefits include those expected to be delivered after a programme has closed. This is common in climate change mitigation programmes, where, for example, a clean energy technology has been installed that will continue to deliver emissions reductions during the technology’s lifetime. Adjustments are made to reflect risks such as the technology breaking down.
How to use expected results
Expected results can be used to estimate the longer-term achievements of UK ICF by taking account of projected future benefits. At the planning stage of a programme, expected results are modelled based on assumptions about the context and the effectiveness of interventions. These estimates are revised during implementation, and may go up or down as better data become available. As programme monitoring finishes at programme closure, counting the total programme benefits allows a fuller assessment of the overall achievements of ICF.
Table 11: Expected Total Programme Benefits (April 2011 onwards), as of March 2022
| ICF KPI | KPI Name | Expected Total Programme Benefits |
|---|---|---|
| KPI 1 | Number of people supported to better adapt to the effects of climate change | 250,000,000 people |
| KPI 2.1 | Number of people with improved access to clean energy | 95,000,000 people |
| KPI 2.2 | Number of social institutions with improved access to clean energy | 380 institutions |
| KPI 4 | Number of people whose resilience has been improved | 49,000,000 people |
| KPI 6 | Net Change in Greenhouse Gas Emissions reduced or avoided | 890,000,000 tCO2e |
| KPI 7 | Installed capacity of clean energy installed | 6,800 MW |
| KPI 8 | Area where deforestation has been avoided | 40,000,000 hectares |
| KPI 10 | Value of ecosystem services generated or protected | £640,000,000 |
| KPI 11 | Public finance mobilised for climate change purposes | £13,000,000,000 |
| KPI 12 | Private finance mobilised for climate change purposes | £9,600,000,000 |
| KPI 15 | Extent to which ICF intervention is likely to lead to transformational change | Not applicable |
| KPI 17 | Area of land that has received sustainable land management practices | 18,000,000 hectares |
Annex 2: List of programmes that have contributed to the ICF results (2011/12-2021/22)
This includes all programmes that have reported ICF results since 2011/12, including programmes that have since closed. These programmes range from fully ICF funded to those that only include a small ICF component. Further details of programmes can be found on DevTracker by searching the programme ID.
Table 13: List of ICF Programmes
| 112082: | ESPA - Eco System Services for Poverty Alleviation |
| 113889: | Congo Basin Forest Fund (CBFF) Start Up Programme |
| 114058: | Climate Change Programme - Jolobayoo-O-Jibon |
| 114293: | Poorest States Inclusive Growth Programme |
| 200136: | Climate Development for Africa |
| 200368: | Support to the multilateral Climate Investment Funds (CIFs) - Clean Technology Fund (CTF) |
| 200368: | Support to the multilateral Climate Investment Funds (CIFs) - Forest Investment Programme (FIP) |
| 200368: | Support to the multilateral Climate Investment Funds (CIFs) - Pilot Programme for Climate Resilience (PPCR) |
| 200368: | Support to the multilateral Climate Investment Funds (CIFs) - Scaling Up Renewable Energy Programme (SREP) |
| 200496: | Cooperation in International Waters in Africa |
| 200498: | Accountability in Tanzania Programme (ACT) |
| 200658: | Care Adaptation Learning Programme |
| 200773: | Multi-Stakeholder Forestry Programme - Nepal |
| 201129: | Nepal Climate Change Support Programme |
| 201196: | Enhancing Community Resilience Programme |
| 201239: | Livelihoods and Food Security Trust Fund for Burma (NUTSEM) |
| 201286: | Strategic Partnership between BRAC, DFID and AusAID to support BRAC in delivering progress towards the MDGs in Bangladesh and to support its Institutional Development |
| 201295: | Strategic Influencing Fund |
| 201575: | Renewable Energy and Adaptation Climate Technologies (Africa Enterprise Challenge Fund) |
| 201724: | Forest Governance, Markets and Climate |
| 201733: | Climate Public Private Partnership Programme (CP3) |
| 201857: | Market Development in Northern Ghana |
| 201866: | Strategic Climate Institutions Programme |
| 201913: | Strengthening Adaptation and Resilience to Climate Change in Kenya (StARCK) |
| 201931: | Green Africa Power (GAP): Renewable Energy for Africa |
| 201942: | Indonesia Low Carbon Growth Project |
| 201980: | Private Enterprise Programme in Zambia |
| 201986: | Caribbean Renewable Energy and Energy Efficiency Improvement Projects |
| 201989: | Vietnam: DFID-World Bank Climate Change Partnership |
| 202098: | Rural and Agriculture Markets Development programme for Northern Nigeria (PrOpCom Mai-karfi) |
| 202108: | AGMIP - Agricultural Model Inter-Comparison and Improvement Project |
| 202328: | Khyber Pukhtunkhwa Education Sector Programme |
| 202376: | Promoting Low Carbon Development in Indonesia |
| 202433: | UK Support to Increase Resilience to Natural Disasters in Nepal |
| 202495: | Enterprise and Assets Growth Programme |
| 202520: | Water for Three States (Red Sea, Gadarif and Kassala) |
| 202534: | Tanzania Climate Change Institutional Strengthening Programme |
| 202536: | Scaling up of the Energy and Environment Partnership with Southern and East Africa |
| 202539: | Regional Transboundary Water Resources Programme - Phase 3 |
| 202541: | Climate Smart Agriculture in Africa |
| 202549: | Reducing Maternal and Newborn Deaths in Kenya |
| 202555: | Private Sector Energy Efficiency |
| 202571: | Support to the Global Agriculture and Food Security Programme (GAFSP) |
| 202595: | Support for priority actions to operationalise the “Implementation Plan for Development Resilient to Climate Change in the Caribbean” |
| 202597: | Climate High-Level Investment Programme |
| 202619: | Arid Lands Support Programme |
| 202657: | Kenya Essential Education Programme |
| 202691: | Support to improved water and sanitation in rural areas - Zimbabwe |
| 202697: | Punjab Education Support Programme II |
| 202698: | Kenya Market Assistance Programme (MAP) |
| 202737: | Green Climate Fund |
| 202762: | Supporting Indian Trade and Investment for Africa |
| 202775: | South Asia Water Governance Programme (SAWGP) |
| 202817: | Adaptation for Smallholder Agricultural Programme (ASAP) |
| 202844: | Southern Agriculture Growth Corridor Programme in Tanzania |
| 202867: | Financing Liveable Habitat for Poor in Low Income States |
| 202869: | India: Infrastructure Loan Fund - Small loans to bridge the infrastructure gap for the poor |
| 202884: | The Water Security Programme |
| 202908: | Support to the Adaptation Fund for developing countries to build climate resilience |
| 202910: | Support to the Least Developed Countries Fund (LDCF), which aims to increase climate resilience by funding priority interventions in National Adaptation Programmes |
| 202921: | Building Resilience and Adaptation to Climate Extremes and Disasters |
| 202954: | Support for Energy Sector Analysis that influences global energy decision makers |
| 202956: | Global Network of Climate Technology Innovation Centres |
| 202957: | Results Based Financing for Low Carbon Energy Access |
| 202976: | Providing Clean Energy to the Rural Poor of Bangladesh |
| 202995: | Support for Refugees in Kenya (2012-2016) |
| 203029: | Pakistan National Cash Transfers Programme |
| 203034: | International Forestry Knowledge (KnowFor) |
| 203123: | Low Carbon Support to the Ministry of Finance |
| 203152: | Carbon Market Finance for Africa (CMF-Africa) |
| 203153: | East Africa Geothermal Energy (EA-Geo) |
| 203161: | Private Sector Development programme in the DRC |
| 203180: | Climate Proofing Growth and Development in South Asia |
| 203185: | Asia Regional Resilience to a changing climate (ARRCC) |
| 203186: | Rural Access Programme 3 |
| 203264: | Building Disaster Resilience in Pakistan |
| 203272: | Strengthening Health Facilities in the Caribbean |
| 203281: | Comprehensive Programme on Spatial Planning and Low Carbon Development in Papua |
| 203282: | Promoting Low Carbon Development with Returnable Capital in Indonesia |
| 203290: | Improving climate change resilience in Caribbean communities |
| 203294: | Community Disaster Risk Reduction Fund |
| 203427: | Accelerating Investment and Infrastructure in Nepal |
| 203444: | CDC Programme of Support in Africa and South Asia (2015-2023) |
| 203469: | African Risk Capacity (ARC) |
| 203473: | Productive Social Safety Net Programme |
| 203488: | Transparency and Right to Information |
| 203491: | Support to Bangladesh’s National Urban Poverty Reduction Programme (NUPRP) |
| 203516: | Monitoring, Evaluation and Learning from the International Climate Fund |
| 203551: | Tackling Maternal and Child Undernutrition Programme- Phase II |
| 203574: | Strengthening Adaptation and Resilience to Climate Change in Kenya Plus (StARCK+) |
| 203582: | Provision of finance to the Rwanda Fund for Climate Change and Environment |
| 203595: | Achieving Water Security in the Southern Agricultural Growth Corridor |
| 203599: | Building adaptation to climate change in health through resilient water, sanitation & hygiene |
| 203603: | Enhancing resilience in Karamoja Uganda |
| 203624: | On and off Grid Small Scale Renewable Energy in Uganda |
| 203641: | Social Protection Support to the Poorest in Rwanda |
| 203674: | Solar Nigeria Programme |
| 203764: | Nepal Local Governance Support Programme |
| 203766: | Water, Sanitation and Hygiene (One WASH) Programme |
| 203768: | Strengthening Emergency Preparedness and Response in Kenya (2014-2018) |
| 203809: | Disaster Risk Insurance |
| 203842: | Managing Climate Risks for Urban Poor |
| 203844: | Research on Growth and High Volume Transport in Low Income Countries |
| 203852: | Pathways to Prosperity for Extremely Poor People in Bangladesh (PPEPP) |
| 203864: | Better Health in Bangladesh |
| 203871: | Energy Security and Resource Efficiency in Somaliland |
| 203904: | Multi-Year Humanitarian Support to Afghanistan |
| 203911: | India: Infrastructure Equity Fund - Investment in small infrastructure projects in India’s poorest states |
| 203998: | Green Mini-Grids Kenya |
| 204012: | Northern Uganda: Transforming the Economy through Climate Smart Agribusiness (NU-TEC) |
| 204019: | Humanitarian Assistance and Resilience in South Sudan (HARISS) 2015 - 2021 |
| 204020: | Climatescope - Clean Energy Investment Index |
| 204033: | Support to Rural Water Supply, Sanitation & Hygiene in Tanzania |
| 204045: | Urban Water for Sudan (UW4S) |
| 204056: | Global Environment Facility 6th Replenishment |
| 204059: | Supporting Structural Reform in the Indian Power Sector |
| 204135: | Bihar Agriculture Growth and Reform Initiative (BAGRI) |
| 204148: | Food and Agriculture Organisation Core Assessed Contribution 2018 - 2019 |
| 204196: | Burma Humanitarian Assistance and Resilience Programme |
| 204202: | Sustainable Energy for Women and Girls (SEWG) |
| 204248: | Global Green Growth Institute (GGGI) |
| 204250: | Infrastructure and Cities for Economic Development (ICED) |
| 204258: | Hunger Safety Net Programme |
| 204270: | Africa Division funding to the African Agriculture Development Company (AgDevCo) |
| 204290: | Productive Safety Net Programme Phase 4 |
| 204338: | Sustainable Urban Economic Development Programme (SUED) |
| 204364: | Assisting Public Institutions and Markets to Become Resilient to Effects of Climate Change in Tanzania (AIM for Resilience) |
| 204365: | Improving Energy Access in Tanzania through Green Mini-Grids |
| 204369: | Corridors for Growth |
| 204437: | Deepening Democracy Programme |
| 204456: | Programme of Support to Agriculture in Rwanda |
| 204471: | UK Support to Access to Finance Rwanda (AFR) Phase II Operations (2016-2020) |
| 204477: | Exiting Poverty in Rwanda |
| 204495: | Support to Trademark East Africa Rwanda (TMEA) Rwanda Country Programme - Strategy II |
| 204603: | Multi-Year Humanitarian Programme in Pakistan |
| 204623: | Forestry, Land-use and Governance in Indonesia |
| 204624: | WISER - Weather and climate Information and SERvices for Africa |
| 204637: | Africa Clean Energy Programme (ACE) |
| 204640: | Zambia Health Systems Strengthening Programme |
| 204656: | Building Urban Resilience to Climate Change in Tanzania |
| 204773: | Applied Research on Energy and Growth |
| 204783: | Climate Action for Middle East and North Africa (CAMENA) |
| 204784: | Green Mini-Grids Africa Regional Facility for Market Preparation, Evidence and Policy Development |
| 204794: | Infrastructure for Climate Resilient Growth in India |
| 204804: | Accountability in Tanzania Programme - Phase II |
| 204837: | BRILHO - Energy Africa Mozambique |
| 204842: | Promoting Conservation Agriculture in Zambia |
| 204867: | TEA - Transforming Energy Access |
| 204869: | PMEH - Pollution Management & Environmental Health |
| 204888: | Building Resilience Through Asset Creation and Enhancement II in South Sudan (ICF Programme) |
| 204903: | Somali Health and Nutrition Programme (SHINE) |
| 204916: | Strategic Partnership Arrangement II between DFID and BRAC |
| 204940: | Improving Market Systems for Agriculture in Rwanda IMSAR |
| 204941: | Sustainable Inclusive Livelihoods through Tea Production in Rwanda |
| 204956: | CONGO - Improving Livelihoods and Land Use in Congo Basin Forests |
| 204984: | Climate Smart Development for Nepal |
| 205027: | Delivering climate resilient Water, Sanitation and Hygiene in Africa and Asia |
| 205045: | Zimbabwe Resilience Building Fund Programme (ZRBF) |
| 205061: | Increasing renewable energy and energy efficiency in the Eastern Caribbean |
| 205071: | Central Asia South Asia (CASA 1000) Electricity Transmission Project |
| 205082: | Rural Water for Sudan (RW4S) |
| 205115: | Adapt Environmental and Climate Resilience in Sudan |
| 205116: | Support for Protection and Assistance of Refugees in Kenya (SPARK) |
| 205118: | Commercial Agriculture for Smallholders and Agribusiness Programme |
| 205122: | Malawi Humanitarian Preparedness and Response Programme |
| 205128: | Somalia Humanitarian and Resilience Programme (SHARP) 2018-2022 |
| 205138: | Post-Earthquake Reconstruction in Nepal - Building Back Better |
| 205145: | Nepal Health Sector Programme III |
| 205157: | UK Caribbean Infrastructure Fund |
| 205188: | Increasing access to electricity in Sierra Leone |
| 205195: | Rehabilitation of Freetown’s Water Supply System |
| 205222: | Cities and Infrastructure for Growth (CIG) |
| 205226: | Manufacturing Africa - Foreign Direct Investment |
| 205231: | Centre for Disaster Protection (CDP) |
| 205238: | Financial Sector Deepening Africa (FSDA) Platform |
| 205252: | To contribute to the Least Developed Countries Fund for adaptation, hosted by the Global Environment Fund. |
| 205258: | Green Economic Growth for Papua |
| 205266: | Pacific Catastrophe Risk Assessment and Financing Initiative |
| 205268: | Strengthening humanitarian preparedness and response in Bangladesh |
| 300003: | Strengthening disaster resilience in Nepal |
| 300028: | LINKS Powering Economic Growth in Northern Nigeria |
| 300057: | Global Environment Facility 7th replenishment |
| 300067: | Water, Environmental Sanitation and Hygiene Programme |
| 300102: | The Future of Agriculture in Rwanda (FAiR) |
| 300109: | Technical Assistance for Smart Cities (TASC) |
| 300110: | Smart Urban Development in Indian States (SmUDI) |
| 300111: | Low Energy Inclusive Appliances |
| 300113: | Building Resilience and adapting to climate change in Malawi |
| 300116: | Productivity for Prosperity (P4P) |
| 300123: | MECS - Modern Energy Cooking Services |
| 300125: | Climate Compatible Growth |
| 300137: | Regional Economic Development for Investment and Trade (REDIT) Programme |
| 300141: | Sustainable Energy and Economic Development (SEED) Programme |
| 300143: | Hunger Safety Net Programme (HSNP Phase 3) |
| 300147: | Reducing Insecurity and Violent Extremism in the Northern Territories (Re-INVENT) |
| 300161: | Zambia Social Protection Expansion Programme Phase II |
| 300164: | Climate Adaptation Water and Energy Infrastructure Programme |
| 300166: | Khyber Pakhtunkhwa Merged Districts (KPMD) Support Programme (previously called the Federally Administered Tribal Areas (FATA) Development Programme) |
| 300168: | Zimbabwe - Support to Agriculture, Land Governance and Resilience Programme (2021 -2025) |
| 300185: | Supporting a Sustainable Future for Papua’s Forests |
| 300187: | Strengthening Palm Oil Sustainability in Indonesia |
| 300230: | Transboundary Water Management in Southern Africa |
| 300252: | Teacher Effectiveness and Equitable Access for Children (TEACH) |
| 300274: | K Nigeria Infrastructure Advisory Facility (UKNIAF) |
| 300298: | Humanitarian Response in Mozambique |
| 300303: | Rural Electrification in Sierra Leone |
| 300308: | Direct Response through Emergency Cash Transfers |
| 300351: | Second phase of DFID’s Support to the Private Infrastructure Development Group (PIDG) |
| 300363: | Building Resilience in Ethiopia (BRE) |
| 300368: | Somaliland Development Fund (SDF) Phase II |
| 300414: | Essential Healthcare for the Disadvantaged in Bangladesh |
| 300418: | UK-INDIA Partnership on National Investment and Infrastructure Fund -Green Growth Equity Fund |
| 300421: | UK: India Fastrack Start-up Fund (FSF) |
| 300424: | Reducing Deforestation Through Improved Spatial Planning in Papua Provinces, Indonesia |
| 300432: | North East Nigeria Transition to Development Programme |
| 300489: | Africa Food Trade and Resilience programme |
| 300524: | Strengthening Disaster Recovery and Resilience in the Caribbean |
| 300554: | Bangladesh - Rohingya Response and National Resilience (RRNR) |
| 300555: | Africa Land Facility |
| 300580: | Educate the Most Disadvantaged Children in Bangladesh |
| 300635: | Private Enterprise Programme Zambia Phase II |
| 300678: | Core Contribution 2020 - 2021 Food and Agriculture Organisation |
| 300680: | Yemen Independent Monitoring, Evaluation and Data Analysis (IMEDA) |
| 300683: | Strengthening Ethiopia’s Adaptive Safety Net (SEASN) |
| 300686: | Support for the Climate Resilience Execution Agency of Dominica |
| 300702: | Accelerating Ethiopia’s Economic Transformation |
| 300705: | Delivering ambition of the United Nations Secretary General’s Climate Summit 2019 to build resilience to climate change |
| 300724: | Water Resource Accountability in Pakistan (WRAP) |
| 300751: | Global Risk Financing Facility [GRIF] |
| 300798: | Building Resilience and Addressing Vulnerability in Emergencies (BRAVE) |
| 300889: | Global Water Leadership in a Changing Climate |
| 300921: | Mobilising Institutional Capital Through Listed Product Structures |
| 301013: | Resilient Water Sanitation and Hygiene (WASH) and Emergency Preparedness Programme (RWEPP) |
| 301052: | Education Quality Improvement Programme in Bangladesh EQUIP-B |
| 0001-CCUS: | International Carbon Capture, Usage and Storage (CCUS) |
| 0002-CEFTA: | Clean Energy Fund Technical Assistance Programme (CEF TA) |
| 0003-CLIC: | Climate Leadership In Cities (CLIC) |
| 0006-CETP: | Clean Energy Transition Programme (CETP) |
| 0007-NAMA: | The Nationally Appropriate Mitigation Actions (NAMA) Facility |
| 0008-NDCP: | NDC Partnership |
| 0009-GETFiT: | Global Transfer Feed-in Tariff (GETFiT) |
| 0011-GCPF: | Global Climate Partnership Fund (GCPF) |
| 0012-CMCI: | The Global Innovation Lab- (Continuation of the Capital Markets Climate Initiative) |
| 0013-REPP: | Renewable Energy Performance Platform (REPP) |
| 0014-SIPLA: | Sustainable Infrastructure Programme - Latin America (SIP LA) |
| 0015-UKCI: | UK Climate Investments (UKCI) |
| 0016-BioCF: | BioCarbon Fund Initiative for Sustainable Forest Landscapes (BioCF) |
| 0017-FCPF: | Forest Carbon Partnership Facility- Carbon Fund (FCPF) |
| 0018-P4F: | Partnerships for Forests (P4F) |
| 0019-REM: | REDD Early Movers programme |
| 0020-SPS: | Sustainable Cattle Ranching Project (Silvopastoral Systems) |
| 0021-UKPACT: | UK Partnering for Accelerating Climate Transitions (UK PACT) |
| 0022-CBIT: | Capacity Building for Transparency Initiative (CBIT) |
| 0023-FijiCOP: | Fiji Support Programme |
| 0025-CiDev: | Carbon Initiative for Development (Ci-Dev) |
| 0026-PMR: | Partnership for Market Readiness (PMR) |
| 0027-TCAF: | Transformational Carbon Asset Fund (TACF) |
| 0028-2050C: | 2050 Calculator |
| 0029-KEEP: | Knowledge, Evidence and Engagement Portfolio (KEEP) |
| 0032-MAGC: | Market Accelerator for Green Construction (MAGC) |
| 0033-ESMAP: | Energy Sector Management Assistance Programme (ESMAP) |
| 0034-CaBIN: | Climate Ambition Support Alliance (CASA) |
| 0036-CFA: | Climate Finance Accelerator (CFA) |
| 0037-CEIF: | Clean Energy Innovation Facility (CEIF) |
| 0039-ForTREES: | Territorios Forestales Sostenibles (TEFOS) |
| 0040-MFF: | Mobilising Finance for Forests (MFF) |
| P0001-BV: | Blue Forests Initiative |
| DefraPO002: | Reducing Deforestation and Forest Fires in the Brazilian Cerrado |
| P0003-EcoB: | The eco.business Fund |
| PO008-UKBLUECARBONFUND: | UK Blue Carbon Fund |
| PO009-LDN: | Land Degradation Neutrality Fund |
| PO012-LCP1: | Low Carbon Agriculture and Avoided Deforestation in Brazil - Phase 1 (Rural Sustentavel Phase 1) |
| PO013-LCP2: | Low Carbon Agriculture and Avoided Deforestation in Brazil - Phase 2 (Rural Sustentavel Phase 2) |
| GB-GOV-52-CSSF-06-000023: | Conflict, Stability and Security Fund (CSSF) Middle East Peace Process |
| PRP IND 001004[footnote 34]: | Voluntary Contribution to support IEA activities in India within Clean Energy Transitions Programme |
| PRP IND 001002: | Exploring Policy and Institutional arrangements for advancing City - Decarbonisation |
| PRP IND 001005: | UK - Niti Aayog Electric Mobility Accelerator Programme |
| PRP IND 001007: | ASPIRE (Accelerating Smart Power and Renewable Energy in India) |
| PRP IND 003001: | Sustainable Cities - India |
Jointly published by the Foreign, Commonwealth & Development Office, the Department for Business, Energy & Industrial Strategy, and the Department of Environment, Food & Rural Affairs.
Foreign, Commonwealth & Development Office
Abercrombie House
Eaglesham Road
East Kilbride
Glasgow
G75 8EA
Tel: +44 (0) 20 7008 5000
Website: www.gov.uk/government/organisations/foreign-commonwealth-development-office
Facebook: www.facebook.com/ForeignCommonwealthAndDevelopmentOffice
Twitter: @FCDOGovUK
Email: fcdo.correspondence@fcdo.gov.uk
© Crown copyright 2022 Copyright in the typographical arrangement and design rests with the Crown. This publication (excluding the logo) may be reproduced free of charge in any format or medium, provided that it is reproduced accurately and not used in a misleading context. The material must be acknowledged as Crown copyright with the title and source of the publication specified.
-
UN Framework Convention on Climate Change (2022) Climate Finance in the negotiations. ↩
-
Organization for Economic Cooperation and Development (2021) Forward-looking Scenarios of Climate Finance Provided and Mobilised by Developed Countries in 2021-25 ↩
-
Intergovernmental Panel on Climate Change (2018) Special Report on Global Warming of 1.5 °C ↩
-
UK Government (2022) The UK government’s strategy for international development ↩
-
Information on individual ICF programmes can be found on DevTracker under sector, location or government department, using the International Climate Finance filter. ↩
-
UN (2022) Sustainable Development Goals Report ↩
-
IPCC (2022) 6th Assessment Report WGIII: Summary for Policymakers ↩
-
IPCC (2022) 6th Assessment Report WGII: Summary for Policymakers ↩
-
World Bank (2016) Managing the impacts of climate change on poverty. ↩
-
Dasgupta et. al. (2021) The Economics of Biodiversity ↩
-
IPCC (2022) 6th Assessment Report WGIII: Summary for Policymakers ↩
-
UN (2022) COP26 Glasgow Climate Pact ↩
-
UN (2015) United Nations Framework Convention on Climate Change: Paris Agreement ↩
-
There are 11 ICF KPIs in current use at the portfolio level. Their non-continuous numbering reflects the discontinuation of indicators found not to be well suited to ICF portfolio monitoring in a 2018 review. ↩
-
UK Government (2021) Climate Finance Results ↩
-
All results have been rounded to two significant figures. ↩
-
‘Unknown’ includes programmes who haven’t reported any disaggregated data against this category, as well as programmes that were unable to provide a full breakdown of disaggregations. This is the first time disaggregated data has been reported and the ambition is for more programmes to collect this data over time so the data will become more complete. ↩
-
The low number for the ‘not disabled’ category is because programmes were not able to supply a breakdown by both sex and disability, so only reported sex in many cases. ↩
-
For this KPI, social institutions are defined as: schools, universities, hospitals, health centres, government institutions, state owned infrastructure and civil society organisations. ↩
-
UN (2022) Sustainable Development Goal 13 ↩
-
UK Development Tracker (2022) ↩
-
UN (2022) Sustainable Development Goal 7 ↩
-
UN Convention on Biological Diversity (2020) Ecosystem Services Factsheet. ↩
-
Please refer to the information box for further details. ↩
-
Definitions: Developing country finance = ODA eligible countries (based on the OECD DAC list: http://www.oecd.org/dac/stats/annex2.htm), Donor finance = OECD DAC bilateral finance providers (based on OECD DAC membership http://www.oecd.org/dac/dacmembers.htm), Multilateral finance = OECD DAC multilateral finance (based on ODA eligible international organisations: http://www.oecd.org/dac/stats/annex2.htm) ↩
-
The Clean Development Mechanism (CDM) is a way to finance emissions mitigation projects by selling certified emission reductions, or CERs. For further information, see https://cdm.unfccc.int/ ↩
-
Please refer to the information box for further details. ↩
-
Provider country = Private sector actor based in the UK; Recipient country = Private sector actor based in the same country receiving support from the ICF project or programme; Third high-income/OECD country = Private sector actor based in another high-income country (based on OECD DAC membership); Third developing country = Private sector actor based in a partner/developing country other than the recipient country (based on the OECD DAC list of ODA eligible countries). ↩
-
Full definitions are available from the OECD DAC Mobilisation Methodology ↩
-
Transformational change is ‘change which catalyses further changes’, enabling either, a shift from one state to another (e.g., from conventional to lower carbon or more climateresilient patterns of development), or faster change (e.g., speeding up progress on cutting the rate of deforestation). ↩
-
The ICF is likely to be more transformational in developing countries if several of the following criteria prevail; Political will and local ownership, Capacity and capability can be increased, Innovation, Evidence of effectiveness is shared, Leverage / create incentives for others to act, Replicable, At scale, Sustainable. Full definitions are available from the underlying methodology document: UK Government (2022) Climate Finance Results ↩
-
Climate Investment Funds: Evaluation of Transformational Change in the Climate Investment Funds (2019) ↩
-
This indicator uses ‘area of land’ in the title but is equally applicable to marine or freshwater habitats. ↩
-
The PRP programmes are not currently available on DevTracker ↩
