UK Shared Prosperity Fund allocations: methodology note
Updated 10 May 2022
Overview
This note sets out the methodology used to allocate the £2.6 billion UK Shared Prosperity Fund (UKSPF) across the UK up to the end of the 2024-25 financial year.
The UKSPF is a successor to some EU Structural Funds. Specifically, the European Regional Development Fund (ERDF) and European Social Fund (ESF). Other European Funds, such as the European Agricultural Fund for Rural Development (EAFRD), are being replaced separately. This means that the key objectives of this UKSPF allocation methodology are to ensure a degree of continuity of funding for places transitioning away from EU funding, while still ensuring that funding is targeted towards areas most in need at the present time.
More detail on the policy goals and investment priorities of the UKSPF can be found in the prospectus, which also contains the allocations to places resulting from the methodology described below.
General principles
The allocation methodology for the UKSPF was developed in accordance with the following core principles, in line with commitments made at the last Spending Review (SR):
- In terms of total allocations, the UKSPF will, at a minimum, match the size of some EU Structural Funds across the UK. Only the European Social Fund (ESF) and European Regional Development Fund (ERDF) were allocated directly to England, Scotland, Wales, and Northern Ireland – so our methodology will ensure that the UKSPF will match the size of these two funds in Scotland, Wales, Northern Ireland and in all areas of England.
- All delivery geographies receive funding: in England, these are the Mayoral Combined Authorities (MCA) where they exist, the Greater London Authority (GLA), and unitary or lower tier local authorities otherwise. The GLA, consisting of London’s 32 boroughs, and City of London are treated as one delivery geography. In Scotland and Wales, local authorities are encouraged to form regional groupings based on existing structures. This is not mandatory and where local authorities want to deliver on their own, this will be possible. In Northern Ireland, DLUHC will have oversight of delivery. This reflects the distinct and different role local government plays in Northern Ireland.
In addition, the methodology ensures that:
- In England, the share of total funding allocated to Local Enterprise Partnerships matches what they were notionally allocated under ERDF and ESF in real terms.
- The share of funding allocated to each delivery geography (MCA, GLA, or local authority) has been distributed based on both population and need, where the measure of need is outlined below.
Methodology
Elements of the UKSPF
As set out at the Spending Review, £559m of the UKSPF has been earmarked to launch Multiply, a new adult numeracy programme. Further detail on Multiply has been published alongside and within the UKSPF prospectus.
Of this £559m, £129m will be reserved centrally to deliver a new digital platform and a series of randomised control trials, which aim to improve the evidence base for adult numeracy interventions, as well as enabling a robust evaluation of the Multiply programme. Aside from this centrally reserved £129m, the remainder of the UKSPF’s £2.6bn funding - including the remaining £430m of Multiply - will be allocated using the methodology outlined below.
This note refers to the three different elements of the overall UKSPF as:
- Core UKSPF budget: £2.06bn over the Spending Review period
- Multiply budget: £430m over the Spending Review period
- Centrally retained Multiply: £129m over the Spending Review period
The £2.06bn of Core UKSPF and the £430m of Multiply are allocated to each of the four parts of the UK and then to local areas. Because the £129m of centrally retained Multiply supports the remainder of UK-wide Multiply activity, it has not been further allocated to England, Scotland, Wales, and Northern Ireland local areas.
Throughout this note, any mention of Multiply does not refer to the centrally retained portion, unless explicitly stated.
Table 1: UKSPF elements (£m)
| UKSPF element | 22-23 | 23-24 | 24-25 | Total |
|---|---|---|---|---|
| Core UKSPF | 250 | 500 | 1310 | 2060 |
| Multiply | 130 | 150 | 150 | 430 |
| Centrally Retained Multiply | 49 | 40 | 40 | 129 |
| Total | 429 | 690 | 1,500 | 2,619 |
Totals may not sum due to rounding
Allocating the UKSPF
UKSPF is allocated in two stages; first, to England, Scotland, Wales, and Northern Ireland, and then these allocations are distributed to local areas within each part of the UK (except for Northern Ireland).
Allocations to England, Scotland, Wales, and Northern Ireland
The allocation approach comprises the following steps:
Step 1: Estimate the average annual size of ERDF and ESF in each part of the UK from the 2014-2020 round of funding.
Step 2: Allocate the 2024-25 core UKSPF and Multiply budget to Scotland, Wales and Northern Ireland to match the size of ERDF and ESF in real terms as estimated in step 1. The remainder is allocated to England, which is sufficient to give all Local Enterprise Partnership (LEP) areas in England, a real terms match.
Step 3: Allocate UKSPF budget in 2022-23 and 2023-24 to England, Scotland, Wales, and Northern Ireland, proportionate to their 2024-25 allocation and the UKSPF spend profile.
Step 1: Estimate the average annual size of EU Structural Funds in England, Scotland, Wales, and Northern Ireland in real terms
The figures used to estimate the average annual notional allocation of EU Structural Funds in England, Scotland, Wales and Northern Ireland come from the UK Partnership Agreement, which includes a budget profile in euros for ERDF and ESF by for each of England, Scotland, Wales, and Northern Ireland over the 2014-2020 period. These figures have been converted (for ERDF and ESF) to pounds by using the annual exchange rate (source: OECD Data) for each year of the budget profile.
To account for inflation over the past programme period (2014-2020) and the next Spending Review period, the real terms annual average of ERDF and ESF is estimated. The most recent GDP deflator forecast at the time of analysis were used (source: GDP deflators from March 2022) to calculate the real value of funding in 2024-25 prices, when the UKSPF will have ramped up to £1.5bn.
The UK Partnership Agreement includes a calendar year spend profile for ERDF and ESF. However, as the UKSPF will be allocated over financial years, the calendar year profile has been converted into a financial year spend profile. This method assumes that funds are distributed equally across the financial year, and so allows use of GDP financial year deflators consistently throughout our calculations. For example, this approach implies that 25% of the allocation in calendar year 2014 is adjusted for inflation using the 2013-14 financial year (April-March) deflator, with the remaining 75% being adjusted for inflation using the 2014-15 deflator.
Step 1 ensures that the size of allocations to Scotland, Wales and Northern Ireland, at a minimum, match the real terms average size of ERDF and ESF in 2024-25. The following table sets out the estimated nominal and real annual averages of 2014-2020 ERDF and ESF allocations.
Table 2: Nominal and real estimates of average ERDF and ESF for England, Scotland, Wales, and Northern Ireland (£m)
| Nation | Nominal average ERDF and ESF | Real terms average ERDF and ESF |
|---|---|---|
| Scotland | 106 | 124 |
| Wales | 291 | 343 |
| Northern Ireland | 63 | 74 |
| England | 845 | 996 |
| Total | 1305 | 1538 |
Total may not sum due to rounding.
Step 2: Allocate the 2024-25 UKSPF budget to England, Scotland, Wales, and Northern Ireland
In 2024-25, excluding £40m for the centrally retained portion of Multiply (see the ‘Elements of UKSPF’ section above), there is £1460m of Core UKSPF funding (£1310m) and (non-centrally retained) Multiply (£150m) left to allocate to England, Scotland, Wales, and Northern Ireland. Once Scotland, Wales and Northern Ireland have been allocated their estimated real terms annual average (as per step 1), the remaining £918m of this £1460m is allocated to England.
Step 3: Allocate earlier years of the UKSPF budget to England, Scotland, Wales, and Northern Ireland
Once allocations for 2024-25 have been set by step 2, step 3 ensures that the profile of allocations for each of England, Scotland, Wales and Northern Ireland in earlier years follows the total non-centrally retained Multiply budget profile for wider UKSPF – i.e., allocations for 2022-23 and 2023-24 to England, Scotland, Wales, and Northern Ireland, regions and local authorities are set at the same proportion of the overall yearly core UKSPF quantum as in 2024-25. As for step 2, step 3 also includes allocations of Multiply to England, Scotland, Wales, and Northern Ireland (other than the centrally delivered portion).
Table 3: England, Scotland, Wales, and Northern Ireland allocations of Core UKSPF and (non-centrally retained) Multiply (£m)
| Nation | 2022/23 | 2023/24 | 2024/25 | SR |
|---|---|---|---|---|
| Scotland | 32 | 55 | 124 | 212 |
| Wales | 89 | 153 | 343 | 585 |
| Northern Ireland | 19 | 33 | 74 | 127 |
| England | 239 | 409 | 918 | 1566 |
| Total UK | 380 | 650 | 1,460 | 2,490 |
Total may not sum due to rounding. This does not include additional funding from the £1 million floor, as described in step E6.
Table 4: Breakdown of England, Scotland, Wales, and Northern Ireland allocations by element of UKSPF over the SR period (£m)
| Nation | Total 22/23 | Total 23/24 | Total 24/25 | Total SR | Core UKSPF 22/23 | Core UKSPF 23/24 | Core UKSPF 24/25 | Core UKSPF SR | Multiply 22/23 | Multiply 23/24 | Multiply 24/25 | Multiply SR |
|---|---|---|---|---|---|---|---|---|---|---|---|---|
| Scotland | 32 | 55 | 124 | 212 | 21 | 43 | 112 | 175 | 11 | 13 | 13 | 37 |
| Wales | 89 | 153 | 343 | 585 | 59 | 118 | 308 | 484 | 31 | 35 | 35 | 101 |
| Northern Ireland | 19 | 33 | 74 | 127 | 13 | 25 | 67 | 105 | 7 | 8 | 8 | 22 |
| England | 239 | 409 | 918 | 1,566 | 157 | 314 | 824 | 1,296 | 82 | 94 | 94 | 270 |
| Total | 380 | 650 | 1,460 | 2,490 | 250 | 500 | 1,310 | 2,060 | 130 | 150 | 150 | 430 |
Total may not sum due to rounding. This does not include additional funding from the £1 million floor, as described in step E6.
Local allocations in England
The allocation approach comprises the following steps:
Step E1: Estimate the real terms annual average allocation of ERDF and ESF to LEPs over the 2014-2020 period in 2024-25 prices.
Step E2: Estimate the difference between allocations of Multiply in 2024-25 and the real terms ERDF and ESF average in each LEP.
Step E3: Allocate core UKSPF Budget to top up each LEPs Multiply allocation so that their total UKSPF allocation is equal to their real terms ERDF and ESF average in 2024-25.
Step E4: Distribute 70% of LEP region allocations to local authorities within each region according to population.
Step E5: Distribute 30% of LEP region allocations to local authorities within each region, according to a needs-based index.
Step E6: Allocate additional funding to local authorities who, through the above steps, have been allocated less than £1 million of core UKSPF funding over the SR period. This means that every local authority, that is not part of a wider delivery geography (such as a Mayoral Combined Authority or the Greater London Authority) will receive at least £1m in UKSPF funding over the SR period.
Step E1: Estimate the real terms annual average allocation of EU Structural Funds to LEPs
The 38 LEP regions in existence in 2013 were used to allocate the ERDF and ESF (ETC was not allocated regionally) for the 2014-2020 period. The Partnership Agreement (as used for the total estimates for England, Wales, Scotland and Northern Ireland) does not include a sub-national breakdown of spend, so the annual average allocations to LEPs were sourced differently (source: BEIS (PDF, 48KB)) but converted to pounds using the same spend profile and exchange rates as for the rest of England. This is then used to estimate a real terms annual average allocation of ERDF and ESF to LEPs, as done for all four parts of the UK.
Step E2: Estimate the difference between allocations of Multiply and the real terms ESIF average in each LEP
The Department for Education has allocated Multiply in England according to skill levels in each local authority. These allocations are to upper tier local authorities and Mayoral Combined Authorities. These allocations are mapped to LEP regions, in order to estimate the difference between a LEPs real terms annual average ESIF allocation and their allocation of Multiply, in 2024-25 (when the UKSPF has ramped up to the average EU value). This step calculates the minimum allocation of core UKSPF needed by each LEP to ensure that their total allocations (Multiply and core UKSPF) ramp up to a real terms match in 2024-25.
Step E3: Use the Core UKSPF Budget to top up each LEPs Multiply allocation so that their total UKSPF allocations is equal to their real terms ESIF average.
Steps E1 and E2 calculate the minimum core UKSPF allocation required to ensure that each LEP gets a real terms match of historic EU allocations, after including Multiply and core UKSPF. Once LEPs have been allocated this minimum amount, any remaining core UKSPF is allocated according to LEP percentage shares of EU funding.
Steps E4, E5 and E6 distribute the total allocations to LEP regions to constituent Local Authorities within each LEP. This distribution is based on 70% of the total allocation to each LEP being distributed based on local authority population size (a ‘per capita’ basis), and 30% is distributed using the need-based index as was developed for the UK Community Renewal Fund, which was designed as a precursor to the UKSPF. The index has been updated to reflect the latest data where available. Further details on the updated index will be published in due course. This 70:30 split has been chosen to ensure that funding is weighted toward those areas most in need of greater funding levels, while maintaining a level of continuity with the EU funds that the UKSPF is replacing, to minimise the size of funding gaps during transition from an EU-led regime to a UK government-led one.
Step E4: Distribute 70% of regional LEP allocations to local authorities within each region according to population.
ONS mid-2020 population statistics at the local authority level were used to calculate the per-capita portion of places’ allocations. The formula is given by:
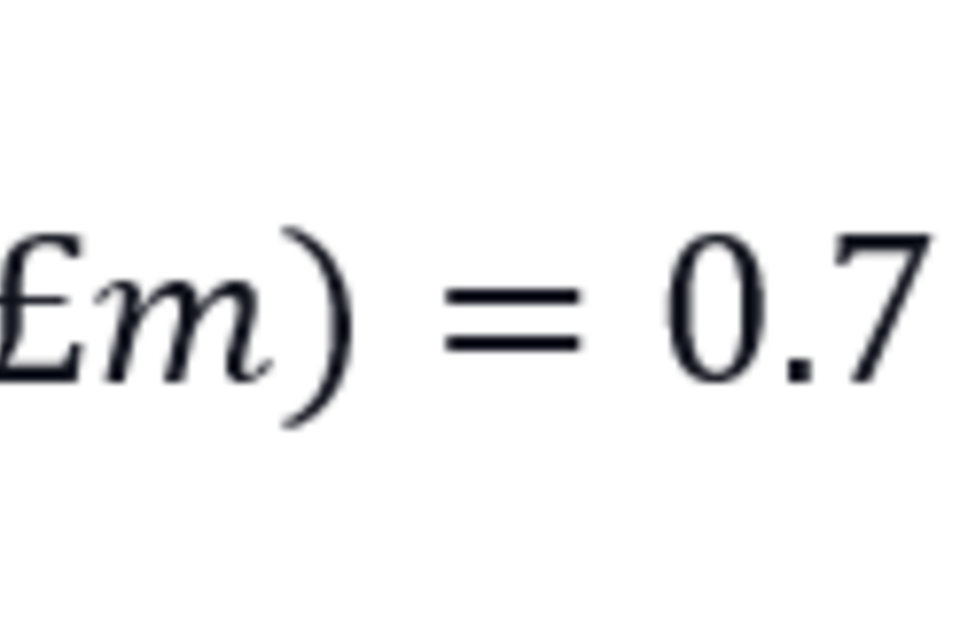
Some local authorities overlap multiple LEP regions. Where this was the case, an equal distribution of that local authorities’ population across the LEP regions it overlaps with has been assumed.
Step E5: Distribute 30% of regional LEP allocations to local authorities within each region, according to a needs-based index.
The Community Renewal Fund (CRF) prioritisation of places index is used to measure need. The CRF index was produced in 2021. To use the latest data available to measure need, the index has been updated. Alongside this update, one further technical change is made. The CRF index produced in 2021 used the latest data available at the time for each metric, which provided a ‘snapshot’ of places characteristics. Some of the datasets now relate to post-2019 and potentially capture the impacts of Covid, such as metrics for skills and unemployment. These impacts may have caused spikes in the data, which may not be representative of changes to places levels of need. Therefore, as part of the update, two-year averages for those metrics where the newly released datasets cover the post-2019 period (i.e., post-Covid) is used. This provides a more realistic picture of places’ level of need and helps capture some of the impacts of Covid.
The metrics that form the CRF index align appropriately with the objectives of UKSPF to support the UK government’s wider commitments to level up all parts of the UK.
See further detail on the methodology for constructing the CRF index.
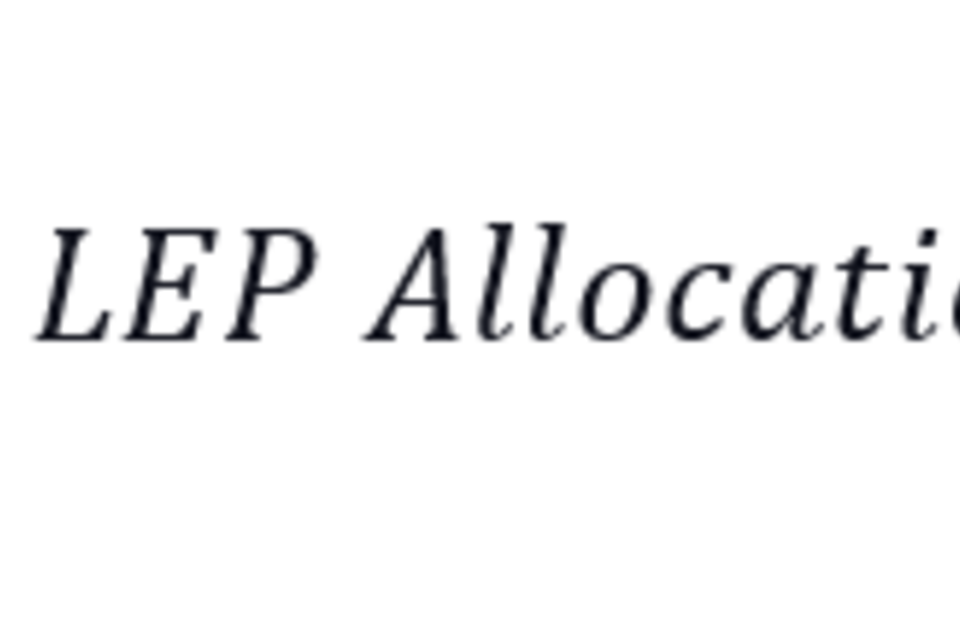
The CRF index is scaled and augmented for each of the four parts of the UK so that index scores lie between 0 and 100 within each of England, Scotland, Wales, and Northern Ireland, where 0 is the ‘best-performing’ local authority and 100 is the ‘worst-performing’. The intuition is that local authorities performing on the higher end of the scale are allocated more index-based funding. Each local authority’s scaled index score is then weighted by its population to create an adjusted index score. This is to ensure that two local authorities (in the same LEP) with very similar index scores, but significantly different populations, receive very similar allocations per head, but that their overall index-based allocation reflects their differences in population.
The adjusted index scores are used to allocate the remaining 30% of the LEPs allocation. The formula is given by:
Step E6: Allocate additional funding to local authorities who are allocated less than £1 million of core UKSPF over the SR period.
Finally, a viable minimum floor is identified to be desirable to avoid small allocations that mean local authorities can’t deliver meaningful projects. A floor of £1m of core UKSPF allocations over the SR period was chosen. Therefore, an additional step is introduced to allocate additional funding to any local authority who, through the above steps, have been allocated less than £1m of core UKSPF over the SR Period. This applies to each delivery geography, i.e., if a council that is part of an MCA would receive less than £1m over the SR, its allocation is not topped up since the MCA allocation will exceed £1m.
This means that every local authority will receive at least £1m in UKSPF funding over the SR period and increases England’s quantum by £22m. The additional quantum required for the floor is accommodated for using DLUHC departmental budgets.
Table 7: Final UKSPF elements (£m)
| UKSPF element | 22-23 | 23-24 | 24-25 | Total |
|---|---|---|---|---|
| Core UKSPF | 250 | 500 | 1332 | 2082 |
| Multiply | 130 | 150 | 150 | 430 |
| Centrally retained Multiply | 49 | 40 | 40 | 129 |
| Total | 429 | 690 | 1,522 | 2,641 |
Totals may not sum due to rounding. This includes the additional funding from the £1 million floor, as described in step E6.
Local allocations in Wales
The local allocation approach comprises the following steps:
Step W1: Distribute 40% of the Welsh allocation to local authorities according to population.
Step W2: Distribute 30% of the Welsh allocation to local authorities according to the CRF index.
Step W3: Distribute 30% of the Welsh allocations to local authorities according to Welsh Indices of Multiple Deprivation (WIMD).
Having allocated funding at the National level, steps W1, W2 and W2 distributes funding to constituent local authorities within Wales. 40% of the funding is distributed based on local authority population size (a ‘per capita’ basis), 30% is distributed using the need-based index as was developed for the UK Community Renewal Fund, which was designed as a precursor to the UKSPF, and 30% is distributed according to the Welsh Index of Multiple Deprivation.
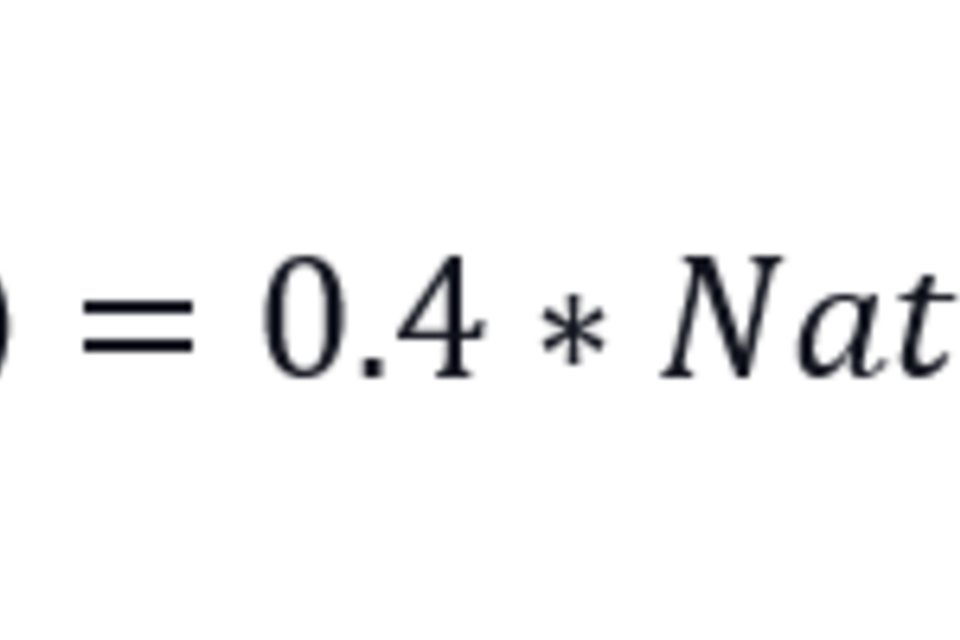
Step W1: Distribute 40% of the Welsh allocation according to population.
ONS mid-2020 population statistics at the local authority level is used to calculate the per-capita portion of places’ allocations.
The formula is as follows:
Step W2: Distribute 30% of the Welsh allocation according to the CRF index.
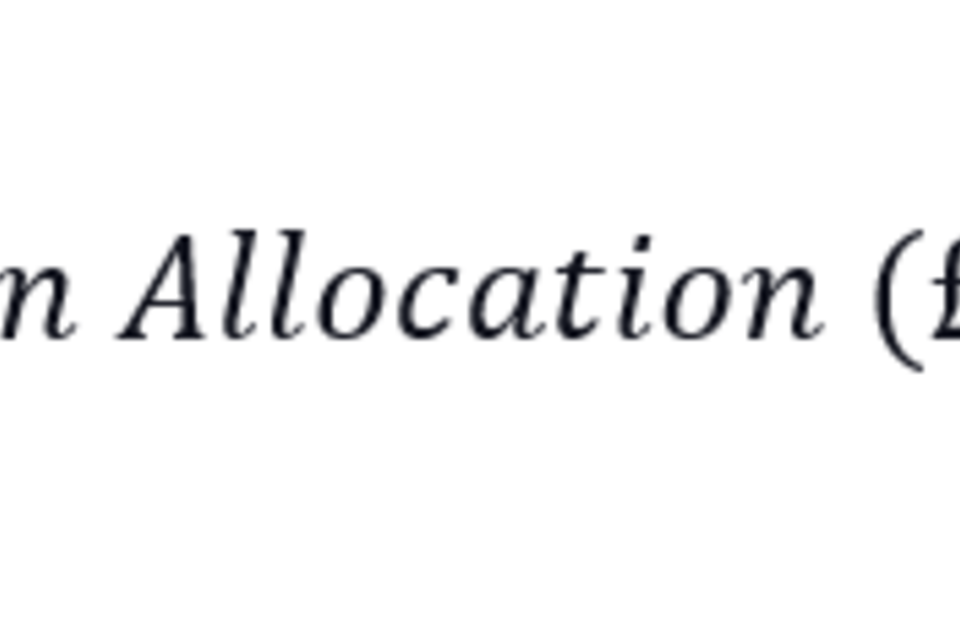
The CRF Index is used to calculate the needs-based portion of places’ allocations in Wales. This follows the same approach and formulae as England, regarding the scaling and population adjustment of the index.
The formula is as follows:
Step W3: Distribute 30% of the Welsh allocation according to the Welsh Index of Multiple Deprivation (WIMD).
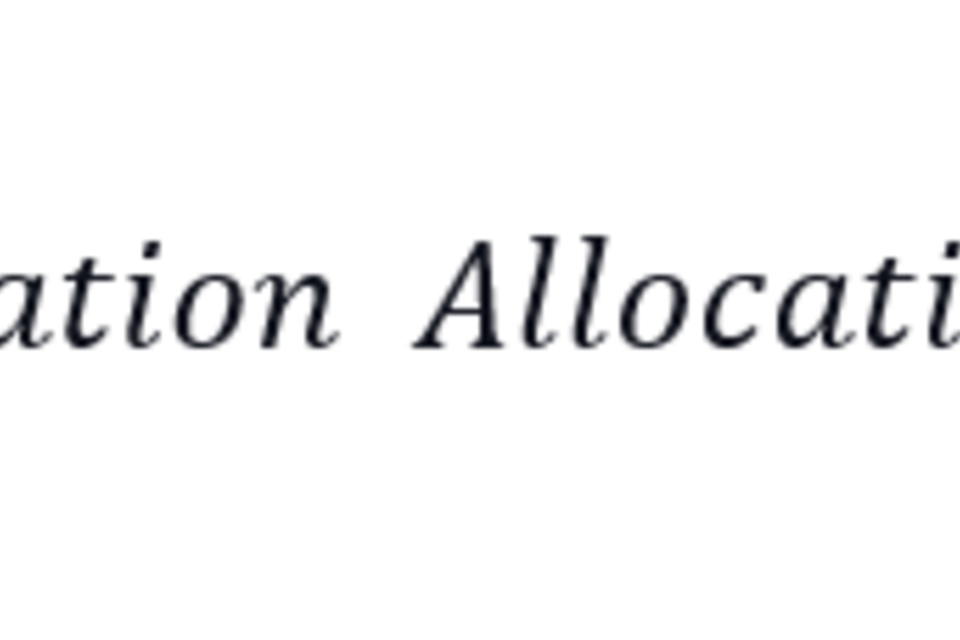
The WIMD is used to allocate 30% of Wales’s national allocation to individual local authorities. The WIMD local authority rankings are used (source: gov.wales). The same scaling adjustment as for the CRF index is used; but for the WIMD, a local authority’s index score has not been weighted by population. The CRF index – which has been used for England, Scotland and Wales – was weighted by population size to ensure that the index score drives per capita allocation levels, rather than total allocation levels. This is to ensure that places with similar rankings on the index, but significantly different populations, receive similar allocations per head, but their overall allocation reflects their differences in population. However, WIMD is only being used in Wales, where there are a smaller number of local authorities with smaller variations in populations.
The rationale for pursuing this approach rests on two aspects:
- First, a commitment to co-produce and co-design with the Welsh Government, who advocated for an approach that incorporated the IMD.
- Secondly, it rests on the acknowledgement that stakeholders in Wales have a much better picture of the local situation than is known in Whitehall – therefore, this approach is recommended as it aligns with local feedback.
The formula is as follows:
Each local authority in Wales is allocated more than £1m of Core UKSPF over the SR period, so an additional top up allocation is not required.
Local allocations in Scotland
The local allocation comprises the following steps:
Step S1: Distribute 60% of the Scottish allocation to local authorities according to population.
Step S2: Distribute 30% of the Scottish allocation to local authorities according to a needs-based index.
Step S3: Distribute 10% of the Scottish allocations to local authorities according to population density.
Having allocated funding at the Scotland level, steps S1, S2 and S3 distributes funding to constituent local authorities within Scotland. 60% of the funding is distributed based on local authority population size (a ‘per capita’ basis), 30% is distributed using the need-based index as was developed for the UK Community Renewal Fund, which was designed as a precursor to the UKSPF. And 10% is distributed using population density. The CRF Index has been updated to reflect the latest data where available. Further details on the updated index will be published in due course. The 60:30:10 split has been chosen to ensure that funding could be weighted toward those areas most in need of greater funding levels, while maintaining a level of continuity with the EU funds that the UKSPF is replacing, to minimise the size of funding gaps as during transition from an EU-led regime to a UK government-led one.
The 10% population density split reflects how Scotland’s population is spread over a large geographic area, with population sparsity and super sparsity areas. In such places, the cost of delivering services (in this case, UKSPF interventions) is higher, so there is a need to reflect the additional challenge of population spread in the allocation methodology. This has been achieved by distributing 10% of Scotland’s total allocations based on a metric that measures relative population density across Scotland.
This means that 70% of the fund will be distributed based on a population-centric basis in Scotland, with 60% on pure population and 10% targeted towards areas of low population density. Although there is a measure of population density within the CRF index, it is proposed that the CRF index remains unchanged. This maintains the integrity of the CRF index as a needs-based framework while allowing recognition of the additional need to reflect rurality in Scotland.
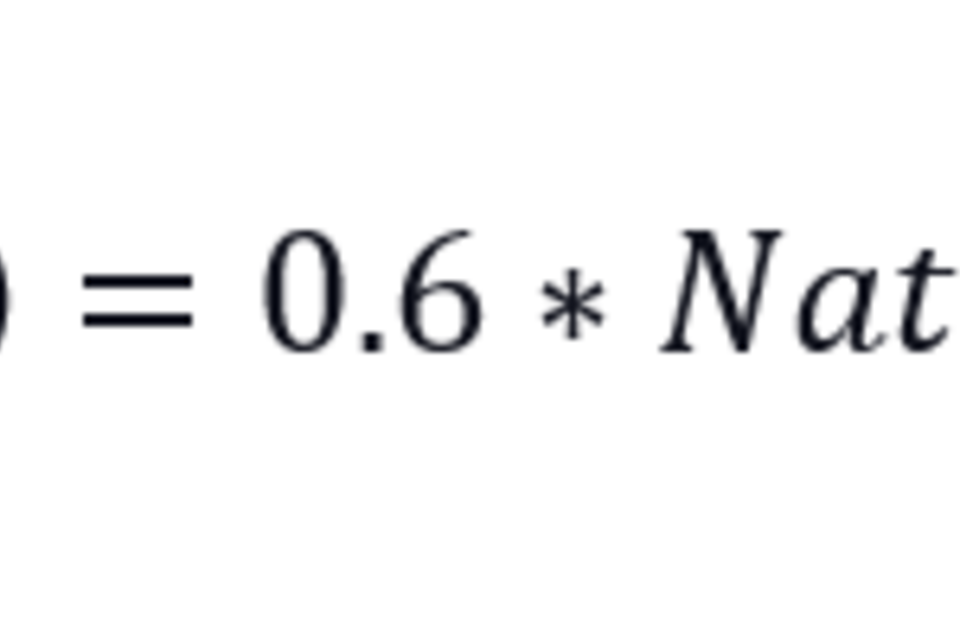
Step S1: Distribute 60% of the Scottish allocations according to population.
ONS mid-2020 population statistics at the Local Authority level is used to calculate the per-capita portion of places’ allocations. The formula is as follows:
Step S2: Distribute 30% of the Scottish allocation according to a needs-based index:
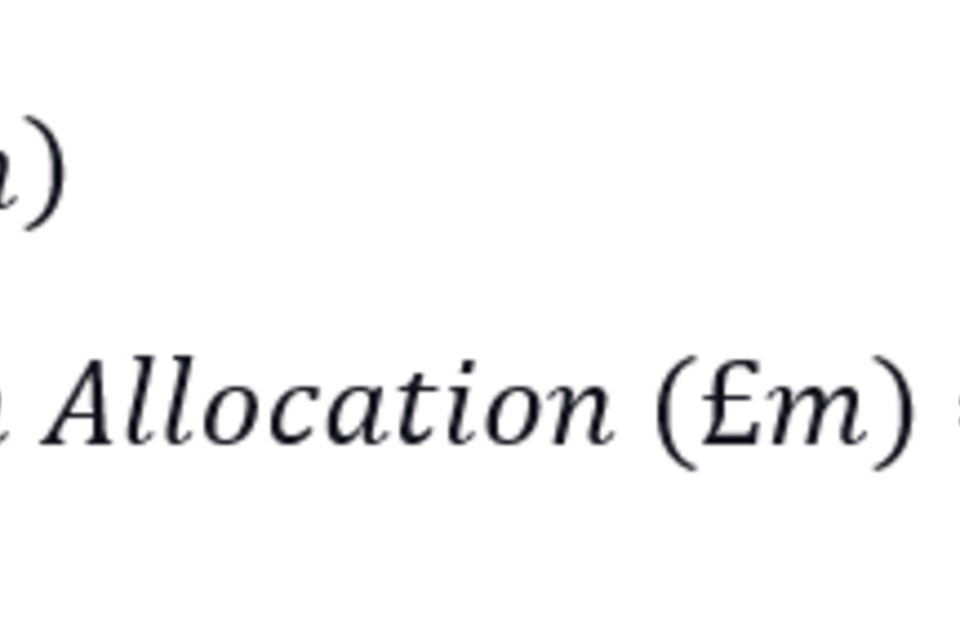
The updated and augmented CRF Index is used to calculate the needs-based portion of places’ allocations in Scotland. This follows the same approach and formulae as England, regarding the scaling and population adjustment of the index.
The formula is given by:
Step S3: Distribute 10% of the Scottish allocation according to population density.
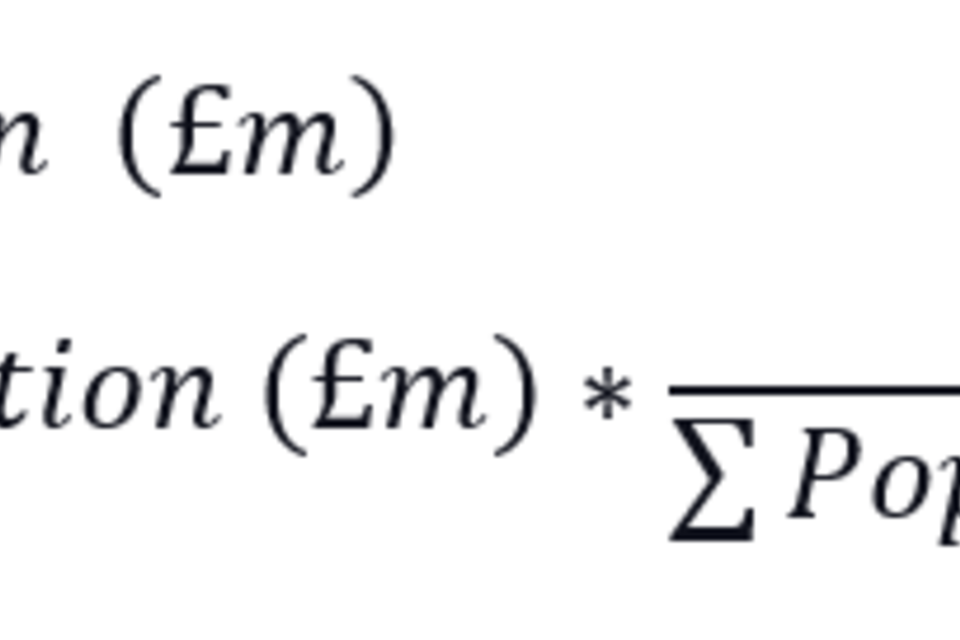
To account for the additional challenge of population spread, the metric of those aged 16-64 per squared km of land area is used in the allocation methodology. The metric is constructed using ONS mid-2020 population statistics and estimates of land area from the ONS’ Open Geography Portal. The metric provides the basis for estimating the relative population density of places in Scotland. As with the CRF Index, the metric is scaled between 0 to 100. More rural areas score higher on the scale and allocated a more significant portion of the population-density-based allocation. The formula is as follows:
Each local authority in Scotland is allocated more than £1m of Core UKSPF over the SR period, so an additional top up allocation is not required.
