Child and Working Tax Credits Finalised Annual Awards 2019 to 2020 Main Commentary
Published 29 July 2021
What are tax credits?
Tax credits are a flexible system of financial support designed to deliver support as and when a family needs it, tailored to their specific circumstances.
The system, introduced in 2003, forms part of wider government policy to provide support to parents returning to work, reduce child poverty and increase financial support for families. The flexibility of the design of the system means that as families’ circumstances change, so does (daily) entitlement to tax credits. This means tax credits can respond quickly to families’ changing circumstances providing support to those that need it most.
Tax credits are based on household circumstances and can be claimed jointly by members of a couple, or by single adults. Entitlement is based on the following factors:
- age
- income
- hours worked
- number and age of children
- childcare costs
- disabilities
For further information about who can claim please refer to the benefits page on GOV.UK.
These statistics focus on the number of families benefiting from tax credits in England, Scotland, Wales and Northern Ireland in the 2019 to 2020 tax year.
It also presents a breakdown of families by their profile position, age and gender, type of family and family size, including the families benefitting from different elements of tax credits. It also covers the number of children in benefiting families broken down by their age.
Main Headlines
In 2019 to 2020, there were approximately:
- 2.5 million families claiming Child Tax Credit (CTC) and/or Working Tax Credit (WTC). This is a fall of approximately 761,000 when compared to a year earlier.
- 4.8 million children in tax credit claiming families. This is a fall of approximately 1.29 million when compared to a year earlier.
Figure A: Number of families claiming tax credits since April 2007 to 2008
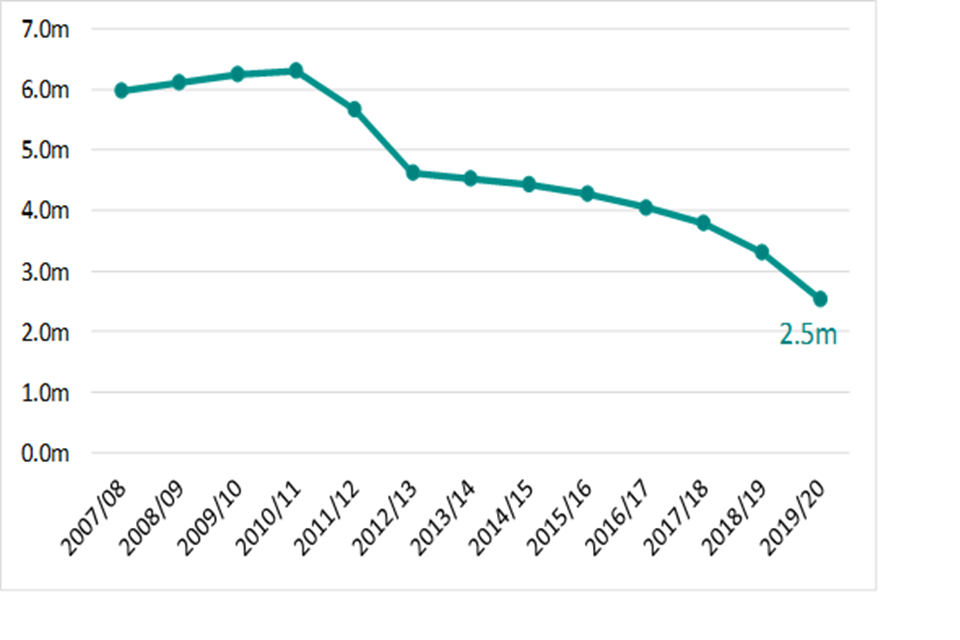
Figure A shows the number of families claiming tax credits between April 2007 to April 2020. After peaking in April 2011, the number of claimants has fallen every year and in 2019 to 2020 the number of people claiming stood at 2.5 million.
Figure B: Breakdown of tax credits population
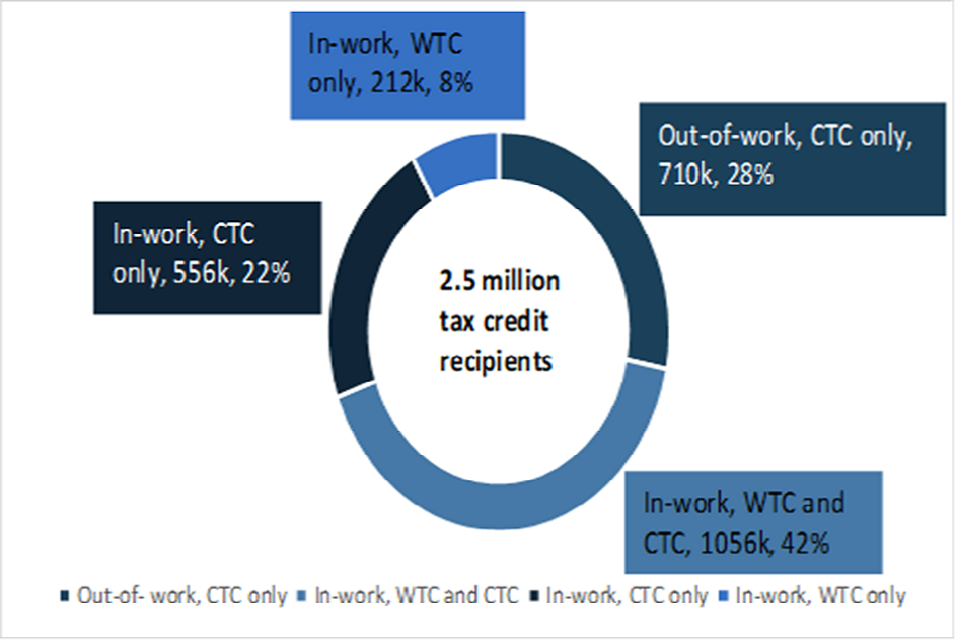
Figure B shows a breakdown of tax credits population. 28% are out-of-work claiming CTC only, 8% are in-work claiming WTC only, 22% are in-work claiming CTC only and 42% are claiming both.
Figure C: Families and children in each country or English region
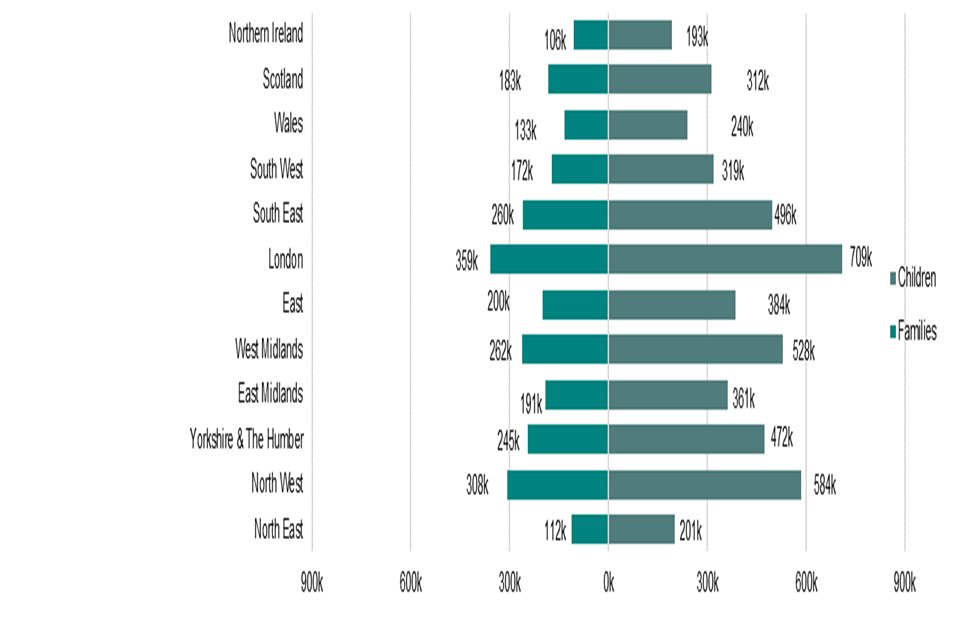
Figure C shows the number of families and children in each country or English region claiming tax credits. London had the most amount of families and children claiming tax credits in 2019 to 2020 whilst Northern Ireland had the least. A full breakdown can be found in the Geographical Data Tables.
HMRC Consultation on Official Statistics
HMRC launched a wide-ranging consultation on a range of statistics on 8 February 2021.
This includes changes to a number of tax credits statistics releases and more details are given in the consultation. Any changes to the tax credit releases will take into account user feedback which we will respond to after the consultation.
A formal review of our National and Official Statistics publications was held between May and August 2011. Over 130 responses were received from a broad range of users. A report summarising the responses received has been published.
Summary of main aggregates
Based on finalised awards, the average number of benefiting families[footnote 1] (millions) during the 12-year period to 2019 to 2020 were:
| 2009-10 | 2010-11 | 2011-12 | 2012-13 | 2013-14 | 2014-15 | 2015-16 | 2016-17 | 2017-18 | 2018-19 | 2019-20 | |
|---|---|---|---|---|---|---|---|---|---|---|---|
| Total out-of-work families (all with children) | 1.48 | 1.46 | 1.45 | 1.48 | 1.40 | 1.31 | 1.24 | 1.19 | 1.12 | 0.97 | 0.71 |
| In-work families with children receiving more than the family element | 2.61 | 2.70 | 2.69 | [no data] | [no data] | [no data] | [no data] | [no data] | [no data] | [no data] | [no data] |
| In-work families with children receiving the family element or less | 1.67 | 1.61 | 1.00 | [no data] | [no data] | [no data] | [no data] | [no data] | [no data] | [no data] | [no data] |
| In-work families with children | 4.28 | 4.30 | 3.69 | 2.63 | 2.62 | 2.61 | 2.56 | 2.46 | 2.32 | 2.05 | 1.61 |
| In-work families with no children (receiving WTC only) | 0.48 | 0.54 | 0.54 | 0.51 | 0.51 | 0.51 | 0.48 | 0.40 | 0.34 | 0.28 | 0.21 |
| Total in-work families | 4.76 | 4.85 | 4.23 | 3.14 | 3.13 | 3.12 | 3.04 | 2.86 | 2.66 | 2.33 | 1.82 |
| Total number of families benefitting | 6.25 | 6.31 | 5.67 | 4.62 | 4.53 | 4.43 | 4.28 | 4.05 | 3.79 | 3.30 | 2.53 |
And the total number of benefiting families[footnote 1] (thousands), those whose entitlements were higher because of certain tax credit elements were:
| 2009-10 | 2010-11 | 2011-12 | 2012-13 | 2013-14 | 2014-15 | 2015-16 | 2016-17 | 2017-18 | 2018-19 | 2019-20 | |
|---|---|---|---|---|---|---|---|---|---|---|---|
| Families for which entitlements were higher because of the childcare element | 460 | 455 | 455 | 416 | 392 | 396 | 387 | 369 | 347 | 303 | 225 |
| Families for which entitlements were higher because of the disabled worker element | 115 | 119 | 117 | 117 | 116 | 121 | 125 | 121 | 115 | 104 | 89 |
| Families for which entitlements were higher because of the baby addition to family element (out-of-work families) | 167 | 165 | [no data] | [no data] | [no data] | [no data] | [no data] | [no data] | [no data] | [no data] | [no data] |
| Families for which entitlements were higher because of the baby addition to family element (in-work families) | 387 | 385 | [no data] | [no data] | [no data] | [no data] | [no data] | [no data] | [no data] | [no data] | [no data] |
Section 1: Time Series
Section 1 provides statistics on the history of the tax credits system, between 2012 to 2013 and 2019 to 2020. This enables comparison across time, across different tax credits populations and describes how various parts of the system have changed over time.
Figure 1.1: Number of families receiving different amounts of tax credits

Figure 1.1 shows that, since 2012 to 2013, the number of families receiving tax credits has fallen in every year. The total number of families claiming tax credits in these years decreased as a result of policy changes announced in 2010 and the introduction of Universal Credit (UC) in 2013.
The rollout of UC to all areas of the country was completed on 12 December 2018 for new claims or for people having to make a new claim due to a change of circumstance.
In 2019 to 2020, the total number of families claiming tax credits stood at 2.5 million families.
The rate of decline in the number of families receiving tax credits increased in 2019 to 2020, largely due to the roll out of UC. From 1 January new claims for tax credits were closed except for a small number of cases[footnote 2] .
The number of in-work families claiming both WTC and CTC, which are awards with a higher average entitlement, was relatively stable between 2012 to 2013 and 2015 to 2016. Subsequent years show a fall in the number of families claiming WTC and CTC and in 2019 to 2020 it stood at 1.06 million.
Ahead of April 2012, the family element of CTC (£545) was protected until household income reached the second income threshold. After April 2012, the removal of the second income threshold meant families previously claiming the family element of CTC were tapered at a rate of 41% for every £1 of income over the first threshold immediately after all other credits had been withdrawn.
The previous categories of the CTC family element were removed and replaced by a single “CTC only” category. In 2019 to 2020, this stood at 556,000 families.
The trend in the numbers of in-work families without children - those claiming WTC only – has gradually fell since 2013 to 2014. In 2019 to 2020, in-work families claiming WTC only stands at 210,000.
The numbers of out-of-work families claiming CTC only had shown a slow but steady decrease since 2012 to 2013, from 1.48 million to 710,000 in 2019 to 2020, having remained relatively steady before that.
Figure 1.2: Annual entitlement by type of Tax Credit received
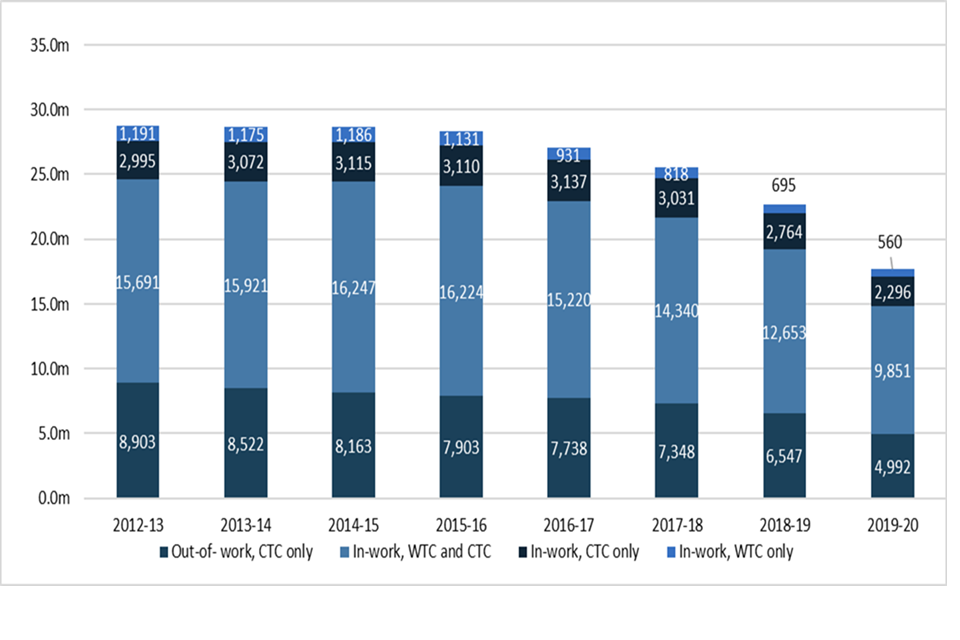
Figure 1.2 shows that, between 2012 to 2013 and 2015 to 2016 annual entitlement to tax credits remained fairly stable. From 2015 to 2016, where entitlement stood at £28.37 billion, annual entitlement has now fallen to just below £17.70 billion in 2019 to 2020.
Out-of-work families claiming the full amount of CTC and in-work families claiming both WTC and CTC make up the largest proportion of total entitlement.
From 2008 to 2009 to 2019 to 2020, families claiming both WTC and CTC accounted for approximately 56% (varying slightly between 55% and 57%) of the total entitlement while the entitlement of out-of-work families fluctuated slightly between 27% to 31% and stood at 28% in 2019 to 2020.
Section 2: Summary
Section 2 summarises the main characteristics of tax credits population in 2019 to 2020 at the while Section 3 gives a more detailed breakdown.
Figure 2.1: Composition of families receiving different types of tax credits
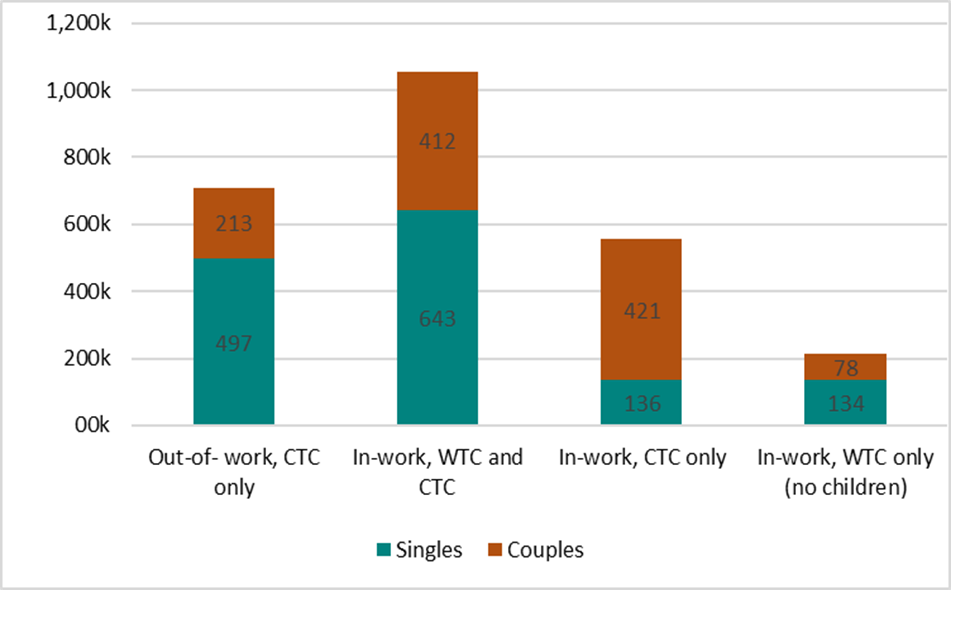
Figure 2.1 shows that the majority of single people with children receive either the full award of CTC (when out-of-work) or WTC and CTC (when in-work).
In 2019 to 2020, there were 136,000 in-work single parent families claiming CTC only. The pattern for couples is less clear with the largest grouping in-work receiving CTC only followed by those in work receiving WTC and CTC. A majority (63%) of families with no children (claiming WTC only) are single recipients.
Figure 2.2: Recipient families: proportion of families receiving each type of award

Figure 2.2 shows that 28% of families claiming tax credits are out-of-work, and claiming CTC only. 42% of families are in-work and claim both WTC and CTC. 22% are in-work and claim CTC only while 8% of families are in-work and claim WTC only.
Figure 2.3 Number of children in families receiving tax credits
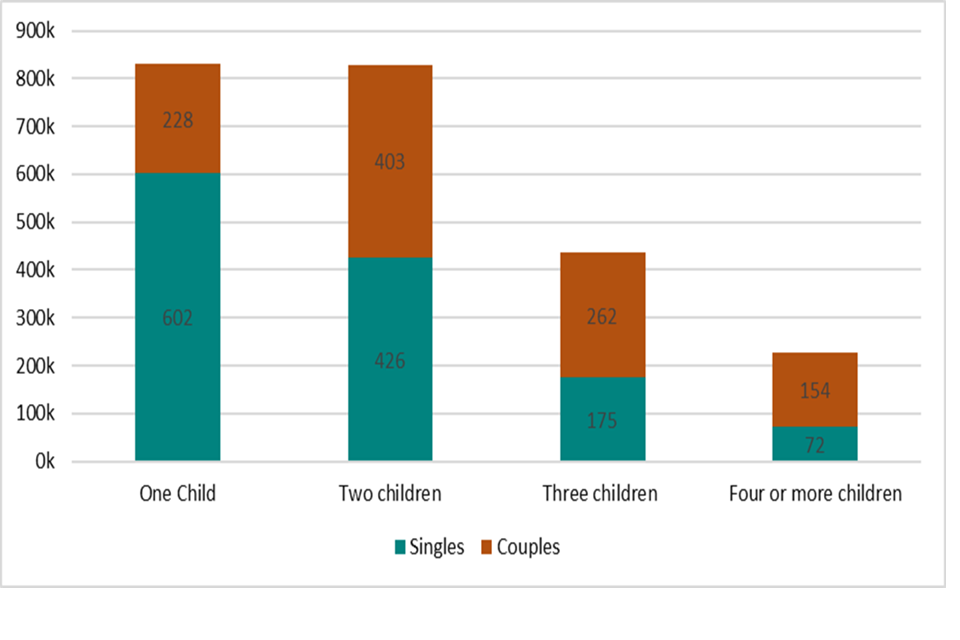
Figure 2.3 shows that the majority of families with children are made up of either one or two children with single parent families more likely to have one child than couples do. Couples are more likely to have larger family sizes. Out of approximately 226,000 families with four or more children, 68% are couples.
Figure 2.4 Average annual entitlement, by entitlement band

Figure 2.4 shows that the largest proportion of families’ (43%) entitlement are of the value of £7,000 and over, followed by families with an entitlement between £6,000 to £6,999 (15%).
Section 3: Detailed figures
Section 3 focuses on detailed breakdowns of the tax credits population. It reports the numbers of families entitled to specific elements within tax credits and gives more detailed information on levels of income.
Figure 3.1: Childcare costs (per week)
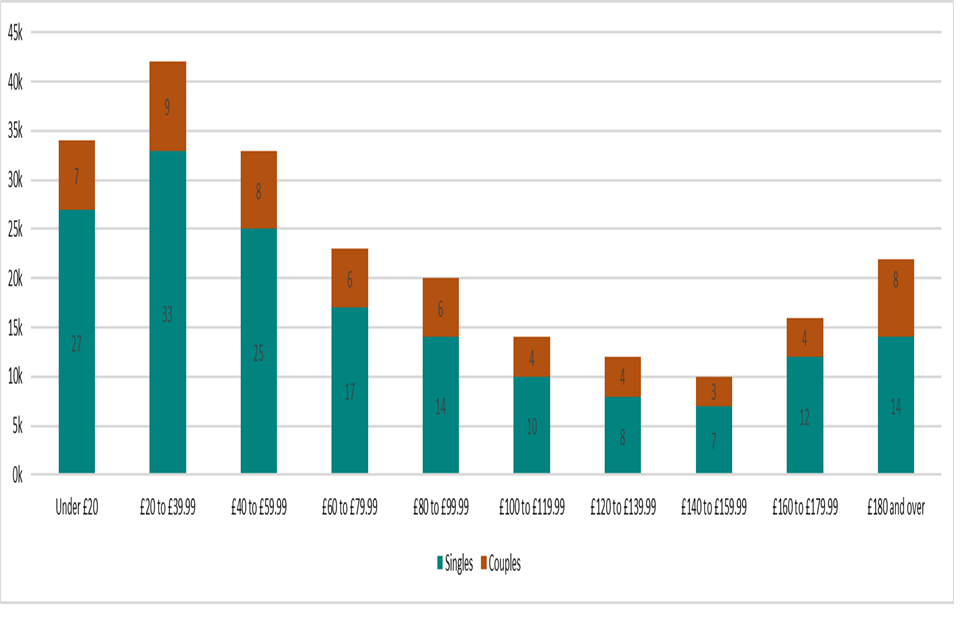
Figure 3.1 shows the average weekly support with childcare costs for single parent families and couples. The costs are broadly split across the cost bands for each of the categories, reflecting the range hours of childcare claimed. The largest category for both lone-parents and couples is £20 to £39.99.
Figure 3.2 Average number of in-work benefiting families in each band of income
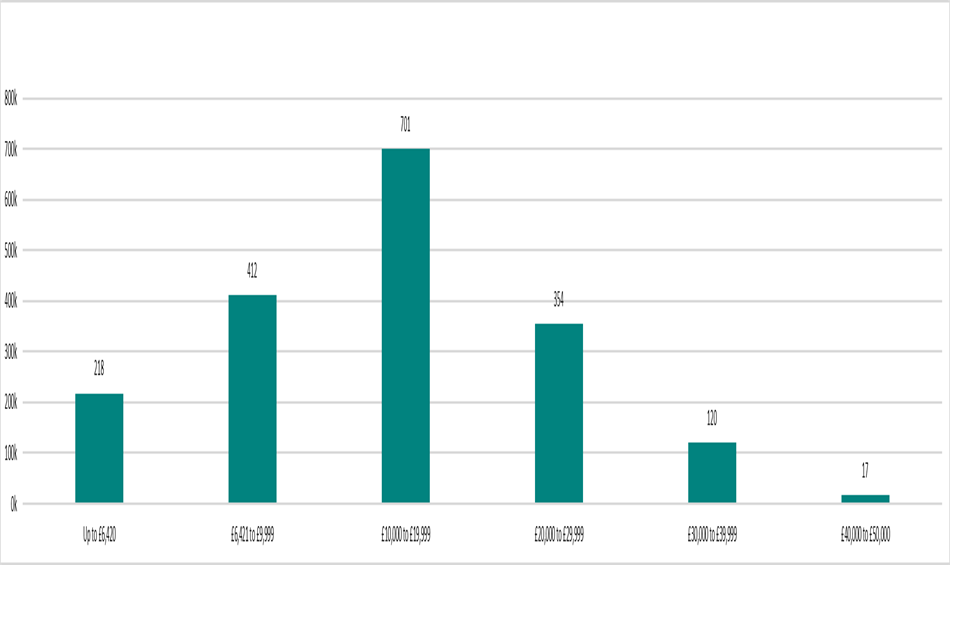
Figure 3.2 shows the average number of families benefitting from tax credits in each band of income up to £50,000. Broadly speaking, the higher the income used to taper the award, the fewer the numbers of families in receipt - reflecting the targeted approach to financial support inbuilt in the tax credits system.
A National Statistics Publication
National Statistics are produced to high professional standards as set out in the Code of Practice for Official Statistics. They undergo regular quality assurance reviews to ensure that they meet customer needs. They are produced free from any political interference.
The United Kingdom Statistics Authority has designated these statistics as National Statistics, in accordance with the Statistics and Registration Service Act 2007 and signifying compliance with the Code of Practice for Official Statistics.
Designation can be broadly interpreted to mean that the statistics:
- meet identified user needs;
- are well explained and readily accessible;
- are produced according to sound methods;
- are managed impartially and objectively in the public interest;
- are produced to the highest standard, ensuring that data confidentiality has been maintained
Once statistics have been designated as National Statistics it is a statutory requirement that the Code of Practice shall continue to be observed.
For general enquiries about National Statistics, contact the National Statistics Public Enquiry Service on:
Tel: 0845 601 3034
Overseas: +44 (01633) 653 599
Minicom: 01633 812 399
E-mail: info@statistics.gov.uk
Fax: 01633 652 747
Letter: Customer Contact Centre, Room 1.101, Government Buildings, Cardiff Road, Newport, South Wales, NP10 8XG.
You can also find National Statistics on the internet.
Appendix A: Technical Note
Using finalised awards data
The figures for 2019 to 2020 in the tables are mostly derived from a scan of the tax credits computer system taken in early April 2020. For each award, the scan contained a record for each sub-period of the year for which the family’s circumstances (adult partners, hours worked, number of children, childcare costs, disabilities) remained unchanged.
For each such sub-period, the scan revealed the various elements for which the family qualified for the period, and the daily monetary value of the childcare element. It also revealed the values of the 2018 to 2019 and 2019 to 2020 incomes for each award.
For each award, and for each sub-period, the daily rate of entitlement was then modelled by summing the various element values to which the family was entitled and tapering the total away using the income data . The modelled daily entitlement was then used to establish where on the plateau - taper profile the family fell for that period. A small number (under 1 per cent) of tax credits awards were not included in the scan.
For each case covered by the scan, and for each sub-period, it was possible to compare the modelled entitlement with that held on the computer system. For all but about 0.1 per cent of cases the discrepancy was at most 2p per day.
The scan did not cover out of work families who received their child support via Income Support or income-based Jobseeker’s Allowance (IS-JSA) rather than CTC. A scan of such families at August 2008 was obtained from the Department for Work and Pensions. This contained sufficient information to distinguish single parents from couples.
The number and ages of the children were obtained from the Child Benefit records for these families who were still receiving their child support through IS-JSA at August 2017. The level of entitlement at August 2017 was modelled using this information, which however could not include the disabled child or severely disabled child premium.
To produce annual averages to be added to the annual CTC averages, the August 2017 aggregates were scaled by a factor needed to produce a separately-estimated overall average for the year. The annualised August 2017 entitlements were also scaled to agree with the separately known total of expenditure via benefits for these families.
Interpreting annual entitlement
The calculation of the annual entitlement for an award also yields a value of the entitlement for each day of the year. This can vary within the year as the family’s circumstances vary. In addition, awards can end during the year (for example, as couples separate, or as families cease to satisfy the qualifying conditions listed above), and other awards start during the year.
The tables show annual average numbers of benefiting families with particular characteristics that is, the average taken over all days in the year.
Their aggregate annual entitlement (in £ million) is the sum, taken over all days in the year, of the daily entitlements of families with these characteristics on the day. Their average annualised entitlement (in £) is 366 times the average, taken over all days in the year, of the aggregate daily entitlement of these families.
Current entitlement
There is a single claim form covering both Child and Working Tax Credits, and entitlement is calculated jointly. Awards run to the end of the tax year, and are based on the element values, thresholds, etc shown at Appendix B.
An annual award is calculated by summing the various elements to which the family is entitled. Unless the family is receiving Income Support, income-based Jobseeker’s Allowance or Pension Credit, this sum is reduced if the family’s annual income (see below) exceeds the relevant first income threshold. The reduction is 41 per cent of the excess over the threshold.
Appendix B: Annual entitlement (£) by tax credit elements and thresholds:
| 2009-10 | 2010-11 | 2011-12 | 2012-13 | 2013-14 | 2014-15 | 2015-16 | 2016-17 | 2017-18 | 2018-19 | 2019-20 | |
|---|---|---|---|---|---|---|---|---|---|---|---|
| Child Tax Credit | |||||||||||
| Family element | 545 | 545 | 545 | 545 | 545 | 545 | 545 | 545 | 545 | 545 | 545 |
| Family element, baby addition [footnote 3] | 545 | 545 | [no data] | [no data] | [no data] | [no data] | [no data] | [no data] | [no data] | [no data] | [no data] |
| Child element [footnote 4] | 2,235 | 2,300 | 2,555 | 2,690 | 2,720 | 2,750 | 2,780 | 2,780 | 2,780 | 2,780 | 2,780 |
| Disabled child additional element [footnote 5] | 2,670 | 2,715 | 2,800 | 2,950 | 3,015 | 3,100 | 3,140 | 3,140 | 3,175 | 3,275 | 3,355 |
| Severely disabled child element [footnote 6] | 1,075 | 1,095 | 1,130 | 1,190 | 1,220 | 1,255 | 1,275 | 1,275 | 1,290 | 1,325 | 1,360 |
| Working Tax Credit | |||||||||||
| Basic element | 1,890 | 1,920 | 1,920 | 1,920 | 1,920 | 1,940 | 1,960 | 1,960 | 1,960 | 1,960 | 1,960 |
| Couples and lone parent element | 1,860 | 1,890 | 1,950 | 1,950 | 1,970 | 1,990 | 2,010 | 2,010 | 2,010 | 2,010 | 2,010 |
| 30 hour element [footnote 7] | 775 | 790 | 790 | 790 | 790 | 800 | 810 | 810 | 810 | 810 | 810 |
| Disabled worker element | 2,530 | 2,570 | 2,650 | 2,790 | 2,855 | 2,935 | 2,970 | 2,970 | 3,000 | 3,090 | 3,165 |
| Severely disabled adult element | 1,075 | 1,095 | 1,130 | 1,190 | 1,220 | 1,255 | 1,275 | 1,275 | 1,290 | 1,330 | 1,365 |
| 50+ return to work payment:16 but less than 30 hours per week [footnote 8] | 1,300 | 1,320 | 1,365 | [no data] | [no data] | [no data] | [no data] | [no data] | [no data] | [no data] | [no data] |
| 50+ return to work payment: at least 30 hours per week | 1,935 | 1,965 | 2,030 | [no data] | [no data] | [no data] | [no data] | [no data] | [no data] | [no data] | [no data] |
| Childcare element: Maximum eligible costs allowed (£ per week) | |||||||||||
| Eligible costs incurred for 1 child | 175 | 175 | 175 | 175 | 175 | 175 | 175 | 175 | 175 | 175 | 175 |
| Eligible costs incurred for 2+ children | 300 | 300 | 300 | 300 | 300 | 300 | 300 | 300 | 300 | 300 | 300 |
| Percentage of eligible costs covered | 80% | 80% | 70% | 70% | 70% | 70% | 70% | 70% | 70% | 70% | 70% |
| Common features | |||||||||||
| First income threshold [footnote 9] | 6,420 | 6,420 | 6,420 | 6,420 | 6,420 | 6,420 | 6,420 | 6,420 | 6,420 | 6,420 | 6,420 |
| First withdrawal rate | 39% | 39% | 41% | 41% | 41% | 41% | 41% | 41% | 41% | 41% | 41% |
| Second income threshold [footnote 10] | 50,000 | 50,000 | 40,000 | [no data] | [no data] | [no data] | [no data] | [no data] | [no data] | [no data] | [no data] |
| Second withdrawal rate | 1 in 15 | 1 in 15 | 41% | [no data] | [no data] | [no data] | [no data] | [no data] | [no data] | [no data] | [no data] |
| First income threshold for those entitled to Child Tax Credit only [footnote 11] | 16,040 | 16,190 | 15,860 | 15,860 | 15,910 | 16,010 | 16,105 | 16,105 | 16,105 | 16,105 | 16,105 |
| Income increase disregard [footnote 12] | 25,000 | 25,000 | 10,000 | 10,000 | 5,000 | 5,000 | 5,000 | 2,500 | 2,500 | 2,500 | 2,500 |
| Income fall disregard [footnote 12] | [no data] | [no data] | [no data] | 2,500 | 2,500 | 2,500 | 2,500 | 2,500 | 2,500 | 2,500 | 2,500 |
| Minimum award payable | 26 | 26 | 26 | 26 | 26 | 26 | 26 | 26 | 26 | 26 | 26 |
-
Figures are taken from excel worksheet (main aggregates tab). Figures are rounded separately, which can lead to the components as shown not summing to the total. ↩ ↩2
-
New claims for tax credits are restricted to families in receipt of the severe disability premium or received it in the last month. ↩
-
Payable to families for any period during which they have one or more children aged under one. Abolished 6 April 2011. ↩
-
Payable for each child up to 31 August after their 16th birthday, and for each young person for any period in which they are aged under 20 (under 19 to 2005-06) and in full-time non-advanced education, or under 19 and in their first 20 weeks of registration with the Careers service or Connexions. ↩
-
Payable in addition to the child element for each disabled child. ↩
-
Payable in addition to the disabled child element for each severely disabled child. ↩
-
Payable for any period during which normal hours worked (for a couple, summed over the two partners) is at least 30 per week. ↩
-
Payable for each qualifying adult for the first 12 months following a return to work. Abolished 6 April 2012. ↩
-
Income is net of pension contributions, and excludes Child Benefit, Housing benefit, Council tax benefit, maintenance and the first £300 of family income other than from work or benefits. The award is reduced by the excess of income over the first threshold, multiplied by the first withdrawal rate. ↩
-
For those entitled to the Child Tax Credit, the award is reduced only down to the family element, plus the baby addition where relevant, less the excess of income over the second threshold multiplied by the second withdrawal rate. Abolished effective 6 April 2012. ↩
-
Those also receiving Income Support, income-based Jobseeker’s Allowance or Pension Credit are passported to maximum CTC with no tapering. ↩
-
Introduced from 6 April 2012, this drop in income is disregarded in the calculation of Tax Credit awards. ↩ ↩2
