Children in low income families: local area statistics, financial year ending 2024
Published 27 March 2025

© Crown copyright 2025
This publication is licensed under the terms of the Open Government Licence v3.0 except where otherwise stated. To view this licence, visit nationalarchives.gov.uk/doc/open-government-licence/version/3 or write to the Information Policy Team, The National Archives, Kew, London TW9 4DU, or email: psi@nationalarchives.gov.uk.
Where we have identified any third party copyright information you will need to obtain permission from the copyright holders concerned.
This publication is available at https://www.gov.uk/government/statistics/children-in-low-income-families-local-area-statistics-2014-to-2024/children-in-low-income-families-local-area-statistics-financial-year-ending-2024
This bulletin contains Official Statistics on the number and proportion of children living in low income families, Before Housing Costs (BHC), across the United Kingdom by local area for the financial year ending (FYE) 2024. This is an annual release and the next release will be in Spring 2026.
Feedback and queries about the statistics are welcome and can be sent to stats.consultation-2018@dwp.gov.uk.
1. Main stories
The headline statistics for this release are:
- In financial year ending (FYE) 2024, there were 2.72 million children aged 0 to 15 (22%) in families in Relative low income and 2.34 million children aged 0 to 15 (19%) in Absolute low income families across the United Kingdom
- Yorkshire and the Humber has the highest proportion of children aged under 16 in Relative low income families (30%) and South East the lowest (15%).
- Over the last year, the proportion of children in low income families has risen across all regions within the UK, with the exception of Scotland where the proportion has fallen.
- At a local level, the proportion of children aged under 16 living in Relative low income families varies greatly, ranging from 6% in Richmond upon Thames (London) to 45% in Pendle (North West)
2. What you need to know
Change in methodology
As reported in the DWP Statistical Work Programme and on GOV.UK, following the successful completion of discovery work and a period of user engagement, this release calibrates figures to HBAI single-year UK estimates (instead of HBAI two or three year regional estimates in previous annual publications). From FYE 2022, this release imputes receipt of Scottish Child Payment for eligible households so it is included as an income stream. Consequently, there are revisions to the back-series at UK, regional and local area level
Further information is available in the Background Information and Methodology on differences between these statistics and HBAI statistics at regional level, and advice on when to use each series.
A consultation paper on proposals for developing After Housing Costs measures of local area child poverty statistics has also been published alongside these statistics.
As the preferred measure amongst the majority of users, commentary in this Bulletin focuses mainly on Relative low income, however the full range of statistics for Relative and Absolute low income continue to be available in the accompanying ODS tables and Stat-Xplore.
3. Proportion of children living in low income families
Figures in this section are presented for Relative low income and for children aged under 16, unless stated otherwise. Numbers for children in Absolute low income families, including those aged 16 to 19, can be found on Stat-Xplore.
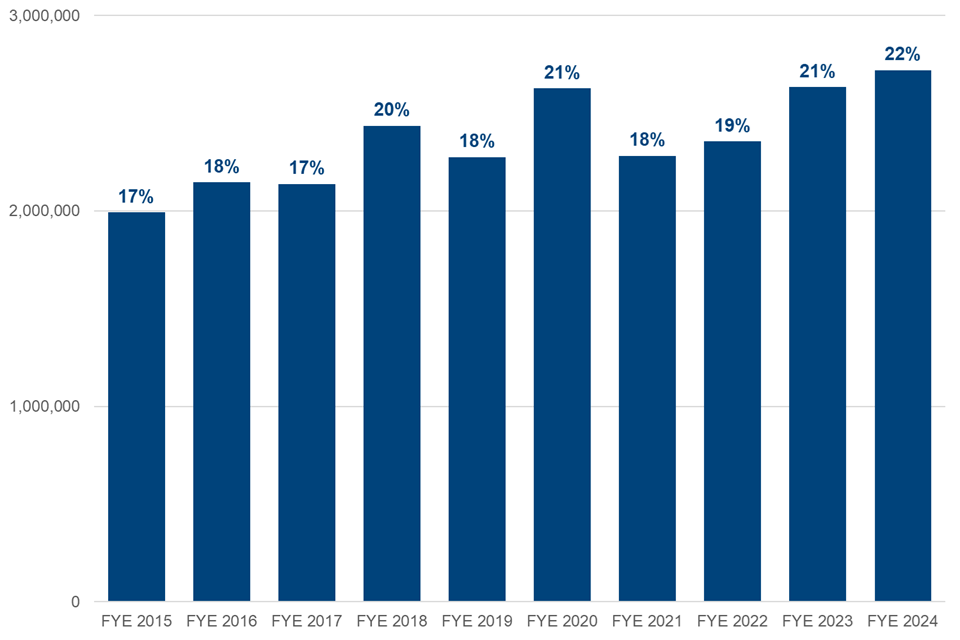
In the FYE 2024, there were 2.72 million children (aged 0 to 15) in families in Relative low income across the United Kingdom. This is an increase of 99 thousand on the previous year.
In the FYE 2024, the proportion of children aged under 16 in Relative low income families was 22%, an increase of one percentage point on the previous year and an increase of four percentage points from FYE 2019.
Number and proportion of children aged under 16 in Relative low income families United Kingdom, FYE 2015 to 2024
The proportion of children in low income families has been increasing over the last three years.
Source: DWP Stat-Xplore, Children in Low Income Families, local authority by age and ONS Nomis, Population Estimates
4. At a regional level
Proportion of children in low income families by region, United Kingdom, FYE 2023 and FYE 2024
The proportion of children in low income families has risen across all regions over the year, with the exception of Scotland where the proportion has fallen
| Region | FYE 2023 (%) | FYE 2024 (%) |
|---|---|---|
| United Kingdom | 21.1% | 21.8% |
| North East | 27.8% | 28.4% |
| North West | 26.9% | 27.8% |
| Yorkshire and The Humber | 29.4% | 30.4% |
| East Midlands | 23.3% | 24.1% |
| West Midlands | 28.6% | 29.2% |
| East of England | 17.2% | 17.8% |
| London | 16.7% | 17.8% |
| South East | 14.0% | 14.5% |
| South West | 17.3% | 18.3% |
| Wales | 23.2% | 24.0% |
| Scotland | 17.8% | 16.3% |
| Northern Ireland | 21.3% | 22.7% |
Source: DWP Stat-Xplore, Children in Low Income Families, local authority by age and ONS Nomis, Population Estimates
Yorkshire and the Humber (30%) and the West Midlands (29%) regions have the highest proportion of children in low income families. The South East (15%) and Scotland (16%) have the lowest.
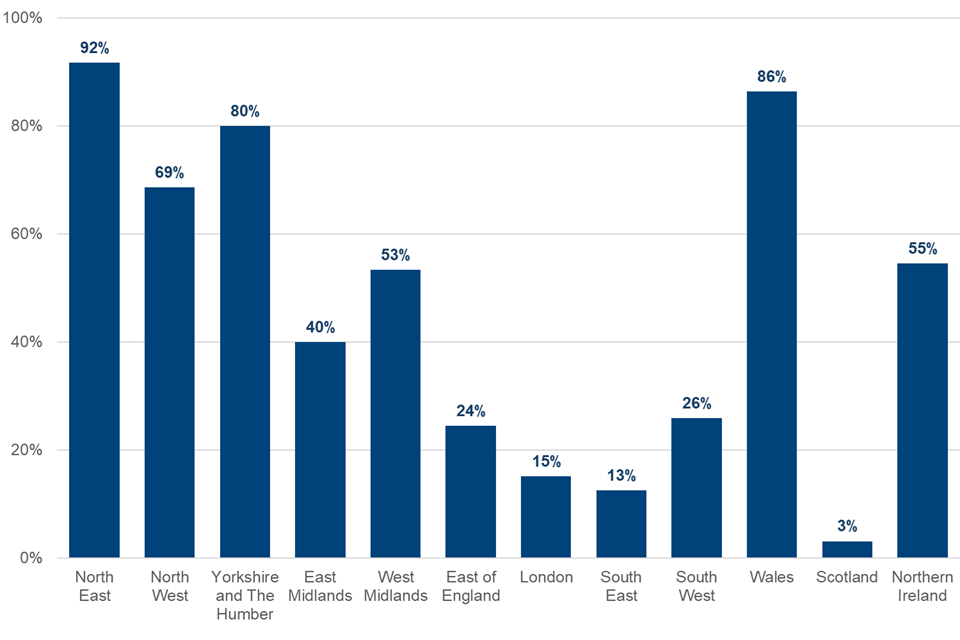
Percentage of Local Authorities where the proportion of children in Low Income families is greater than the United Kingdom average, by region, FYE 2024
In the North East, for 9 out of 10 Local Authorities the proportion of children in low income families is greater than the UK average.
Source: DWP Stat-Xplore, Children in Low Income Families, local authority by age and ONS Nomis, Population Estimates, local authority by age
While child poverty rates within regions is a useful indicator, it can mask substantial variation within countries and regions; if a region contains areas with both very high and very low rates of poverty, the average rate for that region will not reflect this variation. This is where statistics at lower levels of geography can provide valuable additional insights.
5. At a Local Authority level
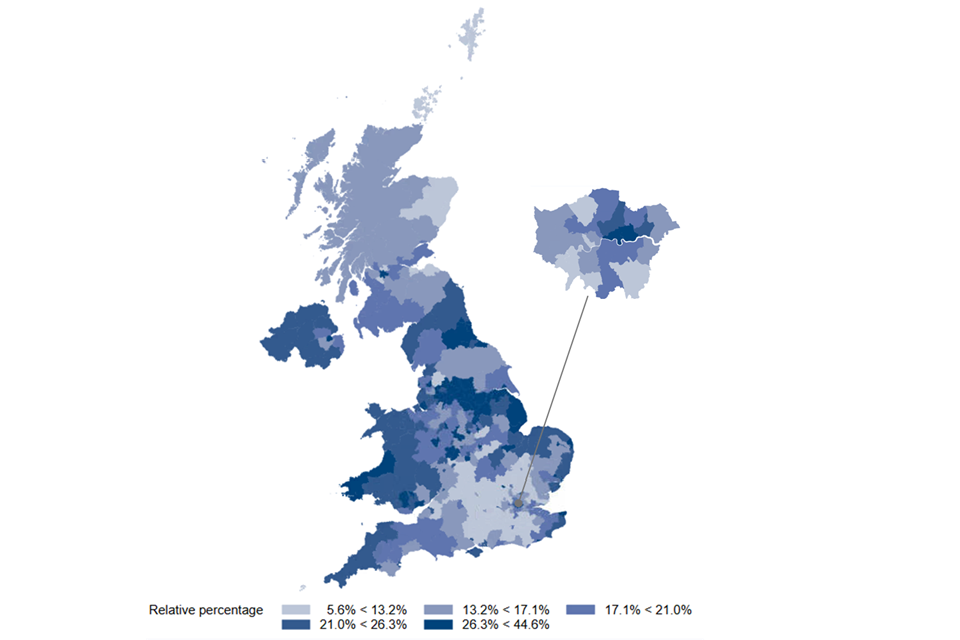
Proportion of children aged under 16 in Relative low income families by local authority (quintiles), United Kingdom, FYE 2024
At a local authority level, the proportion of children aged under 16 in relative low income families varies from 6% to 45% across the UK.
Source: DWP Stat-Xplore, Children in Low Income Families, local authority by age and ONS Nomis, Population Estimates, local authority by age
The proportion of children in low income families across local authorities is classified using quintiles where the top quintile is shown in the darkest shade, and the bottom quintile in the lightest. Group ranges are calculated to split local authorities evenly into 5 bands, so approximately 20% of local authorities fit into each group
Highest proportions
The 20 local authorities with the highest proportions of children aged under 16 in Relative low income families, United Kingdom, financial year ending 2024
Of the top 20 local authorities with the highest proportions of children in Relative low income families, nine are located in the North West.
| Local Authority | Region | Number of children | Proportion of children (%) |
|---|---|---|---|
| Pendle | North West | 9,190 | 44.6% |
| Bradford | Yorkshire and The Humber | 55,331 | 44.2% |
| Oldham | North West | 23,957 | 42.9% |
| Birmingham | West Midlands | 107,183 | 41.7% |
| Blackburn with Darwen | North West | 14,872 | 41.6% |
| Manchester | North West | 46,986 | 40.7% |
| Middlesbrough | North East | 12,541 | 40.4% |
| Hyndburn | North West | 6,789 | 40.2% |
| Burnley | North West | 7,851 | 40.0% |
| Stoke-on-Trent | West Midlands | 21,338 | 39.7% |
| Leicester | East Midlands | 31,055 | 39.5% |
| Nottingham | East Midlands | 23,350 | 38.8% |
| Kingston upon Hull, City of | Yorkshire and The Humber | 20,791 | 38.2% |
| Sandwell | West Midlands | 29,146 | 37.7% |
| Bolton | North West | 24,574 | 37.5% |
| Rochdale | North West | 18,407 | 36.7% |
| Walsall | West Midlands | 22,492 | 36.0% |
| Wolverhampton | West Midlands | 20,827 | 35.7% |
| Blackpool | North West | 9,054 | 35.6% |
| North East Lincolnshire | Yorkshire and The Humber | 10,181 | 34.5% |
Source: DWP Stat-Xplore, Children in Low Income Families, local authority by age and ONS Nomis, Population Estimates, local authority by age
Lowest proportions
The 20 local authorities with the lowest proportions of children aged under 16 in Relative low income families, United Kingdom, financial year ending 2024
Out of the top 20 local authorities with the lowest proportions of children in Relative low income families, 11 are located in the South East
| Local Authority | Region | Number of children | Proportion of children (%) |
|---|---|---|---|
| Richmond upon Thames | London | 2,213 | 5.6% |
| Elmbridge | South East | 1,921 | 6.4% |
| Wokingham | South East | 2,733 | 7.1% |
| Waverley | South East | 1,802 | 7.1% |
| Epsom and Ewell | South East | 1,193 | 7.1% |
| Hart | South East | 1,402 | 7.3% |
| East Renfrewshire | Scotland | 1,575 | 8.0% |
| St Albans | East of England | 2,612 | 8.2% |
| East Dunbartonshire | Scotland | 1,580 | 8.2% |
| Mid Sussex | South East | 2,519 | 8.2% |
| Mole Valley | South East | 1,262 | 8.3% |
| East Hertfordshire | East of England | 2,514 | 8.5% |
| Windsor and Maidenhead | South East | 2,639 | 8.8% |
| South Oxfordshire | South East | 2,488 | 8.9% |
| Guildford | South East | 2,308 | 9.1% |
| Uttlesford | East of England | 1,634 | 9.1% |
| Shetland Islands | Scotland | 374 | 9.2% |
| Isles of Scilly | South West | 30 | 9.2% |
| Aberdeenshire | Scotland | 4,462 | 9.3% |
| Reigate and Banstead | South East | 2,911 | 9.3% |
Source: DWP Stat-Xplore, Children in Low Income Families, local authority by age and ONS Nomis, Population Estimates, local authority by age
Figures on rates for children under 16 by local authority, Westminster Parliamentary constituency, and ward can be found as a timeseries going back to FYE 2015 via supporting data tables.
More detailed statistics are available on Stat-Xplore which allows users to produce bespoke tabulations showing local area analyses by a range of breakdowns over time.
6. About these statistics
DWP has a statutory obligation to publish measures of Absolute and Relative low income, and low income and material deprivation for children under section 4 of the Welfare Reform and Work Act 2016 and this is provided through the annual HBAI and Income Dynamics publications. HBAI provides estimates of children in low income at a national level, however there is significant demand for local area estimates (local authority, Westminster Parliamentary constituency, ward for example) met through this release.
The Background Information and Methodology provides further information on the composition, sources, definitions, uses and limitations of the series.
Key definitions are:
Definitions
| Term | Definition |
|---|---|
| Children | Dependent individuals aged under 16; or aged 16 to 19 in full-time non-advanced education or in unwaged government training. Child age is derived as the duration from date of birth to 31 March in each year. |
| Family | A single adult; or a married or cohabitating couple; or a Civil Partnership; and any dependent children. |
| Equivalised income | Income is gross income Before Housing Costs (BHC) and includes contributions from earnings, state support and pensions. Equivalisation adjusts incomes for family size and composition; taking an adult couple with no children as the reference point. |
| Relative low income | A family in low income Before Housing Costs (BHC) in the reference year. A family must have claimed Child Benefit and at least one other household benefit (Universal Credit, tax credits or Housing Benefit) at any point in the year to be classed as low income in these statistics. |
| Absolute low income | A family in low income Before Housing Costs (BHC) in the reference year in comparison with incomes in financial year ending (FYE) 2011. A family must have claimed Child Benefit and at least one other household benefit (Universal Credit, tax credits or Housing Benefit) at any point in the year to be classed as low income in these statistics. |
| Work status | A family is defined as ‘in-work’ if they have an accumulated period of at least 26 weeks paid employment or self-employment within the 52-week tax year. Employment activity is accumulated from either (or both) the adult claimant of Child Benefit and any partner(s) in the tax year. |
| Family type | Family type accounts for changes in family composition throughout the year (for example, re-partnering, multiple partners). A lone parent family type means the parent/guardian has had no partnerships at any point in the year. |
Rounding policy
Numbers over 1 million are rounded to the nearest 10,000. Numbers less than 1 million are rounded to the nearest 1,000. Percentages are rounded to the nearest whole number, with the exception of the tables and maps which are shown to 1 decimal place. Unrounded figures, with statistical disclosure control applied, can be obtained from Stat-Xplore. Perturbed figures from the underlying data available on Stat-Xplore or in accompanying tables may not sum exactly to the rounded totals accordingly. The statistics released on Stat-Xplore can be broken down by age and gender of child, family type, work status, and a range of geographies (including Westminster Parliamentary constituency, ward, and lower super output area). Stat-Xplore allows users to analyse the number of children in low income families within and across small areas since FYE 2015
Contact information and feedback
DWP would like to hear your views on these statistics. We would be interested in hearing what you use them for and how well they meet your requirements. Feedback and queries about the statistics can be sent to stats.consultation-2018@dwp.gov.uk.
Press enquiries should be directed to the DWP Press Office
Lead Statisticians: Steve Watkins and Russ Bentley
7. Related statistics
Estimates of numbers in low income in a single year from Households Below Average Income (HBAI). Other related DWP statistics include Family Resources Survey and Income Dynamics.
The following ONS publications provide useful information and guidance on alternative sources of data on earnings and income:
- Income and earnings statistics guide
- Income and earnings coherence workplan
- Income and earnings statistics interactive database
Historic indices of multiple deprivation by country are available:
- English Indices of Deprivation
- Welsh Index of Multiple Deprivation
- Scottish Index of Multiple Deprivation
Details of other National and Official Statistics produced by the Department for Work and Pensions can be found on the statistics at DWP page with a schedule of statistical releases over the next 12 months and a list of the most recent releases. This also includes the statistical work programme which outlines developments to DWP official statistics and any changes to statistical methodology. In accordance with the Code of Practice for Statistics, all DWP statistics are also announced on the research and statistics page.
ISBN: 978-1-78659-803-5