Identity and Social Networks - Community Life Survey 2019/20
Published 14 July 2020
The Community Life Survey is a household self-completion survey (online or paper) of adults aged 16+ in England. This chapter summarises results related to identity and social networks from the 2019/20 survey, which ran from April 2019 to March 2020.
Differences between groups are only reported on in this publication where they are statistically significant i.e. where we can be confident that the differences seen in our sampled respondents reflect the population [footnote 1].
1. Social interactions
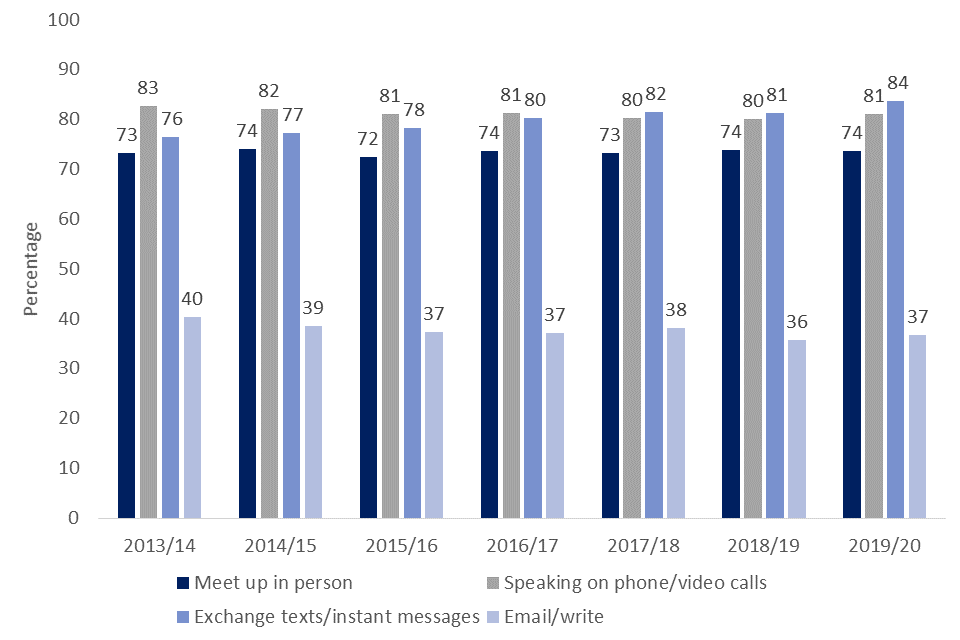
Respondents were asked how often they communicated with family members and friends via a range of methods. When looking at those who used different methods once a week or more:
- 84% exchange texts or instant messages
- 81% speak on the phone/video call
- 74% meet up in person
- 37% email or write
The percentage of respondents who exchange text or instant messages has increased since 2018/19 from 81% to 84%. Since 2013/14, this method has been increasing in popularity. Communicating with friends/family through speaking on the phone/video call and meeting up in person have both remained broadly consistent from 2013/14 to 2019/20. The percentage of respondents emailing/writing has decreased gradually since 2013/14, though no difference is observed between 2018/19 and 2019/20.
Figure 1.1 Methods of communicating with family or friends at least once a week, 2013/14 - 2019/20

Bar chart showing differences in popularity in methods of communication with family and friends once a week or more from 2013/14 to 2019/20
- Women were more likely than men to communicate with friends/family by meeting up in person, speaking on the phone/video call or exchanges text or instant messages. The most notable difference was for speaking on the phone, with 85% of women doing so at least once a week compared with 77% of men. No significant difference was seen between men and women for emailing and writing.
- Those in the age groups 65-74 and 75+ were more likely to meet up in person (79-82%) than the age groups 25-34, 35-49 and 50-64 years old (69-73%). Texts/instant messages were most popular with those under 65 (83-94%).
- When looking at ethnicity, White respondents were more likely to meet up with friends and family in person (75%) than either Black respondents (61%) or Asian respondents (69%). For the other methods of communication, no significant differences were seen with ethnicity.
- Those without a limiting long term illness or disability were more likely to meet up with friends/family (74% vs 70%) and to exchange texts/instant messages (88% vs 76%) than those with a long term limiting illness or disability
- Limited regional variability was seen, with those in London less likely to meet up in person (71%) than those in the North West (76%) or West Midlands (76%), but more likely to speak on the phone (83%) than those in the South East (78%).
- Those living in rural areas were more likely to write letters/email than those living in urban areas (43% vs 35%). Across regions, methods of communication were broadly similar, with some regional variability for speaking on the phone/video calls and emailing/writing.
- Respondents living in the least deprived areas, as measured by the Index of Multiple Deprivation[footnote 2], were also more likely to write or email than those living in the most deprived areas (43% compared with 31%).
Figure 1.2 Methods of communicating with family or friends once a week or more by gender, 2019/20

Bar chart showing differences in methods of communication with family and friends once a week or more by gender, 2019/20
Figure 1.3 Methods of communicating with family or friends once a week or more by age, 2019/20

Bar chart showing differences in methods of communication with family and friends once a week or more by age group, 2019/20
2. Support Networks
Overall, most respondents said there were people available if they needed support:
- 95% agreed that there is at least one person they can really count on to listen when they need to talk (asked only to online respondents)
- 95% either definitely agreed or tended to agree that if they needed help there are people who would be there for them
- 92% either definitely agreed or tended to agree that if they wanted company or to socialise there are people they could call
These estimates remain broadly similar to those in 2018/19.
- Women reported higher levels of agreement across all statements than men, suggesting that they felt they had more access to support networks
- 16-24 year olds agreed more that they could call on people for company (94%) than those aged 50-64 (92%)
- Those from the least deprived areas reported higher levels of agreement across all statements than those from the most deprived areas
- There was no significant variability for ethnicity, region, or living in an urban/rural area
Those with a long term limiting illness reported lower levels of agreement across all statements than those without, suggesting less access to support networks. The largest difference in response was seen for the statement ‘I agree that if I wanted company or to socialise, there are people I can call on’, where 87% of those with a long term limiting illness or disability agreed, compared to 94% of those without.
Figure 1.4 Percentage of respondents with support networks available by limiting long-term illness/disability (LLTI/Disability), 2019/20

Bar chart showing differences in agreement with statements around support networks by presence of a long term limiting illness or disability, 2019/20
3. Diversity of friendship groups
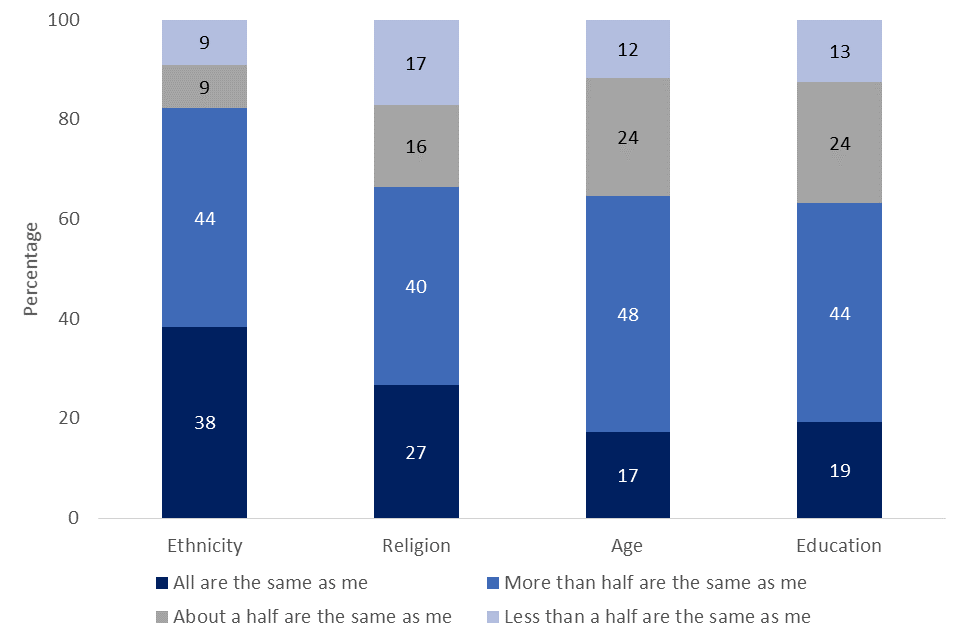
In 2019/20, the majority of respondents had diverse friendship groups in terms of ethnicity, religion, age and education, similar to 2018/19. Just over a third (38%) of respondents said that all of their friends are the same ethnic group as themselves, 27% said all were from the same religious group, 17% were all the same age group and 19% said all their friends had a similar level of education.
Figure 1.5 Similarity of friends to respondent in terms of ethnicity, religion, education and age group, 2019/20

Nested bar chart showing the diversity of respondents’ friendships group by ethnicity, religion, age and education, 2019/20
The proportion who said all their friends were the same religious group, age group and education has gradually increased since 2013/14 (from 25%, 14% and 18% respectively), but the proportion saying all their friends are the same ethnic group has decreased from 42% to 38% over the same time period.
-
The 95% confidence intervals are indicated by error bars on the charts. They show the range that we are 95% confident the true value for the population falls between. When there is no overlap between the error bars for two or more groups, we can be more confident that the differences between groups represent true differences between these groups in the population. ↩
-
The Index of Multiple Deprivation, commonly known as the IMD, is the official measure of relative deprivation for small areas in England. It is calculated using several measures such as income deprivation, crime and living environment deprivation. The Index of Multiple Deprivation ranks every small area in England from 1 (most deprived area) to 32,844 (least deprived area). In this publication, we have clustered these areas into ‘IMD Quintiles’ with 1 being the most deprived areas and 5 being the least deprived areas. ↩
