Companies register activities April 2023 to March 2024
Updated 28 November 2024

© Crown copyright 2024
This publication is licensed under the terms of the Open Government Licence v3.0 except where otherwise stated. To view this licence, visit nationalarchives.gov.uk/doc/open-government-licence/version/3 or write to the Information Policy Team, The National Archives, Kew, London TW9 4DU, or email: psi@nationalarchives.gov.uk.
Where we have identified any third party copyright information you will need to obtain permission from the copyright holders concerned.
This publication is available at https://www.gov.uk/government/statistics/companies-register-activities-statistical-release-april-2023-to-march-2024/companies-register-activities-april-2023-to-march-2024
1. Other statistics in this release
The tables in the Companies register activities April 2023 to March 2024 spreadsheet include:
- register activity for all companies
- the age of companies
- overseas companies with a UK establishment
- register activity for public limited companies (PLCs), limited liability partnerships (LLPs), limited partnerships (LPs) and other corporate body types
- company insolvencies and liquidations
- companies removed from the register
- directors and shareholders
- standard industrial classification (SIC) codes
The statistics in this release are presented by financial year, which runs from 1 April to 31 March.
We have identified several minor discrepancies across a number of our statistical tables, which we are correcting in this release. These minor errors do not change the overall meaning of the statistics.
More information about this correction.
2. Main points
The main things to note in this statistical release are that:
- the total register size at the end of financial year ending (FYE) 2024 was 5,350,759, an increase of 4.6% compared with the end of FYE 2023
- there were 890,684 company incorporations in FYE 2024, an increase of 11.2% compared with FYE 2023
- in FYE 2024 there were 663,167 dissolutions, an increase of 13.2% compared with FYE 2023
- the average age of a company on the total register at the end of FYE 2024 was 8.7 years
- private limited companies have accounted for over 95% of corporate bodies on the register since FYE 2005
- at the end of FYE 2024, the number of overseas companies with a UK establishment increased by 4.2% to 14,299 compared with FYE 2023
3. Changes in the companies register
The total register size was 5,350,759 at the end of FYE 2024. This number includes companies in the process of dissolution and liquidation (474,385). This is an increase of 234,016 companies (4.6%) compared with the end of FYE 2023.
The effective register size, which does not include companies in the process of dissolution or liquidation, was 4,876,374 at the end of FYE 2024.
The total register size increased across all constituent countries of the UK compared with FYE 2023:
- England and Wales by 212,228 companies (4.4%)
- Scotland by 10,932 companies (4.4%)
- Northern Ireland by 10,856 companies (14.1%)
We usually expect growth in the Northern Ireland register to be consistent with the other constituent countries of the UK, approximately 4%. This year’s growth in the Northern Ireland register size is primarily due to a larger relative increase in the number of incorporations compared to the register size in Northern Ireland during FYE 2024.
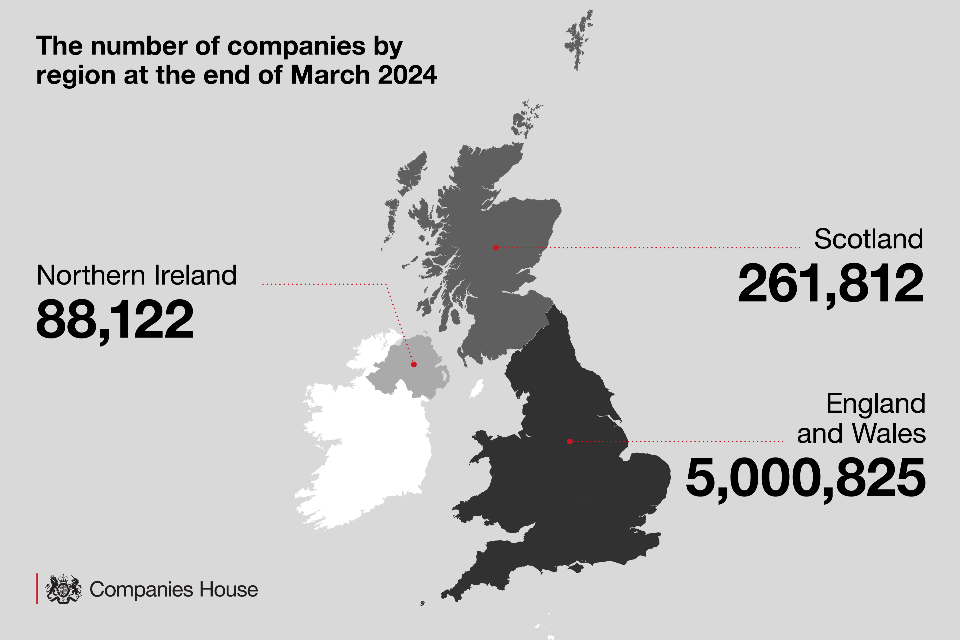
Figure 3.1: The number of companies on the total register reached 5,350,759 by 31 March 2024
Total register size by region, UK companies register, FYE 2024
Source: Companies register activities FYE 2024, Companies House
This graphic shows that by 31 March 2024, there were:
- 88,122 companies in Northern Ireland
- 261,812 companies in Scotland
- 5,000,825 companies in England and Wales
There were 890,684 company incorporations during FYE 2024. This is an increase of 89,678 (11.2%) compared with FYE 2023. The number of company incorporations increased compared with FYE 2023 across all constituent countries of the UK:
- England and Wales by 77,321 (10.2%)
- Scotland by 4,183 (11.5%)
- Northern Ireland by 8,174 (92.8%)
We usually expect an increase in the number of company incorporations to be consistent across all constituent countries of the UK. During FYE 2024, there has been a large increase in the number of company incorporations in Northern Ireland.
There were 663,167 dissolutions in FYE 2024, an increase of 13.2% compared with FYE 2023.
Despite fluctuations, the number of incorporations and dissolutions over time have increased at a steady rate.
There were 772,884 more incorporations in FYE 2024 compared with FYE 1987, when we began reporting financial-year data. There were 578,967 more dissolutions in FYE 2024 compared with FYE 1987.
Figure 3.2: Incorporations and dissolutions increased by 11.2% and 13.2% respectively during FYE 2024
Incorporations and dissolutions, UK companies register, FYE 1987 to FYE 2024. “Creation of UK register” means the merging of the Great Britain and Northern Ireland registers.

Source: Companies register activities FYE 2024, Companies House
During FYE 2024 there were:
- 24,662 insolvent liquidations, a year-on-year increase of 8.0%
- 9,290 members’ voluntary liquidations, a decrease of 9.3% compared with FYE 2023
- 36,700 liquidations and other insolvency proceedings in total, an increase of 4.9% compared with FYE 2023
For more information, go to Company insolvency statistics releases.
There is a full breakdown of company statistics for England and Wales, Scotland, Northern Ireland and the UK in table A1 of the Companies register activities April 2023 to March 2024 spreadsheet. The tables contain figures for FYE 2015 through to FYE 2024. There are separate figures for private companies and public limited companies in tables A2 and A3, respectively. There are liquidation and insolvency figures in table A10.
4. Historic changes in register size
Between FYE 1987 and FYE 2024, the:
- total register has increased by 4.3 million companies
- effective register has increased by 4.0 million companies
Statistics for FYE 1987 to FYE 2009 are for Great Britain. Figures from FYE 2010 onwards are for the UK.
We expected the register size to increase when Northern Ireland companies were introduced to the UK register in 2009. However, this may have been offset by the global financial crisis during the same period leading to a slight decrease in the register size overall.
There were several substantial changes to the register between 2008 and 2009, including:
- a change in the administrative system that forms the register in February 2008
- a removal of defunct companies that had spent a long time in the process of dissolution or liquidation, completed in May 2009
- combining the Great Britain and Northern Ireland registers to create the UK register in October 2009
- the final legislative changes introduced under the Companies Act 2006 coming into effect in October 2009, reducing the time taken to dissolve companies and remove them from the register
Together, these changes likely contributed to a sharp increase in the number of dissolutions between FYE 2009 and FYE 2011. This may in turn have affected the sizes of the total and effective registers. Since FYE 2011, both registers have continued to increase steadily in size.
Between FYE 2015 and FYE 2024, the average annual growth rate for both the total and effective registers was 5.1%.
The growth rate of the total register was 4.6% in FYE 2024 compared to 4.5% in FYE 2023. The growth rate of the effective register was 5.0% in FYE 2024, compared to 3.2% in FYE 2023.
Figure 4.1: The total and effective register sizes increased by 4.6% and 5.0% respectively during FYE 2024
Total and effective register size, UK companies register, FYE 1987 to FYE 2024. “Creation of UK register” means the merging of the Great Britain and Northern Ireland registers.

Source: Companies register activities FYE 2024, Companies House
On 4 March 2024, legislation was introduced to allow Companies House to assist in tackling economic crime under the Economic Crime and Corporate Transparency (ECCT) Act 2023 . The data included in this release is up to 31 March 2024. It does not include any changes to the register related to the new powers under the ECCT Act.
More information about the Economic Crime and Corporate Transparency Act 2023.
Table A8 in the Companies register activities April 2023 to March 2024 spreadsheet shows the:
- total and effective register sizes from 1939 to FYE 2024
- annual number of incorporations, dissolutions, liquidations and insolvencies
5. Age of companies on the register
The average age of UK companies was 8.7 years on the total register at the end of FYE 2024.
On the total register for FYE 2024:
- 49.1% of companies were under 5 years old
- 71.3% of companies were under 10 years old
- 11.2% of companies were over 20 years old
On the effective register for FYE 2024:
- 49.7% of companies were under 5 years old
- 70.8% of companies were under 10 years old
- 11.4% of companies were over 20 years old
Figure 5.1: Over 30% of companies on the total register were 1 to 4 years old at the end of FYE 2024
Age of companies on the UK companies register, FYE 2024

Source: Companies register activities FYE 2024, Companies House
Historically, the average age of a company has always been relatively young.
The average age of a company on the total register gradually declined from 10.7 to 8.1 years between FYE 2000 to FYE 2007.
The average age of a company fluctuated between FYE 2009 and FYE 2011. This was due to changes in the numbers of incorporations, dissolutions and overall register size after combining the Northern Ireland and Great Britain registers to create the UK register.
Between FYE 2014 and FYE 2024, the average age of a company has remained roughly consistent.
Since FYE 2000, the decline in the average age of a company could be due to the general increasing trend in the number of incorporations and dissolutions. It is likely that the increasing number of incorporations has led to more younger companies on the register, lowering the average age of companies.
The average age of a dissolved or closed company has declined from 5.4 years in FYE 2016 to 4.6 years in FYE 2024.
Figure 5.2: The average age of a company on the total register was 8.7 years at the end of FYE 2024
Average age of a company on the UK companies register, FYE 2000 to FYE 2024

Source: Companies register activities FYE 2024, Companies House
Table A5 in the Companies register activities April 2023 to March 2024 spreadsheet shows:
- the ages of companies on the total and effective registers at 31 March 2024
- the ages of companies in liquidation or the course of dissolution at 31 March 2024
- the average age of a company from FYE 2000 to FYE 2024
Table A11 shows the average age of dissolved and closed companies from FYE 2015 to FYE 2024.
Table C3 shows average ages at closure and dissolution across all corporate body types.
6. Types of corporate body on the register
There are 29 types of corporate body on the register. These include corporate body types other than those companies covered by the Companies Act 2006.
Each corporate body type has distinct requirements, as outlined in legislation and royal acts.
Find more information on each company type.
Since FYE 2005, private limited companies have made up over 95% of all corporate body types. During this time, the 3 corporate body types making up the highest proportion of corporate bodies have remained:
- private limited companies
- limited partnerships
- limited liability partnerships (LLPs)
These 3 corporate body types have consistently made up over 98% of all corporate body types.
Table 6.1: Private limited companies accounted for over 95% of all corporate bodies on the total register at 31 March 2024
Top 10 corporate body types on the UK companies register, FYE 2024
| Corporate body type | Number | Percentage of all corporate bodies |
|---|---|---|
| Private limited | 5,157,778 | 92.7 |
| Private limited by guarantee / no share capital | 144,376 | 2.6 |
| Limited partnership | 58,576 | 1.1 |
| Limited liability partnership | 52,689 | 0.9 |
| Private limited by guarantee / no share capital (use of limited exemption) | 38,737 | 0.7 |
| Charitable incorporated organisation | 35,388 | 0.6 |
| Overseas entity | 30,741 | 0.6 |
| Overseas company | 14,577 | 0.3 |
| Registered society | 10,753 | 0.2 |
| Scottish charitable incorporated organisation | 6,405 | 0.1 |
| Other corporate body types | 13,077 | 0.2 |
| Total of corporate body types | 5,563,097 | 100 |
Source: Companies register activities FYE 2024, Companies House
The composition of the register overall has remained stable in recent years in terms of corporate body types. However, there have been some minor fluctuations within individual corporate body types.
Charitable incorporated organisations
Charitable incorporated organisations (CIOs) were introduced in late 2017. CIOs are an incorporated structure designed for charities and need to be registered with the Charity Commission.
The Charity Commission allowed charitable companies to convert to CIOs. For FYE 2024, there were:
- 35,388 CIOs in England, Wales and Northern Ireland (0.6% of all corporate bodies)
- 6,405 CIOs in Scotland (0.1% of all corporate bodies)
Since FYE 2018, the number of CIOs has increased. The average annual growth rate of CIOs is:
- 17.3% in England, Wales and Northern Ireland
- 11.7% in Scotland
Limited liability partnerships
Limited liability partnerships (LLPs) were introduced in April 2001. These gradually increased in number to make up a maximum of 1.8% of the register in FYE 2013. The proportion of LLPs has since gradually declined, and they now account for 0.9% of the register.
Limited partnerships
The percentage of limited partnerships on the register grew to a peak of 1.2% in FYE 2019. This has since slowly declined to 1.1% at the end of FYE 2024.
Scottish limited partnerships make up most UK limited partnerships on the register. This is primarily due to high numbers of incorporations between FYE 2013 and FYE 2018.
Public limited companies
Public limited companies have been declining in number since FYE 2008. They now make up only 0.1% of the register.
European economic interest groupings, Societas Europaea, UK economic interest groupings and UK Societas
Due to the UK’s exit from the European Union, most European economic interest groupings (EEIGs) and Societas Europaea (SE) companies became UK economic interest groupings (UKEIGs) and UK Societas (UKS) respectively.
Although they are small, these changes show the subtle ways in which the composition of corporate bodies on the register varies over time.
Table C1, in the Companies register activities April 2023 to March 2024 spreadsheet, displays numbers and percentages of all corporate body types on the register from FYE 2015 to FYE 2024.
Find more information on public limited companies, limited partnerships and limited liability partnerships in tables A3, B2 and B4 respectively.
7. Overseas companies with a UK establishment
Overseas companies with a UK establishment are companies incorporated outside of the UK with a place of business or branch (‘establishment’) in the UK through which they carry out their business.
At the end of FYE 2024, there were 14,299 overseas companies with a UK establishment on the total register, compared with 13,729 at the end of FYE 2023. This represents a 4.2% increase.
At the end of FYE 2024, the 3 countries with the most overseas companies on the register were:
- the United States, with 2,695 companies (18.8% of overseas companies on the register)
- the Channel Islands, with 1,912 companies (13.4% of overseas companies on the register)
- Ireland, with 1,274 companies (8.9% of overseas companies on the register)
In FYE 2024, the 3 regions with the most overseas companies on the register were:
- Europe, with 4,551 companies (31.8% of overseas companies on the register)
- the Americas, with 3,115 companies (21.8% of overseas companies on the register)
- the UK Crown Dependencies, with 2,464 companies (17.2% of overseas companies on the register)
The statistics show net increases in the number of overseas companies on the register in all regions.
Figure 7.1: 18.8% of all overseas companies on the UK register originated in the United States at 31 March 2024
Top 10 countries of origin for overseas companies with a UK establishment, UK companies register, FYE 2024
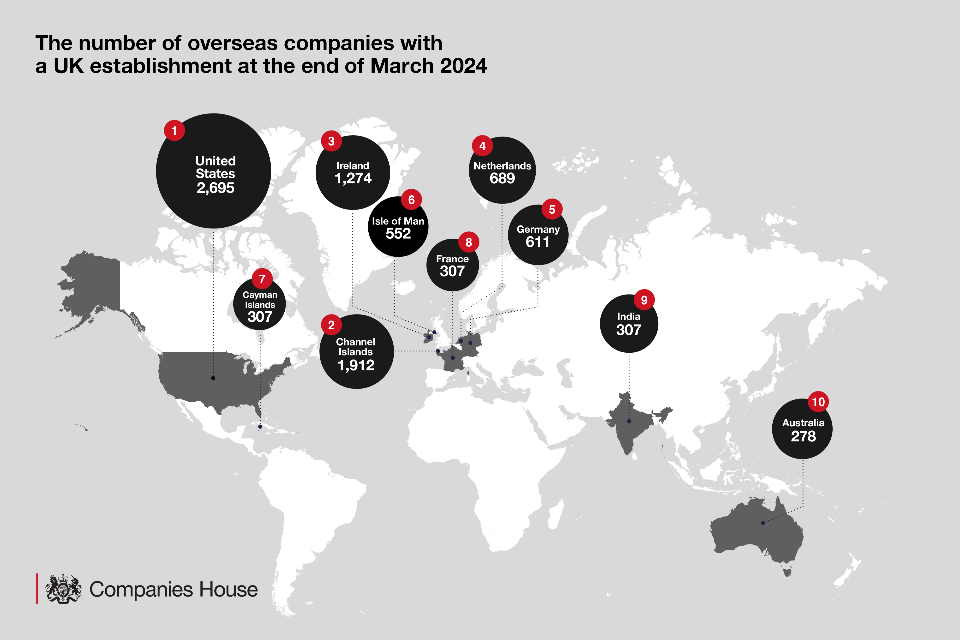
Source: Companies register activities FYE 2024, Companies House
This graphic shows overseas companies with a UK establishment. The 10 countries with the most companies with a UK establishment at 31 March 2024 were:
- United States – 2,695 companies
- Channel Islands – 1,912 companies
- Ireland – 1,274 companies
- Netherlands – 689 companies
- Germany – 611 companies
- Isle of Man – 552 companies
- Cayman Islands – 307 companies
- France – 307 companies
- India – 307 companies
- Australia - 278 companies
There were 983 new registrations for overseas companies in FYE 2024. Of these:
- 292 (29.7%) originated in the Channel Islands
- 102 (10.4%) originated in the United States
- 70 (7.1%) originated in Ireland
- 44 (4.5%) originated in Germany
By region, the 3 highest numbers of new registrations of overseas companies originated from:
- UK Crown Dependencies, with 304 new registrations (30.9%)
- Europe, with 253 new registrations (25.7%)
- the Americas, with 124 new registrations (12.6%)
The top 10 originating countries made up 68.8% of all overseas companies on the total register at the end of FYE 2024.
Table 7.1: Over 29% of new overseas company registrations originated in the Channel Islands in FYE 2024
Top 10 countries of origin for new registrations of overseas companies with a UK establishment, UK companies register, FYE 2024
| Country of origin | New registrations | Percentage of all registrations |
|---|---|---|
| Channel Islands | 292 | 29.7 |
| United States | 102 | 10.4 |
| Ireland | 70 | 7.1 |
| Germany | 44 | 4.5 |
| Liberia | 39 | 4 |
| United Arab Emirates | 39 | 4 |
| Netherlands | 31 | 3.2 |
| British Virgin Islands | 21 | 2.1 |
| Cayman Islands | 20 | 2 |
| Hong Kong | 18 | 1.8 |
| Other countries of origin | 307 | 31.2 |
| Total | 983 | 100 |
Source: Companies register activities FYE 2024, Companies House
Table B1 shows the:
- total number of overseas companies with a UK establishment on the register from FYE 2015 to FYE 2024
- number of new registrations during FYE 2024
8. About the data
The figures in this release give information about the population of companies and corporate bodies in the UK.
Companies and corporate bodies are legal types of business registered at Companies House.
Companies are a group of corporate bodies formed under the Companies Act 2006.
Companies and corporate bodies are registered at Companies House regardless of whether they go on to actively trade.
For more information on companies covered by the Companies Act 2006 and corporate bodies, see Definitions to accompany statistical releases from Companies House. This document also explains the incorporation, dissolution and restoration processes.
The statistics in this release include:
- the total number of registered companies
- the number of companies incorporated
- the number of companies dissolved
- historic changes in the size of the companies register
- age of companies on the register
- types of corporate body on the register
- overseas companies with a UK establishment
- the register of overseas entities
This statistics release focuses on the headline messages for the UK.
There are figures for the constituent countries in the Companies register activities April 2023 to March 2024 spreadsheet. These documents also include figures for:
- public limited companies (PLCs)
- limited liability partnerships (LLPs)
- limited partnerships (LPs)
- other corporate body types
This release complements the quarterly release Incorporated companies in the UK. It gives information on companies to which the Companies Act 2006 relates, and on other corporate body types.
Sections 3 to 5 of this statistical release focus specifically on companies. Sections 6 and 7 cover other corporate body types.
Some figures in this release may differ to those in the quarterly “Incorporated companies in the UK” publications. This is due to the timing of the analysis. Companies House carries out analyses for the figures in this release later in the year, so more information can be processed and added to the register.
A range of management information tables are due to be published between July and September 2024, containing:
- civil penalties for late filing of annual accounts
- disqualification orders notified to the Secretary of State in the UK
- prosecutions under the Companies Act 2006
- the number of documents filed at Companies House
- annual accounts registered at Companies House by accounts type
9. Glossary
Definitions for the main terms used in Companies House official statistics publications.
10. Strengths and limitations
Companies House statistics are used extensively by government, the public, public bodies and businesses. For example, they are used by:
- government in understanding the likely impact of policy changes and monitoring the impact of economic changes on companies
- businesses in understanding their market share and planning marketing strategies
- banks in developing an understanding of their customer base
- foreign firms in making UK location decisions
- academics to inform research into businesses at local and national level
- a range of public bodies in decision-making and evaluating business-related policies
Our statistical practice is regulated by the Office for Statistics Regulation (OSR). OSR sets the standards of trustworthiness, quality and value in the Code of Practice for Statistics that all producers of official statistics should adhere to.
You are welcome to contact us directly with any comments about how we meet these standards.
Alternatively, you can contact OSR by emailing regulation@statistics.gov.uk or via the OSR website.
10.1 Quality
Read our document Quality information to accompany statistical releases from Companies House. It can help you decide if the data is good enough to use.
This document measures the Companies House official statistics against characteristics called data quality dimensions. Companies House uses the European Statistical System’s data quality dimensions.
The document also gives information on how Companies House official statistics relate to other business statistics.
10.2 Corrections and revisions to these statistics
We aim to minimise corrections and revisions to our statistical publications but sometimes changes are unavoidable. These changes could be:
- corrections, which are unplanned and occur when errors in either the data or the methodology are found after release of the publication
- revisions, which are generally, but not always, planned, and are the result of improvements in methods or of additional data
We have identified several minor errors across a number of our statistical tables which we are correcting in this release. The issues we’ve identified include:
- figures for England and Wales, Scotland and Northern Ireland not totalling the overall UK figure
- some totals not equalling the sum of their parts
- minor discrepancies in calculated percentages
These are minor errors that do not change the overall message of the statistics. The tables impacted are:
- Table A2: Summary of changes in the number of private companies on the register, 2014-15 to 2023-24
- Table A3: Summary of changes in the number of public limited companies on the register, 2014-15 to 2023-24
- Table A8: Historical data, 1939 to 2023-24
- Table A9: Companies removed from the register, 2014-15 to 2023-24
- Table B1: Registrations of overseas companies with a UK establishment, 2014-15 to 2023-24
- Table B4: Summary of changes in limited liability partnerships, 2014-15 to 2023-24
More information about potential changes to the published data.
The source of these statistics is administrative data. This means the data are often used for operational purposes. Statistical use is not their main purpose. As the main purpose of collecting the data is operational, it is common that some of the values we report on change.
In this publication of the statistical tables, we’ll show corrections by adding the word ‘revised’ in square brackets next to figures that have been corrected. However, in the next publication, we’ll remove these.
10.3 Consultation
We publish results of the most recent consultation on these official statistics on GOV.UK.
11. Future releases
Companies House will publish annual statistics for FYE 2025 on 26 June 2025.
We’ll publish statistics for the period 1 April to 30 June 2024 on 25 July 2024.
We’ve announced the publication dates on the GOV.UK release calendar.
If you have a question about any of these tables or Companies House statistics in general, email statistics@companieshouse.gov.uk.
12. Related links
Companies House statistics newer than 2014
Annual and quarterly statistics produced by Companies House from June 2014.
Companies House statistics older than 2014
Annual and quarterly statistics produced by Companies House before October 2014, on the National Archives website.
Open data products at Companies House
Information about the open data products that Companies House offers. We update this page regularly.
Find and update company information
Our service to find and update company information, which includes advanced search capabilities.
Free, fully documented API, which gives access to real-time updates on companies. We update this information regularly.
A developer forum giving API support, which is updated regularly.