DCMS Sectors Economic Estimates 2022: Business Demographics - Report
Updated 16 November 2023
1. Background
- Release date: 8 December 2022
- Next release: Winter 2023/24
- Geographic coverage: United Kingdom and ITL1 regions
- Time coverage: March 2019, March 2020, March 2021, March 2022
- Responsible analyst: Eri Hutchinson
This release provides estimates of the number, employment, and turnover of businesses within the DCMS Sectors (excluding Civil Society[footnote 1]). Data on the number of businesses is rounded to the nearest five.
The terms “DCMS Sectors (excluding/excl. Civil Society)” and “included DCMS Sectors” are used interchangeably in this report. This is to reflect that no estimates are available for the Civil Society sector, because they are not identifiable in the data source used for this release.
2. Headline findings
2.1 Number of businesses
In March 2022 the total number of businesses in DCMS Sectors (excluding Civil Society) was 638,000. This represented 23.1% of the 2,768,000 businesses registered in the UK.
Estimates for the number of businesses in the individual sectors, which overlap, were as follows:
- Creative Industries: 272,000 businesses in March 2022, making up 42.6% of all businesses in the included DCMS Sectors.
- Cultural Sector: 77,000 businesses in March 2022, making up 12.1% of all businesses in the included DCMS Sectors.
- Digital Sector: 210,000 businesses in March 2022, making up 32.9% of all businesses in the included DCMS Sectors.
- Gambling: 1,000 businesses in March 2022, making up 0.2% of all businesses in the included DCMS Sectors.
- Sport: 43,000 businesses in March 2022, making up 6.7% of all businesses in the included DCMS Sectors.
- Telecoms: 8,000 businesses in March 2022, making up 1.3% of all businesses in the included DCMS Sectors.
- Tourism Industries: 321,000 businesses in March 2022, making up 50.4% of all businesses in the included DCMS Sectors.
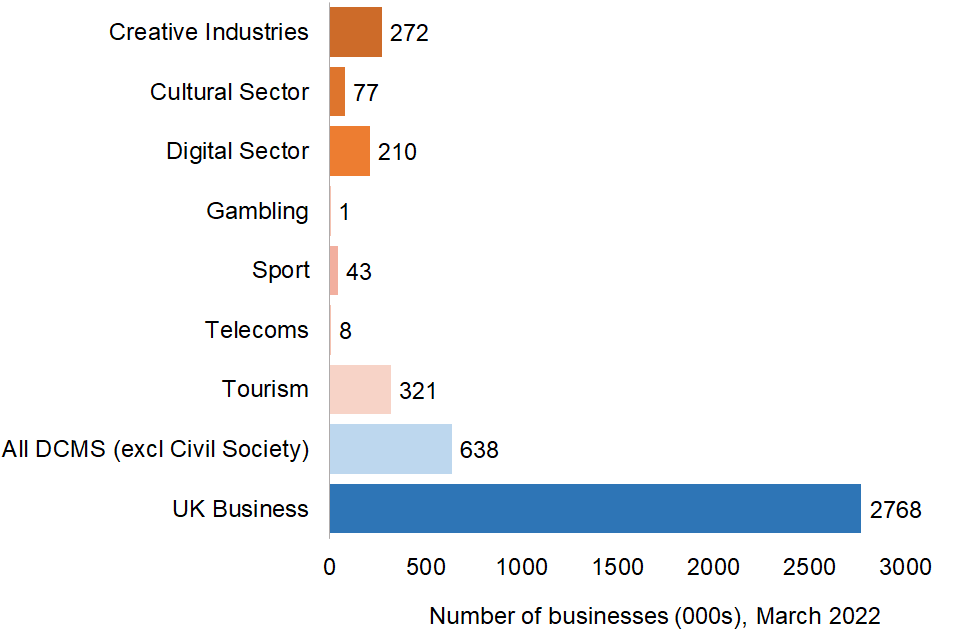
Figure 1: Estimated number of registered businesses in the included DCMS Sectors and the UK overall, March 2022.
Please note that:
- Due to rounding, the sum of the proportions will not add up to 100%
- Due to overlaps between DCMS sectors, whereby some industries are simultaneously classed as Creative Industries and Cultural Sector, for example, the sum of totals will not add up to the DCMS Sectors (excluding Civil Society) total.
2.2 Size of businesses
Business size can be measured either as the number of employees, or turnover generated.
Size of business by number of employees
In March 2022, businesses in DCMS Sectors (excluding Civil Society) followed a similar size distribution to the UK registered businesses in general. The vast majority (88.0%) of businesses in the included DCMS Sectors (excluding Civil Society) fell into the micro (0-9) employee band, similar to 89.5% of UK registered businesses in general.
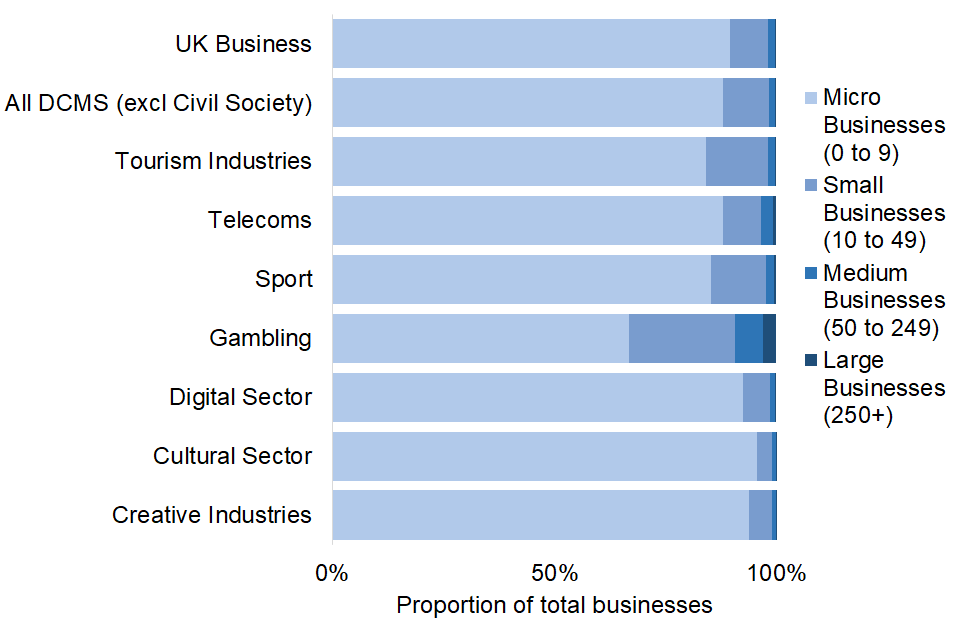
Figure 2: Percentage of businesses for DCMS Sectors (excluding Civil Society) and all UK registered businesses, March 2022
Size of business by annual turnover
In March 2022, businesses in DCMS Sectors (excluding Civil Society) were more likely to be in a lower turnover band than UK businesses in general. 78.9% of DCMS Sector (excluding Civil Society) businesses have a turnover of less than £250,000, compared to 71.4% of UK businesses in general.
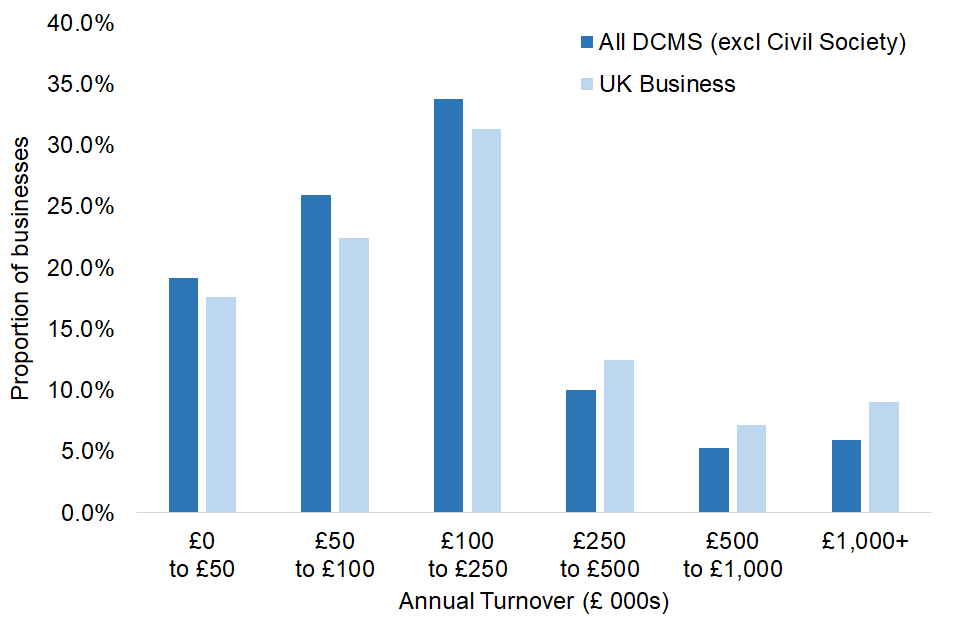
Figure 3: Distribution of businesses in DCMS Sectors (excluding Civil Society) and overall UK registered businesses by annual turnover, March 2022
Previous releases have included estimates of the turnover produced by businesses in each employment band. This publication does not include these estimates because we have experimented with using the Inter-Departmental Business Register (IDBR) to generate estimates of DCMS Business Demographics, rather than the Annual Business Survey (ABS) as previous releases, so this breakdown is not possible to calculate. Additional information about this change can be found in the note.
2.3 Regional distribution of business sites in DCMS Sectors
In March 2022, there were 731,000 business sites in DCMS Sectors (excluding Civil Society), representing 22.7% of the 3,220,000 registered business sites in the UK.
Figure 4 below shows that business sites in the included DCMS Sectors varied in their distribution across regions (as defined by the International Territorial Level 1[footnote 2], or ITL1, geographic classification of administrative areas), with those in some sectors (such as Sport) being more evenly spread around the UK than others (such as Creative Industries).
In common with UK business in general, the included DCMS Sectors tended to have a higher proportion of business sites in London and the South East than other regions (as defined by the ITL1 geographic classification of administrative areas). Of business sites in the included DCMS Sectors, 175,000 (23.9%) were in London. This is a higher proportion than for UK business sites overall, of which 596,000 (18.5%) were in London.
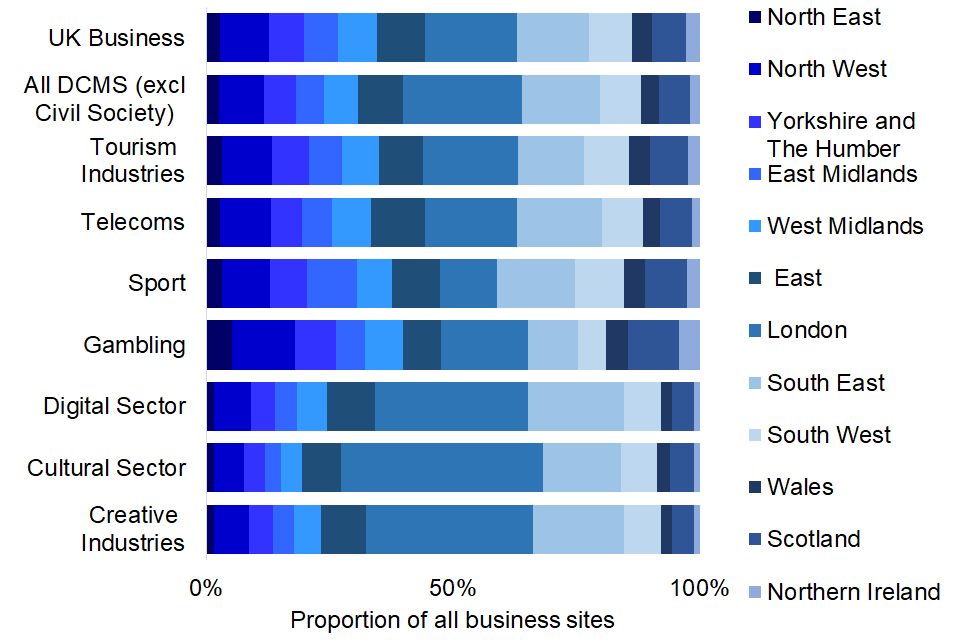
Figure 4: Regional distribution of business sites in DCMS Sectors (excl Civil Society) and all UK business sectors, March 2022
2.4 Changes over time
The number of businesses in DCMS Sectors (excluding Civil Society) had decreased by 2,000 (0.3%) from March 2019 to March 2022, in contrast to UK businesses in general which increased in number by 49,000 (1.8%) over the same period. This meant businesses in the included DCMS Sectors went from representing 23.6% of all registered UK businesses in March 2019 to 23.1% in March 2022.
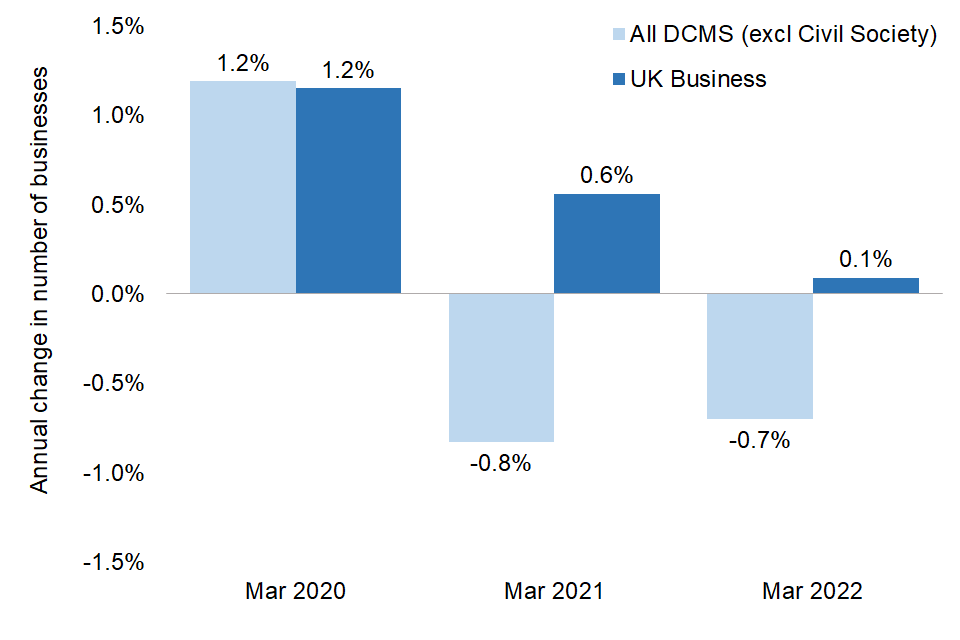
Figure 5: Estimated annual change in the number of businesses in DCMS Sectors (excluding Civil Society) and UK businesses overall, March 2019-March 2022.
Overall, the number of businesses in the included DCMS Sectors increased by 8,000 (1.2%) from March 2019 to March 2020, before falling by 5,000 (0.8%) to March 2021 and a further 4000 (0.7%) to March 2022. Some DCMS sectors displayed a similar trend, while others had a sustained increase or decrease in business numbers over the period.
Estimated changes in the number of businesses in the individual sectors, from March 2019 to March 2022, were as follows:
- Creative Industries: 25,000 (9.4%) fewer businesses. The number of businesses grew by 420 (0.1%) from March 2019 to March 2020, then fell by 12,000 (3.9%) to March 2021 and then a further 14,000 (5.3%) to March 2022.
- Cultural Sector: 4,000 (5.5%) more businesses. The number of businesses grew by 1,000 (1.6%) from March 2019 to March 2020, a further 1,000 (1.2%) to March 2021 and then a further 2,000 (2.8%) to March 2022.
- Digital Sector: 30,000 (14.4%) fewer businesses. The number of businesses fell by 1,000 (0.3%) from March 2019 to March 2020, fell by a further 13,000 (5.3%) to March 2021 and then a further 17,000 (8.0%) to March 2022.
- Gambling: 100 (10.9%) fewer businesses. The number of businesses fell by 40 (3.3%) from March 2019 to March 2020, fell by a further 60 (5.3%) to March 2021 and then a further 20 (1.6%) to March 2022.
- Sport: 4,000 (8.7%) more businesses. The number of businesses increased by 1,000 (2.5%) from March 2019 to March 2020, by a further 400 (1.0%) to March 2021 and then a further 2,000 (5.5%) to March 2022.
- Telecoms: 300 (3.3%) fewer businesses. The number of businesses grew by 100 (1.4%) from March 2019 to March 2020, but then fell by 100 (1.04%) to March 2021 and then a further 300 (3.7%) to March 2022.
- Tourism Industries: 22,000 (2.3%) more businesses. The number of businesses grew by 7,000 (2.3%) from March 2019 to March 2020, a further 5,000 (1.8%) to March 2021, and then a further 10,000 (3.1%) to March 2022.
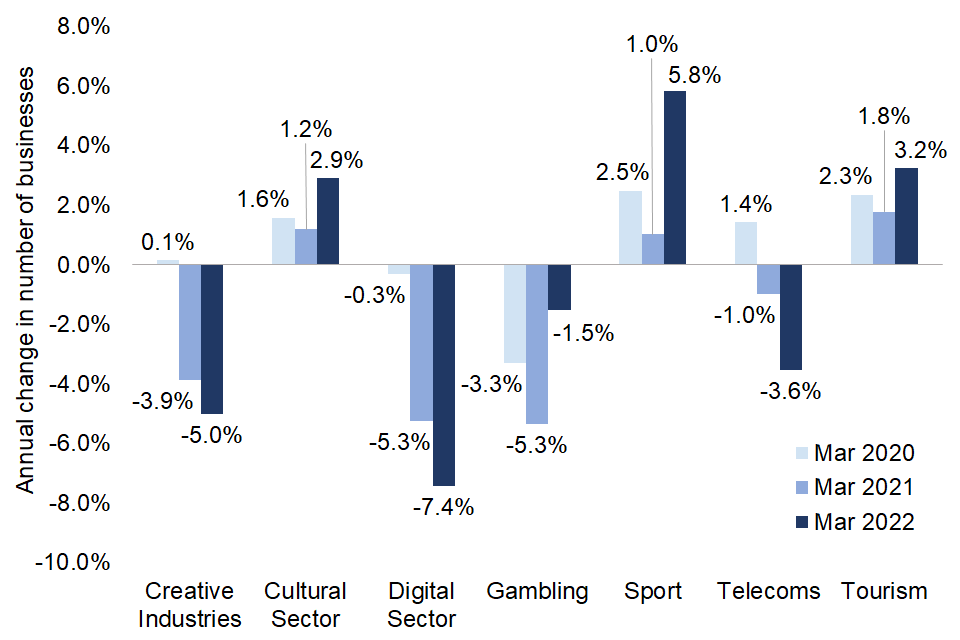
Figure 6: Estimated annual change in the number of businesses in the individual DCMS sectors, March 2019-March 2022.
The changes in the number of businesses in DCMS Sectors (excluding Civil Society) overall are mostly driven by the following:
- The growth in the number of businesses in the included DCMS Sectors overall from March 2019 to March 2020 comes particularly from the Tourism Industries. This came in particular from restaurants and food services, including catering services.
- The fall between March 2020 and March 2022 came despite the Tourism Industries continuing to grow. This came strongly from falls from “IT, software and computer services” Creative subsector and the “Computer programming, consultancy and related areas” Digital subsector. These are the two largest DCMS defined subsectors, both of which have the large computer programming and computer consultancy industries.
Changes over time in business size
The relative size of businesses in DCMS Sectors (excluding Civil Society) when measured by employee band has remained stable, with 99.7% having under 250 employees in each year from March 2019 to March 2022. This is very similar to the proportion of small businesses in the UK overall, with 99.6% of registered businesses having under 250 employees in each year over the same period.
On the other hand, a smaller proportion of businesses in the included DCMS Sectors were in the highest turnover bands in March 2022 than in March 2019. In March 2019, 22.8% had a turnover of more than £250,000. This increased to 23.4% and 23.9% respectively in March 2020 and March 2021, before falling to 21.1% in March 2022.
Changes over time in regional distribution of business sites
In March 2019 the administrative area with the largest number of DCMS Sectors (excluding Civil Society) business sites was London, representing 24.4% of the total. The fewest business sites were located in Northern Ireland, at 1.8% of the total.
By March 2022, the gap between the proportion of business sites in these administrative areas had slightly narrowed. 23.9% of business sites for the included DCMS Sectors were in London, with 1.9% in Northern Ireland. The distribution of business sites in the included DCMS Sectors was also more equally distributed across the UK in 2022 compared to 2019.
In contrast, UK businesses in general had 18.4% of business sites in London and 2.8% in the North East in March 2019. The proportion in London slightly increased to 18.5% by March 2022 but there was no change in the North East.
3. About the data
The DCMS Sector Economic Estimates were designated as National Statistics on 26 June 2019. This followed a report by the Office for Statistics Regulation in December 2018 which stated that the series could be designated as National Statistics, subject to meeting certain requirements.
The DCMS Economic Estimates 2022: Business Demographics publication includes:
- estimates of the number of businesses in DCMS sectors and sub-sectors by employment and turnover size bands, foreign ownership status and ITL1 regions of the United Kingdom.
- estimates of the number of businesses in the Audio Visual sector, which does not form part of the DCMS Sector (excluding Civil Society) total.
This release provides estimates of the number, employment, and turnover of businesses within the DCMS Sectors (excluding Civil Society). Data on the number of businesses is rounded to the nearest five. When we refer to a national total or UK businesses in general, this is for all businesses registered with HM Revenue & Customs (HMRC) for Value Added Tax (VAT) and/or Pay As You Earn (PAYE).
The DCMS sectors covered in this release are:
- Creative Industries
- Cultural Sector
- Digital Sector
- Gambling
- Sport
- Telecoms
We also include estimates for the Tourism Industries, which are constructed on a different basis to the tourism sector estimates in our other releases[footnote 3].
Estimates for the Civil Society sector are not available, because they are not identifiable in the data source used for this release. The terms “DCMS Sectors (excluding/excl. Civil Society)” and “included DCMS Sectors” are used interchangeably in this report to reflect this.
The DCMS sectors are not mutually exclusive; industries may contribute to and be classified as more than one sector. Due to these overlaps, summing over the number of businesses in individual sectors would give a total greater than the actual value. When calculating the DCMS sector total, these overlaps are accounted for and businesses are only counted once rather than multiple times.
-
In March 2022, 97.4% of businesses in the Cultural Sector also operated in the Creative Industries.
-
In March 2022, 76.7% of businesses in the Digital Sector also operated in the Creative Industries.
4. Call for feedback
In this publication we have experimented with using a snapshot of the Inter-Departmental Business Register (IDBR) to generate estimates of DCMS Business Demographics, rather than the Annual Business Survey (ABS) as in previous releases. This has the advantage of being more timely, and commits to most tables included in previous Business Demographics publications. We have used the March 2019, March 2020, March 2021 and March 2022 snapshots from the ONS UK business: activity, size and location release rather than raw data from the IDBR.
We are looking for feedback on this approach. We particularly welcome views on:
- Continuing with this approach using the more timely IDBR data source.
- Returning to the previous approach using the ABS as a data source.
- Experimenting with a ‘mixed approach’ where estimates would be produced using the IDBR snapshot, supplemented with further data from the ABS to produce additional tables.
Please contact evidence@dcms.gov.uk before Thursday 9th February 2023 with any feedback.
5. Glossary
5.1 Turnover
Turnover refers to the value of sales, work done and services rendered by businesses, excluding VAT. This is different to profit or value added and does not take into account business costs. Businesses that generate a lower turnover can be more profitable/productive than businesses with higher turnover.
5.2 Businesses
A business is defined as any Enterprise held on the Inter Departmental Business Register (IDBR). A business is held on the IDBR if it is registered for Value Added Tax (VAT) with HM Revenue and Customs (HMRC), registered for a Pay As You Earn (PAYE) scheme with HMRC, or an incorporated business registered at Companies House.
Estimates for number of business sites, broken down by region, are based on all the Local Units an Enterprise has. Hence, the totals shown for that section will be higher than for the number of businesses shown in other tables.
5.3 Region
In this release a region refers to an administrative area of England or the devolved administrative area of Scotland, Wales or Northern Ireland. This uses the internationally comparable geography of ITLs (International Territorial Levels) at ITL1 regional level.
6. Further information
DCMS has developed a suite of Economic Estimates to understand the economic impact its sectors have on the UK economy. Upcoming work in the DCMS Economic Estimates series include:
- Employment
- Earnings of those working in DCMS Sectors
- Gross Value Added (GVA) from DCMS sector businesses
For general enquiries contact: Department for Digital, Culture, Media and Sport, 100 Parliament Street, London, SW1A 2BQ. For media enquiries contact: 020 7211 2210.
DCMS statisticians can also be followed on Twitter via @DCMSInsight.
-
Estimates of the number of businesses in the Civil Society sector are not available in this release. This is because Civil Society organisations are not identifiable in the Annual Business Survey dataset and therefore Business Demographic estimates cannot be produced on the same basis. Previous reports have included data on Charities registered with the Charity Commission of England and Wales, Community Interest Companies (CICs) and Public Service Mutuals which were defined as Civil Society organisations. An update to the Public Services Mutuals report is not available as the report has been discontinued. ↩
-
International Territorial Level 1, or ITL1, is a geographical classification standard that is defined as the regions of the UK; that is to say, the regions of England and the countries of Scotland, Wales and Northern Ireland. This is currently equivalent to the NUTS 1 standard of classification used by the UK between 2003 and 2021, with the “UK” code reference being replaced by “TL” in the tables accordingly. ↩
-
In the majority of the DCMS Economic Estimates publications the estimates of Tourism are based on results from the Tourism Satellite Account, which estimates the direct economic impact of tourism (or tourists) on the economy as a proportion of each standard industrial class. The Tourism Satellite Account produces estimates of the number of enterprises in the Tourism sector, however these estimates do not provide any further business demography information for use in this release. The figures in this release are therefore based on a “tourism industries” approach, which counts any establishment in an industry for which the principal activity is a tourism characteristic activity, i.e. it includes 100% of the businesses in a subset of the standard industrial classes. As such, the estimates for the Tourism industries in this release are larger than they might otherwise have been under a satellite account approach and therefore account for a greater proportion of the DCMS Sector total than in other Economic Estimates publications. ↩
