Background information and methodology: September 2024
Published 26 September 2024

© Crown copyright 2024
This publication is licensed under the terms of the Open Government Licence v3.0 except where otherwise stated. To view this licence, visit nationalarchives.gov.uk/doc/open-government-licence/version/3 or write to the Information Policy Team, The National Archives, Kew, London TW9 4DU, or email: psi@nationalarchives.gov.uk.
Where we have identified any third party copyright information you will need to obtain permission from the copyright holders concerned.
This publication is available at https://www.gov.uk/government/statistics/economic-labour-market-status-of-individuals-aged-50-and-over-trends-over-time-september-2024/background-information-and-methodology-september-2024
Purpose of the statistics
This statistical release for 2024 details the trends over time in the economic labour market status of individuals aged 50 and over.
This publication details the trends over time, and comparisons with 35 to 49-year-olds, in the economic labour market status of individuals aged 50 and over. These statistics allow external stakeholders to monitor changes in labour market outcomes of individuals aged 50 and over in more detail than is otherwise publicly available.
These statistics include:
- the average age of exit from the labour market. This covers the time period from 1950 to 2024
- the economic status of individuals aged 50 and over, over time. This includes employment, inactivity and unemployment rates and levels. Economic status analysis covers the time period from 1984 to 2024
- the employment rate gap between 50 to 64-year-olds and 35 to 49-year-olds
- breakdowns provided in these statistics include: gender, five-year age bands (from 50 to 75 and over), single year of age, full time/part time, hours worked, working pattern, main work location, ethnicity, qualification, length of time in current employment, sector and regional splits for those in employment
- economic inactivity rates, main reasons 50 to 64-year-olds and 50 to 65-year-olds are inactive, and proportions that are inactive that are willing or would like work, when individuals left their last job who are inactive, industry and regional splits for those inactive
- unemployment rates of 50 to 64-year-olds and 50 to 65-year-olds, length of unemployment and reasons for leaving their last job of those unemployed and inactive
These statistics provide a more detailed breakdown of the Office of National Statistics (ONS) Monthly Labour Market Statistics for data regarding people aged 50 and over. Therefore, they will not exactly match the latest monthly labour market headline statistics.
This release covers the period up to April to June 2024 (Q2 2024).
Read the latest UK Labour Market Statistical bulletin.
Context of these statistics
The measures in this release help monitor progress on 50 PLUS: Choices which aims to support individuals aged 50 and over to remain in and return to the labour market and tackle the barriers to doing so.
The UK has an ageing population and workforce, therefore, it is of growing importance to understand the economic labour market status of individuals approaching, at and above State Pension age (SPa) and how trends are changing over time.
Over the past 10 years the number of individuals aged 50+ as a proportion of the population aged 16 and over is projected to have increased from 44.2% (23.2 million) in 2014[footnote 1] to 46.7% (26.5 million) in 2024, a trend which is projected to continue over the next two decades, increasing to 47.0% (28.7 million) by 2034 and 49.3% (31.4 million) by 2044[footnote 2].
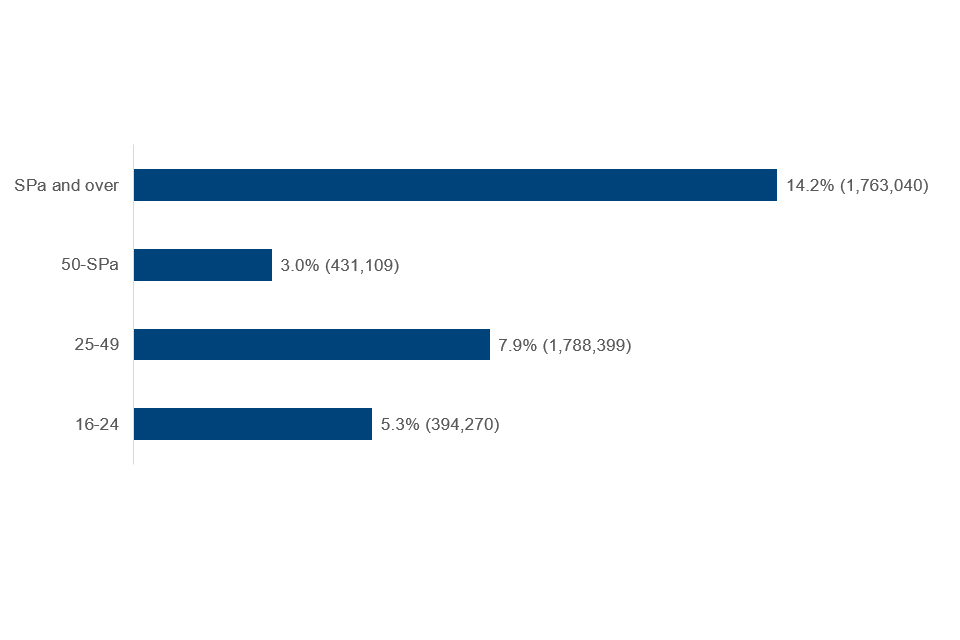
Between 2024 and 2034, it is projected that there will be approximately 0.4 million more people aged 50 to SPa (an increase of 3.0%), and 1.8 million (a 14.2% increase) more people of SPa and over. Over the same period, the 16 to 49 age population is expected to increase by 2.2 million (7.2%)[footnote 3].
Projected percentage change in population by age range, 2024 to 2034, UK
| Age range | Percentage | Number |
|---|---|---|
| SPa and over | 14.2% | 1,763,040 |
| 50 to SPa | 3.0% | 431,109 |
| 25 to 49 | 7.9% | 1,788,399 |
| 16 to 24 | 5.3% | 394,270 |
As well as this, changes to State Pension ages (SPa) are occurring. Since 2010, women’s SPa gradually increased from 60 years of age, rising to 65 by November 2018, at which point it equalled male SPa. Then from October 2020, SPa for all individuals increased to 66 years for men and women. Under Section 27 of the Pensions Act 2014 the Secretary of State has a statutory duty to periodically review whether the existing rules about State Pension age are appropriate. To date, there have been two statutory Government reviews of State Pension age.
Source of these statistics
The economic labour market status analysis in these Official Statistics has been compiled using data from the Labour Force Survey (LFS) which is produced by the ONS.
The achieved sample size for the UK LFS during April to June 2024 (AJ24) was 55,430 individuals in 25,058 households. Compared with the previous quarter January to March 2024 (JM24) this represents an increase of 9.2% in achieved person interviews and increase of 8.3% in household interviews. Respondents are interviewed five times at 13-week intervals and one-fifth of the sample is replaced each quarter.
The LFS is intended to be representative of the entire UK population. When producing estimates across the whole UK population, weighting factors provided within the LFS dataset are used. Read more about the Labour Force Survey (LFS).
To allow for a trend from 1950 to 2024, the average age of exit analysis included in these statistics has been compiled by linking LFS Q2 analysis and ONS data (from 1984 onwards) to Blöndal and Scarpetta data (pre-1984)[footnote 4]. This measure uses the economic activity rate, which is calculated as the economically active population divided by the sum of the economically active and economically inactive populations. The average age of exit is derived by multiplying each age by the probability of exiting the labour market at that age. The probability of exiting is a function of the probability of staying in the labour market[footnote 5].
The central principle is that the ratio of the economic activity rate from each age group to the next is taken to be the conditional probability of the former age group remaining economically active in the next period[footnote 6]. For the static model, developed for the International Labour Organization (ILO) in 1996, the probability of staying in the labour market is equal to the activity rate at a certain age (for example, age a) divided by the activity rate in the same year (for example, year y) for those a year younger (age a-1). The static indicator, therefore, is concerned with the ratio of the economic activity rates between two age groups within the same year[footnote 7].
There are several limitations with the static model used in the average age of exit analysis, predominately around the assumptions made, including:
- there is an age above which everyone is inactive and an age below which everyone is active. This is not realistic because people may go on working at older ages and some people under 50 are economically inactive
- once someone becomes economically active, they remain so until they leave the labour market. This is unlikely to be always true in reality, as some people take time out during their working lives for purposes such as studying, caring (particularly for women) or travelling
- factors affecting the economic activity of one cohort are the same as those affecting the activity of the next. In general, this is a reasonable assumption, but where there are policy shifts the assumption may not hold
- the activity rates used in calculations should refer to the same group of people in the numerator and the denominator. However, in the static method, the numerator and the denominator refer to activity rates of adjacent cohorts in the same year. This can be solved to some extent by using ‘moving averages’ but the problem could still persist[footnote 8]
Limitations of these statistics
The coverage of this publication is predominantly the UK. However, due to the way the Labour Force Survey (LFS) has been developed over time, the results for 1992 to 1994 are based on GB results only. In the statistical release and accompanying data tables, this time period is clearly marked on all tables and charts to ensure the user is aware of this.
The population totals used for the latest LFS estimates use projected 2022 mid-year population estimates for England and Wales, combined with estimates for Scotland and Northern Ireland. This methodology brings benefits of using the most up-to-date data on the population following the 2021 Census for England and Wales and incorporates best estimates of international migration up to mid-2022. Due to time constraints, the ONS has not been able to reweight the full statistical series. Reweighting has only occurred from July to September 2022 onwards. Read more about the recent LFS reweighting.
Between 1984 and 1991 the survey was carried out annually and from 1992 it became quarterly. The annual LFS covered the March-May period each year before 1992. We use quarter 2 (April-June) from the quarterly LFS from 1992 onwards, as it is the closest calendar quarter to the earlier estimates. By using this methodology, we are producing the most consistent analysis over the full time period, from 1984 to 2024. Read more about the LFS background and methodology.
The statistics include a breakdown of employment levels and rates by full time and part time. To note that the LFS is self-reported meaning that the definition of full time and part time work is open to interpretation by the respondents.
This publication is based on survey data. It is therefore subject to potential limitations inherent in all surveys, including:
- survey design: The LFS uses a rotational sampling design, whereby a household, once initially selected for interview, is retained in the sample for a total of five consecutive quarters. The interviews are scheduled to take place exactly 13 weeks apart, so that the fifth interview takes place one year on from the first
- sampling error: The fact that only a sample of the population has been selected and a different sample would probably produce a different estimate. This will vary to a greater or lesser extent depending on the level of disaggregation at which results are presented
- non-response error: Systematic bias due to non-response by households selected for interview in the LFS. In an attempt to correct for differential non-response, estimates are weighted using population totals
- survey coverage: The error which arises because some units are either excluded or duplicated on the sampling frame used to identify members of the population of interest
- measurement error, this is made up of 4 types:
- interviewer error arising from both conscious and unconscious differences in the way interviewers administer a survey, and also from the reactions of respondents to different types of interviewers
- respondent error arising from the inability or unwillingness of a respondent to produce a correct answer
- instrument error which reflects the effect of question wording, response categories and form design on responses
- mode error which describes the effect of different methods of administering a questionnaire on the recorded responses
- processing error: This consists of systems error and data handling error. Systems errors are errors in the specification or implementation of systems needed to carry out surveys and process results; system errors on the LFS can creep in when derived variables are specified or amended. Data handling errors are errors in the processing of survey data
- sample size: Although the LFS has a relatively large sample size for a household survey, small sample sizes for particular breakdowns may mean that specific analysis is not robust enough to report
Detailed information on LFS response rates are published each quarter in the Labour Force Survey performance and quality monitoring report.
Read Volume 1: background and methodology of the LFS user guidance for more information regarding the extent to which limitations specifically affect the LFS and the methods used to minimise the potential bias and errors that could occur.
Comparisons between statistics
The definitions of employed, unemployed and economically inactive are derived from the Labour Force Survey which uses the standard International Labour Organisation (ILO) definitions.
Definitions and terminology
Economic Labour Market Status
Employment and other labour market concepts used in this release are defined in the same way as National Statistics published by the ONS in their Labour Market Overview. In this report, everybody aged 16 or over is defined as either employed, unemployed or economically inactive.
Average age of exit from the labour market
This is the age at which people are most likely, on average, to leave the labour force. Comparisons made of the average age of exit between different years in the narrative of these Official Statistics have not been checked for statistical significance.
Economic inactivity level
The numbers of individuals who are not working, have not been looking for work within the last 4 weeks or who are unable to start work within the next 2 weeks. Examples of economically inactive individuals include individuals not looking for work because:
- they are students
- they are looking after the family or home
- of illness or disability
- they have retired
Economic inactivity rate
The economic inactivity level for those in the age group divided by the population for that age group.
Employment level
The number of individuals in work. This includes those working part time and those who are self-employed.
Employment rate
The employment level for those in the age group divided by the population for that age group.
State Pension age (SPa)
The age at which an individual becomes entitled to claim their State Pension.
Unemployment level
The number of individuals who are not working, have been looking for work within the last four weeks and are able to start work within the next 2 weeks. A common misconception is that the unemployment statistics are a count of individuals on benefits; this is not the case as they include unemployed individuals not claiming benefits.
Unemployment rate
The unemployment level for those in the age group divided by the total number of economically active individuals for that age group. Economically active is defined as those in employment plus those who are unemployed.
Working age population
The working age population is internationally recognised as people aged 16 to 64 years.
Statistical significance
Statistical significance is a technical concept that says whether an estimated value is likely to have arisen only from variations in the sampling. Testing for statistical significance allows us to decide whether we think a difference between two survey-based estimates reflects a true change in the population rather than being attributable to random variation in our sample selection.
A result is said to be statistically significant if it is likely not caused by chance or the variable nature of the samples and therefore likely to be a real change/difference.
A defined threshold can help us test for change. If the test of statistical significance calculated from the estimates at different points in time is larger than the threshold, the change is said to be “statistically significant”. A 5% standard is often used when testing for statistical significance. The observed change is statistically significant at the 5% level if there is less than a 1 in 20 chance of the observed change being calculated by chance if there is no underlying change.
Comparisons made in the narrative of these Official Statistics have only been tested for statistical significance at the 95% level when stated that the comparison “is statistically significant” or “is not statistically significant”. Not all comparisons within the narrative have been tested for statistical significance. Within the commentary of our statistical bulletin, we will avoid using the term “significant” to describe trends in our statistics and will always use “statistically significant” to avoid any confusion for our users.
Plotting estimates and their confidence intervals (a measure of the uncertainty of an estimate) gives an indication of whether or not a difference is significant. In general, if the confidence intervals of two estimates do not overlap, the estimates are significantly different.
To provide a sense of scale, the following table gives the confidence intervals around selected headline rates relating to all individuals in 2024.
| Rate | Estimate (%) | Interval Width (percentage points) | Interval Range (%) |
|---|---|---|---|
| 35 to 49 Employment Rates | 85.1 | 1.0 | 84.6 to 85.6 |
| 35 to 49 Economic Inactivity Rates | 12.5 | 0.9 | 12.1 to 13.0 |
| 35 to 49 Unemployment Rates | 2.7 | 0.5 | 2.5 to 2.9 |
| 50 to 64 Employment Rates | 70.9 | 1.1 | 70.3 to 71.4 |
| 50 to 64 Economic Inactivity Rates | 27.4 | 1.1 | 26.8 to 27.9 |
| 50 to 64 Unemployment Rates | 2.4 | 0.5 | 2.2 to 2.7 |
| 65+ Employment Rates | 11.8 | 0.8 | 11.4 to 12.2 |
Uncertainty and sample sizes
As the Labour Force Survey (LFS) is a sample survey, these estimates are subject to an associated sampling error that decreases as the sample size increases. It is the nature of sampling variability that the smaller the group whose size is being estimated, the (proportionately) less precise that estimate is.
To avoid misuse of estimates which are not sufficiently robust, we have applied reliability thresholds. If an estimate is based on less than 3 survey respondents, we have suppressed and denoted with ‘[c]’. Where the estimate is based on 3 to 25 survey respondents, these should be used with caution, and we have shaded the figure grey.
Seasonality
Quarterly estimates in this release are not seasonally adjusted. When comparing not seasonally adjusted data over time it is best practice to compare the same 3-month period for different years (for example, compare July to September 2013 with July to September 2022 but do not compare April to June 2013 with July to September 2022). This release uses the April to June quarter when reporting statistics for each year.
Rounding
Figures contained within this statistical bulletin are based on unrounded rates and levels, whereas the rates and levels presented in the Data Tables accompanying the release are subject to rounding. Proportions are rounded to the nearest decimal place and values are rounded to the nearest 1,000. For this reason, secondary analysis on the tables may not match what is presented throughout these statistics. Users should note that percentages are calculated using numbers prior to rounding and rounded to one decimal place unless otherwise stated. Percentages therefore may not add up to 100%.
Revisions to the statistics
These Official Statistics in Development use analysis derived from the Labour Force Survey (LFS) produced by the Office of National Statistics (ONS). Any revisions made to the LFS by the ONS will be included in the next release.
The ONS is in the process of improving labour market statistics through survey transformation. As part of this, ONS is seeking to improve the quality, coverage, adaptability and responsiveness of the Labour Force Survey (LFS) to ensure it continues to meet user needs. This means the LFS will eventually be replaced with the Transformed Labour Force Survey (TLFS). Read more about the TLFS.
The ONS have developed readiness criteria for the Transformed Labour Force Survey (TLFS) which is being regularly assessed as the new survey develops. The dual running of the TLFS and LFS has been extended to ensure any previous identified challenges can be investigated and provide more comparable data for users. More detailed timelines will be released in the first quarter of 2025. Whilst the TLFS is being developed further, the LFS remains the lead measure of the labour market. Read more about current timelines.
Official Statistics in Development
As part of continuing work to improve Labour Force Survey estimates (which have been affected by changes to survey operation caused by the coronavirus (COVID-19) pandemic), typical weighting methodology was reinstated from 13 February 2024. The new reweighted LFS estimates incorporate latest estimates of the size and composition of the UK population, improving representativeness. Reweighting has been applied from July to September 2022. Find more information on reweighting.
Due to the ongoing challenges with response rates and levels, LFS-based labour market statistics will be badged as ‘Official Statistics in Development’ until further review. This is in line with the letter from the Office for Statistics Regulation (OSR).
Quality statement
The analysis in this statistical publication is based on data taken from the Labour Force Survey which is closely monitored in terms of methodology and quality.
Read more about the Labour Force Survey performance and quality monitoring.
These statistics have been developed using guidelines set out by the UK Statistics Authority in the Code of Practice for Official Statistics.
The Code of Practice for Statistics is built around three main concepts, or pillars:
- Trustworthiness – is about having confidence in the people and organisations that publish statistics
- Quality – is about using data and methods that produce assured statistics
- Value – is about publishing statistics that support society’s needs for information
The following explains how we have applied the pillars of the Code in a proportionate way.
Trustworthiness
Labour Force Survey data has been produced in line with the Code and are used in highly scrutinised National Statistics publications.
Quality
Several of the key series have been taken directly from a National Statistics publication (Labour Market Overview), produced by the Office for National Statistics (ONS). The specific analyses included here have been quality-assured, including through peer-review, plausibility checks and validation against other published sources.
Value
This release provides a detailed picture of the economic labour market status of individuals aged 50 and over up to 2024. These statistics provide more detail than what is routinely published by the ONS in their Labour Market Statistics.
Making this information accessible provides Ministers and stakeholders with an overview of the labour market for those aged 50 and over, while helping to reduce the administrative burden of answering Parliamentary Questions, Freedom of Information requests and ad hoc queries.
By comparing high-level estimates from different data sources, this release also provides an evidence base drawing on several different sources, enabling a more rounded picture of broad trends.
Read more about the Code of Practice for Official Statistics.
Feedback
We welcome feedback. Tell us your views on the statistics by e-mailing: 50pluschoices.analysis@dwp.gov.uk
Useful links
Read the release of statistics and supporting tables for 2024.
-
ONS: 2021-based interim national population projections full tables, 2021-2121, UK ↩
-
ONS: 2021-based interim national population projections full tables, 2021-2121, UK ↩
-
Blöndal, S. and S. Scarpetta (1999). Average age of exit from the labour market: ONS Pension Trends and LFS Q2 Analysis. ↩
-
Mitchell and Guled (n.d). Average age of withdrawal from the labour market: A methodology update. ↩
-
Wild, R (ONS). (2006). Estimating the average age of withdrawal from the labour force. ↩
-
Mitchell and Guled (n.d). Average age of withdrawal from the labour market: A methodology update. ↩
-
Mitchell and Guled (n.d). Average age of withdrawal from the labour market: A methodology update. ↩