Local sites in positive conservation management
Updated 17 November 2026
Applies to England

© Crown copyright 2026
This publication is licensed under the terms of the Open Government Licence v3.0 except where otherwise stated. To view this licence, visit nationalarchives.gov.uk/doc/open-government-licence/version/3 or write to the Information Policy Team, The National Archives, Kew, London TW9 4DU, or email: psi@nationalarchives.gov.uk.
Where we have identified any third party copyright information you will need to obtain permission from the copyright holders concerned.
This publication is available at https://www.gov.uk/government/statistics/england-biodiversity-indicators/16-local-sites-under-positive-conservation-management
Last updated: 2026
Latest data available: 2025
Introduction
This indicator shows the proportion of the total number of Local Sites in England where positive conservation management is being implemented or has been implemented in the last 5 years. Local Sites are sites identified locally for their substantive nature conservation importance, either for wildlife or geology. Sites in positive conservation management are defined as those sites which are being managed in order to conserve their nature conservation interest. This indicator is derived from the Local Sites in positive conservation management in England, 2008-09 to 2024-25 publication, an accredited official statistic published annually. The publication includes more detailed information, including the proportion of local authorities returning data.
Assessing the extent of positive management can help to identify sites where positive management is lacking. This will help to focus the efforts of Local Site Partnerships in ensuring Local Sites are managed and their nature conservation value is maintained or enhanced.
Defra did not request data in 2020 or 2021 to reduce the burden on local authorities during the COVID-19 pandemic. This is visible as a data gap in the time series.
Data for this indicator can be found in the published datafile.
Type of indicator
State indicator
Type of official statistics
Official statistic
Assessment of change
| Measure | Assessment | Time period | Result |
|---|---|---|---|
| Percentage of local sites under positive conservation management | Long term | 2008/9 to 2024/25 | Little or no overall change |
| Percentage of local sites under positive conservation management | Short term | 2019/20 to 2024/25 | Deteriorating |
| Percentage of local sites under positive conservation management | Latest year | 2023/24 to 2024/25 | Decreased |
Notes on the indicator assessment
The long-term and short-term assessment of these measures is based on a 3% rule of thumb. The base years for these assessments use a 3-year average, see Indicator assessment summary. For the short-term assessment, a 3-year average of data from 2017/18, 2018/19 and 2021/22 was used for the base year due to missing data during 2019/20 and 2020/21.
Key results
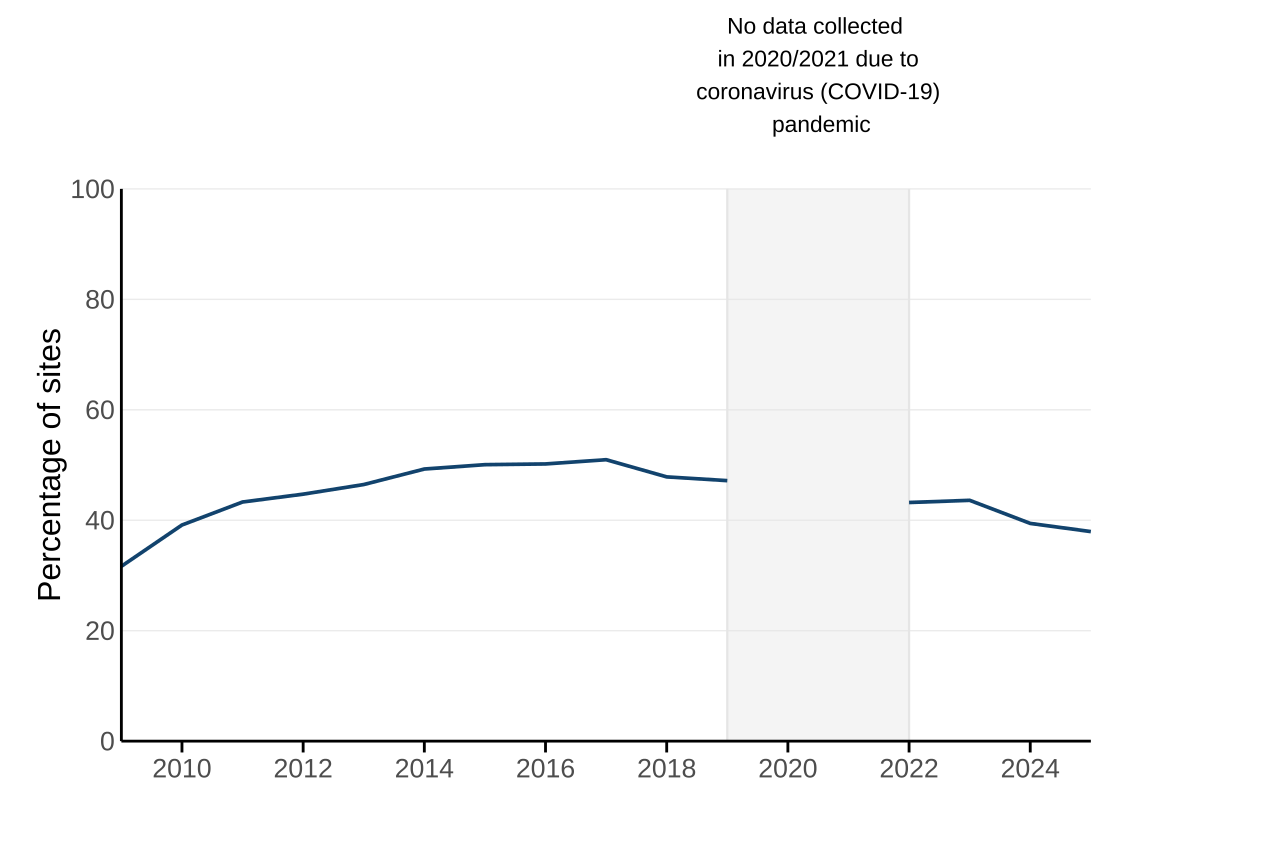
In the 5 years prior to 31st March 2025, 38% of Local Sites across England, for which we received data, were in positive conservation management. This is an increase of 6 percentage points since 2008/9 when data were first collected, and a loss of 1 percentage point since 2023/24 when the data were last collected (Figure 1).
The response rate in 2024/25 (46%), has decreased since the data were last collected. However, it is still around half what it was in 2008/9 (98%) when these data were first published. This latest decrease follows an increase in recent years that had broken a pattern of a long-term decreasing trend that began before COVID-19 impacted the response rate.
Last year we asked for the first time for a further breakdown of the results from local authorities. 42 authority areas (28% of the total number of local authorities) responded with further details for the latest year with data. In these areas, on average 93% of the Local Sites were designated as Local Wildlife Sites and the rest were Local Geological Sites or other. 36% of these Local Wildlife Sites were in positive conservation management in the 5 years prior to 31st March 2025, compared to 21% of Local Geological Sites.
Figure 1: Proportion of Local Sites in positive conservation management, England, 2008/09 to 2024/25
Source: Data collected directly from local authorities, compiled by county councils, Wildlife Trusts and Local Environmental Recording Centres
Download the data for Figure 1 in ods format
Notes for Figure 1
-
Each point on the time series represents the percentage of local sites in positive conservation management for the 5 years prior to 31st March of that year.
-
The total number of responding local authorities and number of sites varies between years. In 2024/25, 69 local authorities (46%) were included in the analysis.
-
No data were requested from local authorities in 2019/20 and 2020/21 due to the anticipated resourcing issues resulting from complying with COVID-19 restrictions. This data gap is represented by the grey vertical lines and shaded area.
Further detail
Some local authorities chose to explain the reasons for changes to their results from previous years. Although this is not necessarily representative of all local authorities, it does give an insight into possible reasons for change.
This year typical reasons for a reduction in proportion of sites in positive conservation management given include:
-
Land management schemes such as Countryside or Environmental Stewardship coming to an end. This coincides with few new agri-environment scheme options due to the gradual transition to Environment Land Management Schemes.
-
Inaccessibility of some private sites.
-
Existing management plans becoming outdated.
However, there have also been signs that positive changes have been taking place, such as:
-
New reviews of management plans by local authorities and other landowners.
-
New stewardship schemes becoming available.
-
New teams for the management of Local Sites being set up.
Out of the 150 local authorities expected to submit their results this year, 69 (46%) did so. The majority of local authorities that did not submit data this year also failed to provide data last year (2023/24), or in a number of previous years. 16 local authorities did not submit data for the first time this year.
This year typical reasons for not reporting these data to Defra include:
-
Fewer surveys being completed due to a lack of funding, which might then impact sites qualifying for future management grants due to out-of-date survey information.
-
Response rate from local authority districts and boroughs, as well as private landowners who then report the data to local authorities or Local Sites Partnerships who report to Defra, was lower than in previous years.
-
Changes and reductions in staffing levels have impacted local authorities’ ability to carry out the assessments needed to provide these data.
The reduction in response rate in recent years has impacted the quality of these data. In 2025 the Local Wildlife Sites System Status Review 2025 estimated there to be over 44,000 Local Sites in England, while our most recent data for 2024/25 covers 20,211 sites.
Relevance
Local Sites contribute towards our commitments for biodiversity, both nationally through the Environmental Improvement Plan and internationally through the Kunming-Montreal Global Biodiversity Framework.
In England, we have a network of nationally and internationally designated sites. These include: Sites of Special Scientific Interest; Special Areas of Conservation; Special Protection Areas; and Ramsar sites. Local Sites can connect and buffer these areas to provide wildlife refuges for a diverse range of flora and fauna. They also provide essential habitat for populations of rare and declining species.
Local Nature Recovery Strategies (LNRS) will map existing local wildlife sites as ‘areas of particular importance for biodiversity’. Building on the location of these (and other protected) sites, the LNRS will identify the best locations to connect and buffer these sites. This includes creating stepping stones and expanding areas of wildlife-rich habitat to support recovery and resilience of the ecological network and the environmental services they provide.
Delivering 30by30 on land in England, published in December 2023, recognised the potential contribution of Local Sites in England to the commitment to protect 30% of the UK’s land by 2030. Where Local Sites are identified for their biodiversity value, there is potential for them to contribute to our ambitious target of halting species decline by 2030 and reversing it by 2042.
A number of these sites also comprise significant UK geodiversity. The UK Geodiversity Action Plan (UKGAP) provides a shared framework for the delivery of geoconservation through a series of objectives and targets. The UKGAP is often supported locally through Local Geodiversity Action Plans (LGAPs) developed and delivered by local geoconservation groups and a range of partners.
Local Sites provide many opportunities in addition to conservation action to protect habitats and species. They provide ecological services to their communities on a local level. Services including, natural processes that maintain air, soil and water quality, as well as contributions towards well-being and quality of life. They are also important locations for education and research, where they can act as reference sites for monitoring change in a changing climate.
International and domestic reporting
The UK and England Biodiversity Indicators are used for a variety of reporting and other purposes. This includes international reporting, such as the UK’s National Reports to the Convention on Biological Diversity (CBD) on progress towards the goals and targets of the Kunming-Montreal Global Biodiversity Framework. They are also used to track the state of biodiversity domestically, such as in England’s Environmental Indicator Framework.
Web links for further information
- Defra published guidance on the identification, selection and management of Local Sites
- Local Wildlife Sites System Status Review 2025
- Delivering 30by30 on land in England
- UK Geodiversity Action Plan
- GeoConservationUK
- Local Nature Recovery Strategies
Acknowledgements
Thank you to the many people who have contributed by providing data and to the many colleagues who have helped produce this indicator.
Technical annex
Background
Local Sites are non-statutory areas identified at local level for their significant nature conservation value. They include both local wildlife sites (identified for significant biodiversity value) and local geological sites (identified for their significant geological value). Local Site systems are operated at a local level, with local authorities working with Local Sites Partnerships made up of key stakeholders.
According to the Local Wildlife Sites System Status Review 2025, there are estimated to be more than 40,000 Local Sites in England, covering over 750,000 hectares of coastal, rural and urban situations. Although they do not have statutory status, many are equal in quality to statutory Sites of Special Scientific Interest (SSSIs). They are an important component of England’s ecological network and have an important role to play in meeting our national biodiversity objectives.
There are currently a number of different terms in use locally to describe these sites. These include: Sites of Importance for Nature Conservation (SINCs); Sites of Nature Conservation Importance (SNCIs); and Regionally Important Geological Sites (RIGS). Defra uses the common term Local Site.
Defra published guidance on the identification, selection and management of Local Sites in 2006. Work is underway to determine what supplementary information could be helpful to provide.
Methodology
These data (found in the accompanying datafile) are from local authority single data list 160-00 on local nature conservation/biodiversity.
The data for 2010/11 to 2018/19, and 2021/22 to present were collected by Defra from unitary and higher tier local authorities. Data for 2008/09 and 2009/10 were previously published by the Department for Communities and Local Government.
In 2024/25, 46% of local authorities submitted data on Local Sites, compared with 50% in 2023/24 when data were last collected. This includes authorities that have provided a partial data return, for example those with number of Local Sites only. A total of 69 local authorities were included in the analysis in 2024/25. 65 local authorities were excluded due to not providing data for 3 consecutive years (noting that Defra did not request data in 2019/20 or 2020/21). A total of 16 local authorities were imputed, bringing the total number of data points up to 85 this year.
Some local authorities chose to explain the reasons for changes to their results from previous years. Although this is not necessarily representative of all local authorities, it does give an insight into possible reasons for change.
The number of local authorities changes relatively infrequently over time, with some local authorities merging and others dividing into multiple groups. In 2024/25, there were 150 authorities, the same as the previous year.