Area of land in agri-environment schemes
Updated 17 November 2026
Applies to England

© Crown copyright 2026
This publication is licensed under the terms of the Open Government Licence v3.0 except where otherwise stated. To view this licence, visit nationalarchives.gov.uk/doc/open-government-licence/version/3 or write to the Information Policy Team, The National Archives, Kew, London TW9 4DU, or email: psi@nationalarchives.gov.uk.
Where we have identified any third party copyright information you will need to obtain permission from the copyright holders concerned.
This publication is available at https://www.gov.uk/government/statistics/england-biodiversity-indicators/area-of-land-in-agri-environment-schemes
Last updated: 2026
Latest data available: 2025
Introduction
This indicator measures the area of land under agri-environment scheme actions which are delivering biodiversity-positive outcomes, and presents this as a proportion of the total agricultural area in England. Since the UK left the EU, environmental land management schemes in the Agricultural Transition Plan have been used to encourage benefits on agricultural land in England.
The Sustainable Farming Incentive (SFI), Countryside Stewardship (CS) and new Countryside Stewardship Higher Tier (CSHT) schemes are payment schemes incentivising farmers to take beneficial land management actions. As of December 31 2025, there were around 37,000 payment agreements with farmers in place across England, including a range of actions including those which directly support biodiversity, as well as other environmental benefits such as soil or water quality.
The methodology for this indicator has been reviewed since the last publication due to changes in schemes and available data.
Data for this indicator can be found in the published datafile. We are developing a similar indicator at the UK level.
Type of indicator
State indicator
Type of official statistics
Official statistic in development. This newest iteration of this indicator reflects significant changes in the administration of and actions included in agri-environment schemes in England. Comments and feedback on the methods chosen are welcome; please email us. For more information, please visit the UK Statistics Authority’s website on Types of official statistics – UK Statistics Authority.
Assessment of change
As this is an official statistic in development, it has not been assessed.
Key results
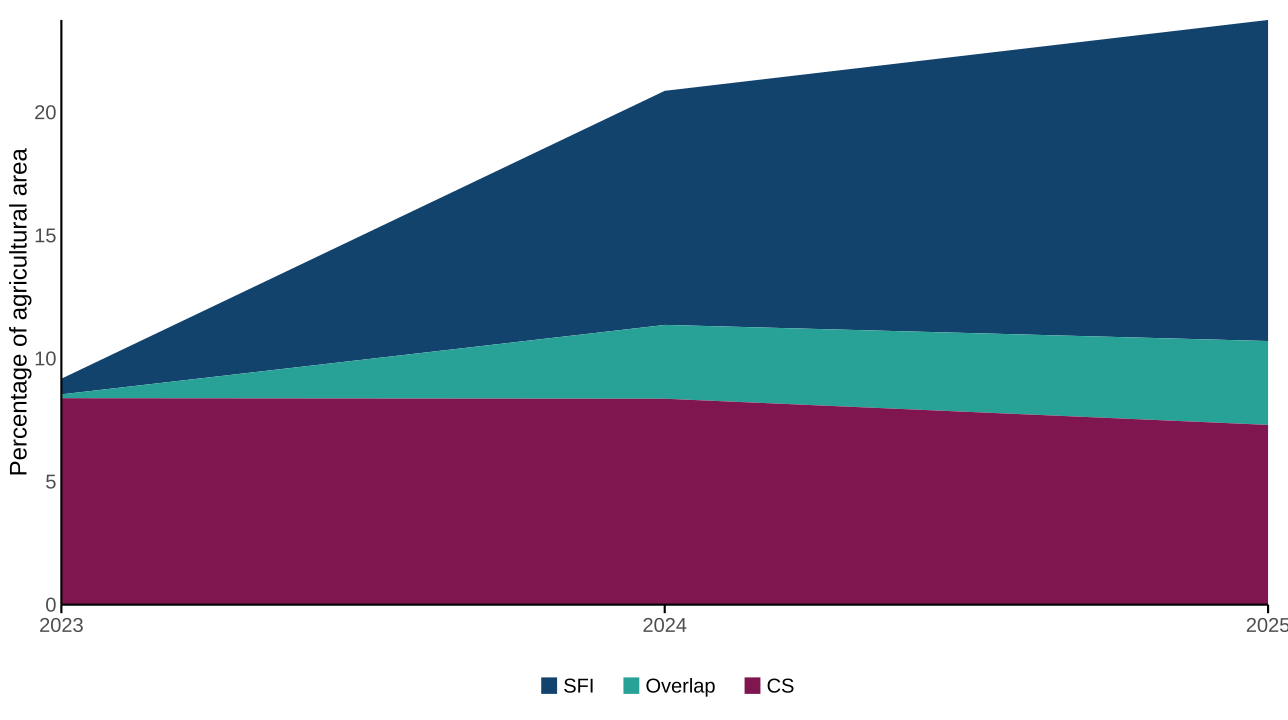
Thirty four actions spanning SFI, CS and CSHT were identified as strongly benefiting biodiversity. At the end of 2025, these actions covered 2.2 million hectares of agricultural land in England (Figure 1; Table 1). This is approximately 36% of the total 6.1 million hectares covered by all agri-environment actions and 24% of the total agricultural area of England. This is an increase from 1.9 million hectares in 2024 and 0.86 million hectares in 2023 and shows that the land area covered by these actions has more than doubled over this time. Detail of actions included can be found in Table 2 (see Technical Annex).
Of the actions included here, the Sustainable Farming Incentive covered 1.2 million hectares in 2025; Countryside Stewardship covered 0.68 million hectares; Countryside Stewardship Higher Tier 279 hectares, and 0.32 million hectares are land parcels with actions belonging to more than one scheme. Actions covering the largest area largely relate to grasslands, and include low-input grasslands and the use of grass, herbal and legume leys. Actions outside those included here may also be nature-positive via their impact on soil or water quality rather than directly on biodiversity.
Figure 1: Proportion of agricultural land in England covered by biodiversity-positive actions, 2023 to 2025
Source: Department for Environment, Food and Rural Affairs
Notes about Figure 1
- The data shown here is the total of land to which the actions included have been applied as at 31 December for the identified year, in line with other similar statistics (see Table 1).
- ‘Overlap’ denotes the total area of agreements on parcels where actions from more than one scheme are present.
- Where multiple actions are present on a parcel, figures represent the middle estimate of area coverage; totals may therefore differ from other estimates of area coverage.
- Table 2 contains details of the actions included here.
- As more than one action can be applied to a land parcel, the action totals in Table 2 do not sum to the totals displayed here.
- This figure excludes Countryside Stewardship Higher Tier due to low uptake within the time period.
Table 1: Area of agricultural land in England covered by biodiversity-positive actions, 2023 to 2025
| Scheme | 2023 | 2024 | 2025 |
|---|---|---|---|
| SFI | 59,773 | 882,070 | 1,219,046 |
| CS | 788,095 | 775,840 | 682,407 |
| Overlap | 14,735 | 278,253 | 318,218 |
| CSHT | - | - | 279 |
| Total | 862,603 | 1,936,163 | 2,219,950 |
| Percentage of total agricultural area | 9.2% | 20.9% | 23.8% |
Source: Department for Environment, Food and Rural Affairs
Notes about Table 1
- The data shown here is the total of land to which the actions included have been applied as at 31 December for the identified year, in line with other similar statistics.
- ‘Overlap’ denotes the total area of agreements on parcels where actions from more than one scheme are present.
- Where multiple actions are present on a parcel, figures represent the middle estimate of area coverage (see Methodology); totals may therefore differ from other estimates of area coverage.
- Table 2 contains details of the actions included here.
- As more than one action can be applied to a land parcel, the action totals in Table 2 do not sum to the totals displayed here.
Source: Defra Farming and Countryside Programme, Evidence and Analysis and Rural Payments Agency
Further detail
The SFI scheme offers payments to land managers for carrying out activities that benefit the environment on their land. The SFI Pilot launched in 2021, followed by a limited rollout of the full scheme in 2022 (SFI22). All agreements from SFI22 closed on 31 March 2023 and many agreement holders started new agreements in SFI23. SFI23 was opened in October 2023 and was open to applications until June 2024, when it was superseded by the SFI Expanded Offer. The SFI Expanded Offer opened on 31 May 2024 using a “controlled rollout”, where applicants had to register their interest with the Rural Payments agency (RPA) and were then invited to apply. The scheme closed to new applications on 11 March 2025. There is a limit on payments of £100,000 per farm. Farmers and land managers can choose from a range of 71 actions, which are bundled together into sets with a particular focus; for example actions for sustainable soils, invasive species management, and woodland management; this is to enable farmers and land managers to choose a sub-set of actions which are most appropriate and beneficial to their specific context. All actions and data presented here relates to SFI23, the SFI Expanded Offer, and the new Countryside Stewardship Higher Tier which relaunched in 2025, with a focus on higher tier actions. All new agreements are within these schemes, and there are some active long-term agreements under older schemes.
Changes from the previous methodology
Previous schemes such as Countryside Stewardship and Environmental Stewardship offered funding to farmers and land managers for managing land in ways that protected, restored, or enhanced the environment, while also helping to mitigate the effects of climate change. These schemes categorised actions into tiers; Entry-Level Stewardship (ELS) and Higher-Level Stewardship (HLS). Whilst ELS encouraged farmers and other land managers to undertake a broad range of activities to provide environmental benefits, HLS was a more targeted scheme. The previous version of this indicator followed the approach of these schemes, and categorised agri-environment schemes into two groups, and it was possible for land to be counted in both:
- Entry-level schemes had a simple set of prescriptions providing basic environmental protection and enhancement, where the whole farm area may contribute to the indicator.
- Higher-level or targeted schemes protect or restore land, focusing on parts of the farm or land-holding that are of high environmental/biodiversity value or potential.
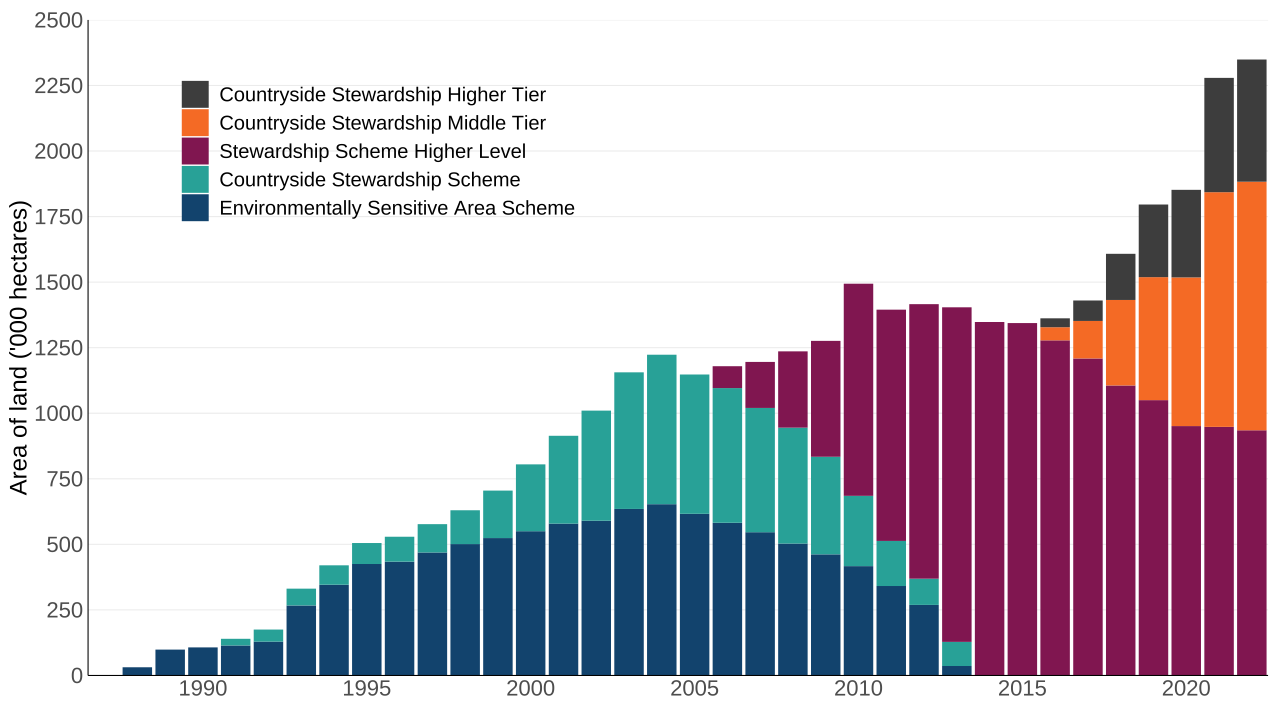
The previous methodology did not quantify individual actions, and instead categorised whole agri-environment schemes into those which delivered benefits specifically for biodiversity and those which did not. Consequently far larger estimates of area were produced in the previous methodology (Figure 2); in 1992, there were 175,000 hectares of land in England in Environmentally Sensitive Areas (ESA) and the previous Countryside Stewardship Scheme (CSS), which were higher-level or targeted schemes. Uptake of the schemes increased over time and in 2022, there was around 2.3 million hectares in these schemes.
As a result of these schemes closing, and because the SFI does not classify actions into tiers, it was not possible to continue the previous methodology for this indicator. However, data for the previous methodology can be found in the published datafile and Figure 2 displays the area covered by these schemes from 1987 to 2022. Although the new indicator (Figure 1) currently has a short time series, the overall trend shown by both the old and new indicators is that of a general increasing total in the area of land covered by agri-environmental scheme agreements which deliver a positive impact for biodiversity.
Figure 2: Area of land under previous targeted agri-environment scheme agreements in England, 1987 to 2022
Source: Department for Environment, Food and Rural Affairs
Notes about Figure 2
- Higher-level schemes had stricter criteria for qualification than entry-level agri-environment schemes.
- Schemes were not directly comparable as they had different reporting requirements and different objectives.
- Systematic data collection started in 1992; areas from 1987 to 1991 are estimated.
- Higher-level Stewardship (HLS) Scheme includes freestanding HLS and HLS linked to Entry Level Schemes (ELS).
- Countryside Stewardship schemes Higher Tier and Middle Tier – the area for 2016 includes some double-counting of areas due to options occupying the same area. Without double-counting, this total area is 76,498 hectares.
Relevance
The Environmental Improvement Plan aims to take measures to support wildlife on farms and has a commitment to “Support farmers and land managers to manage wildlife-rich habitat using appropriate agri-environment options for the habitat type, so the habitat can stay, or become of, sufficient quality”. In 2025, the total agricultural area of England was 9.3 million hectares, covering approximately 72% of the total land area; encouraging biodiversity on this land can potentially have huge benefits for nature.
International and domestic reporting
The UK and England Biodiversity Indicators are used for a variety of reporting and other purposes. This includes international reporting, such as the UK’s National Reports to the Convention on Biological Diversity (CBD) on progress towards the goals and targets of the Kunming-Montreal Global Biodiversity Framework. They are also used to track the state of biodiversity domestically, such as in England’s Environmental Indicator Framework.
Web links for further information
- Sustainable Farming Incentive (SFI)
- Countryside Stewardship Higher Tier (CSHT)
- Countryside Stewardship (CS)
- Environmental Stewardship (ES)
- Rural Payments Agency
- Qualitative Environmental Impact Assessment (QEIA)
Acknowledgements
Thank you to the many people who have contributed by providing data and to the many colleagues who have helped produce this indicator, particularly the Defra Farming Directorate, Evidence and Analysis team.
Technical annex
Methodology
The area of land in England under agriculture is assessed in a range of ways. For the denominator of this indicator, we use the total agricultural area rather than the utilised area, as woodlands and other land are key resources for biodiversity. The total agricultural area of England has decreased from 9.9 million hectares in 1983 to 9.4 million hectares in 2025, a decrease of 6%. In 2025, this represents around 72% of the total land area of England. Agri-environment and land management actions which encourage farmers to deliver environmental benefits on this land clearly have very large potential benefits; these actions conserve wildlife; maintain and enhance landscape quality and character; protect the historic environment and natural resources; and promote public access and understanding of the countryside.
To ensure that land management actions were effective and impactful, Defra commissioned the UK Centre for Ecology and Hydrology (UKCEH) to carry out a Qualitative Environmental Impact Assessment (QEIA), which assessed the outcomes of 741 actions against a wide range of environmental and climate goals and commitments. The QEIA scored actions which demonstrated limited, moderate or major benefits to biodiversity and additionally returned qualitative impact scores for the current evidence base:
- Red for actions with significant potential disbenefit
- Amber for actions with limited evidence chains or potential disbenefits
- Green for well tested and complete evidence chains
This indicator focuses on 34 Green actions with moderate or major benefits from the Biodiversity theme of the QEIA (Table 2); these are therefore the actions with the most positive outcomes for biodiversity assessed via their benefits and evidence base. Actions with an Amber evidence base were excluded as it was considered that this evidence was not strong enough; however such actions may be included in future if the evidence is strengthened. Additionally, as the QEIA assessed generic land management actions rather than specific schemes, a mapping exercise was conducted to link QEIA actions with those available within agri-environment schemes. These links were assigned a confidence level determining whether the actions were functionally the same, and only actions which mapped with high confidence are included in this indicator. We would like to hear from our users about this adapted methodology, please email us.
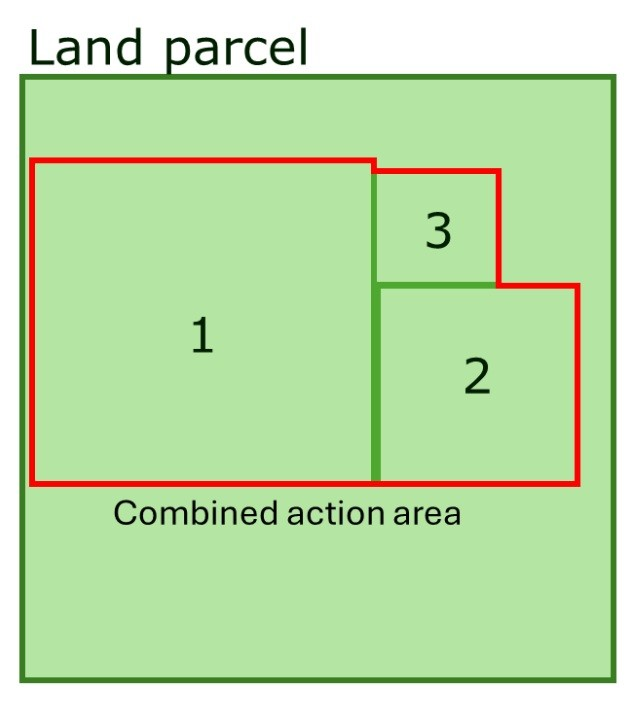
For this indicator, the area presented is calculated as the sum of the actions on a land parcel, capped at the parcel area. This is because actions can overlap within a parcel; if the total area of actions within a parcel is larger than the total parcel area, it is assumed that actions cover the whole parcel, and the parcel area is used. However, if the actions sum to less than the parcel area, the area of the actions is used; it is assumed that the actions do not overlap (Figure 3). This method is equivalent to the middle estimate calculation in the statistical publication Area under agri-environment schemes in England at 31st December 2025, which also contains further details about the calculation of minimum and maximum areas.
Figure 3: Middle estimate of action coverage within a land parcel
Source: Department for Environment, Food and Rural Affairs
Notes about Figure 3
- The area is calculated assuming that actions do not overlap.
- If the sum of actions on a parcel is larger than the parcel area, parcel area is used instead.
Each parcel has been attributed to a scheme based on the combination of actions present. If all present actions are from the same scheme, the parcel has been labelled as such, but if actions from more than one scheme are present, the parcel has been presented as ‘Overlap’. Hedgerow actions are converted from metres to areas based on recommendations from Natural England. No land under legacy Environmental Stewardship agreements is included in this new methodology, as none of the QEIA-filtered actions are active in these agreements.
Using this approach, the headline data presented here is therefore the total agricultural land covered by any of these QEIA-matched actions which have a well-evidenced positive impact on biodiversity. They tend to focus on: farm wildlife and habitat creation, restoration, and maintenance; and they aim to increase nesting and shelter sites, pollen and nectar sources, winter food, or other habitat provision (Table 2).
Table 2: Area of land covered by biodiversity-positive agri-environment actions (hectares), 2023-2025
| Action | 2023 | 2024 | 2025 |
|---|---|---|---|
| Use very low inputs on permanent grassland | 397,109 | 687,426 | 757,813 |
| Use herbal and grass leys | 19,392 | 359,296 | 440,148 |
| Plant / maintain mass flowering crops e.g. legume leys | 89,376 | 288,351 | 327,318 |
| Provide feeding areas to support the lifecycles of wild birds (e.g. wild bird seed mix) | 64,311 | 174,810 | 206,164 |
| Replace grazing of sheep with cattle grazing, particularly on limestone habitats | 65,777 | 97,928 | 128,213 |
| Use low-intensity grazing systems using biodiverse sward mixtures | 101,965 | 115,717 | 104,513 |
| Create flower-rich and species rich grass margins, field corners, and plots | 43,431 | 70,248 | 74,274 |
| Enhanced overwinter stubble | 51,646 | 60,309 | 73,935 |
| Harvested low input cereal | 23,936 | 39,460 | 62,465 |
| Enhance and manage locally distinctive flower rich / hay meadows using traditional techniques | 12,744 | 21,110 | 45,620 |
| Enhance or manage species-rich grassland habitats | 29,284 | 42,732 | 43,387 |
| Provide a flower rich habitat for wild pollinators with a range of flowering times and flowering structures | 14,958 | 36,210 | 38,152 |
| Enhance / manage hedgerows | 11,102 | 27,830 | 32,536 |
| Create in-field vegetation including grass, scrub, trees | 1,720 | 24,822 | 24,378 |
| Create wood pasture (e.g. through appropriate grazing) | 10,097 | 15,325 | 15,555 |
| Manage a permanent grassland for Scheduled Monuments / heritage assets on the SHINE database (that are not Listed Buildings or Scheduled Monuments) | 14,728 | 13,734 | 11,844 |
| Leave unharvested cereal headlands | 2,738 | 6,535 | 11,247 |
| Create contour grass strips | 8,007 | 9,832 | 10,175 |
| Create species-rich grassland habitats | 1,180 | 1,853 | 9,872 |
| Annually cultivate headlands and leave unsown | 5,566 | 7,081 | 8,019 |
| Enhance / manage wood pasture (e.g. through appropriate grazing) | 3,099 | 6,265 | 6,349 |
| Plant and establish appropriate species of field boundary trees | 0 | 857 | 3,569 |
| Set ryegrass seed as winter food for birds | 3,069 | 3,746 | 3,469 |
| Planted Ancient Woodland (PAWS) restoration | 1,189 | 2,006 | 2,050 |
| Create rush pasture (defined as wet grassland) | 561 | 748 | 731 |
| Create buffer zones around ancient woodland (including through extension of existing woodland) | 341 | 361 | 321 |
| Enhance / maintain sand dunes | 0 | 0 | 272 |
| Create beetle banks | 177 | 232 | 239 |
| Create heathland (including heathland mosaics) | 98 | 151 | 162 |
| Re-naturalise river catchments by, for example, reconnecting rivers with their floodplain, restoring and realigning rivers, and restoring associated floodplain habitats. | 80 | 134 | 135 |
| Create inter-tidal and saline habitats | 90 | 92 | 92 |
| Enhance / manage rides, edge habitats and open space (for biodiversity including for pollinators) | 0 | 0 | 0 |
| Enhance or manage riparian habitats | 0 | 0 | 0 |
| Use low intensity mixed livestock grazing | 0 | 0 | 0 |
Source: Defra Farming and Countryside Programme, Evidence and Analysis and Rural Payments Agency
Notes about Table 2
- As more than one action can be applied to a land parcel, the scheme totals in Figure 1 are not the sum of the areas displayed here.
- Not all actions identified in the QEIA filter used for this indicator have been taken up in current agri-environment schemes; actions are listed here for completeness.
Caveats and limitations
Because of the short time series of the new SFI data, and because this new indicator methodology remains under development, it should be interpreted with caution and has not been assessed.
Development plan
Since our previous publication we have adapted the methods used in this indicator. We are keen to hear from our users about these changes, especially on our selection of actions to include. In the future we intend to expand this methodology to the whole of the UK, and explore other less stringent criteria as well as back-casting to provide an overlap between the old methodology and this new approach. Please see our published development plan, or email us.