Statistics on Ethnicity and the Criminal Justice System, 2022 (HTML)
Updated 19 March 2024
Applies to England and Wales
We are trialling the publication of this statistical bulletin in HTML format alongside the usual PDF version and we are seeking user feedback on the use of HTML for the publication of statistical bulletins. Please send any comments to: datausers@justice.gov.uk.
1. Executive Summary
This publication compiles statistics from data sources across the Criminal Justice System (CJS), to provide a combined perspective on the typical experiences of different ethnic groups. No causative links can be drawn from these summary statistics. For the majority of the report, no controls have been applied for other characteristics of ethnic groups (such as average income, geography, offence mix or offender history), so it is not possible to determine what proportion of differences identified in this report are directly attributable to ethnicity. Differences observed may indicate areas worth further investigation but should not be taken as evidence of bias or as direct effects of ethnicity.
However, as part of our user engagement strategy, we found a need to provide further insight into the court outcomes of different ethnic groups, beyond descriptive statistics. Consequently, the Offence Analysis chapter for ECJS 2022 analyses the association between an offender’s ethnicity and receiving a custodial sentence for indictable offences - the focus throughout is firstly, to investigate whether trends have changed over time (2018-2022) and secondly, whether trends vary across offence groups (violence against the person, sexual offences, and drug offences). Initially, it uses Relative Rate Index (RRI) and then a logistic regression is conducted to control for various offender and case characteristics. This analysis is labelled Official Statistics and is not a permanent addition to the ECJS publication. If these statistics are beneficial to you, please get in touch to ensure they continue to be collected in future editions of ECJS.
In general, ethnic minorities (excluding white minorities) appear to be over-represented at many stages throughout the CJS compared with the white ethnic group. This is especially apparent when comparing to the ethnic breakdown of the population of England and Wales[footnote 1]. The greatest disparity appears at the point of stop and search, custodial remands and prison population. Among ethnic minorities (excluding white minorities), black individuals were often the most over-represented. At various points across the CJS, the disparity holds for children from ethnic minorities (excluding white minorities). Differences in outcomes between ethnic groups over time present a mixed picture, with disparity decreasing in some areas and widening in others.
Figure 1.01: Ethnicity proportions for adults throughout the criminal justice system, 2022[footnote 2]
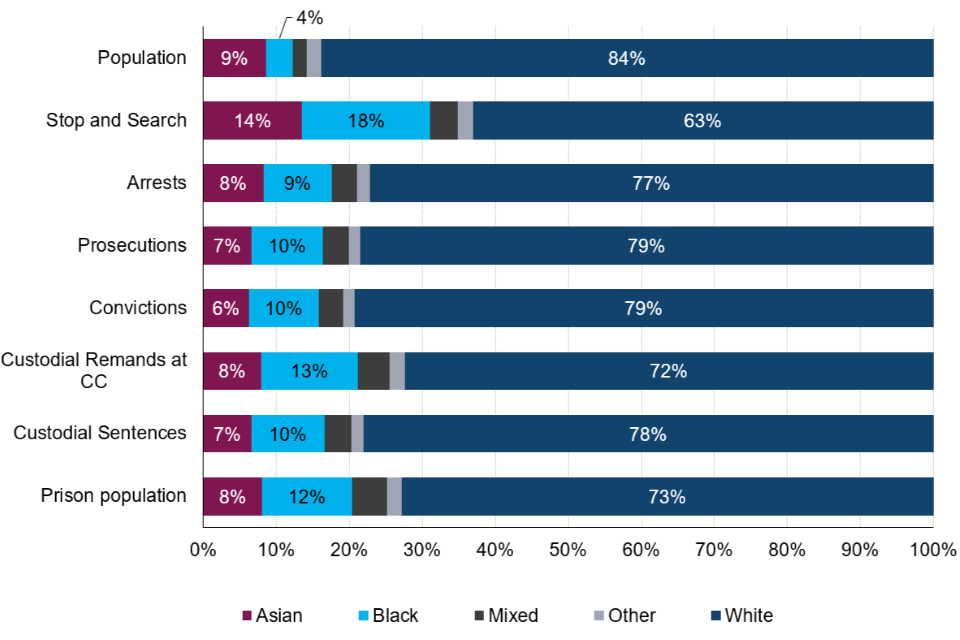
(Source: See sources via relevant chapters throughout the report)
Figure 1.02: Ethnicity proportions for children throughout the criminal justice system, 2022[footnote 3]
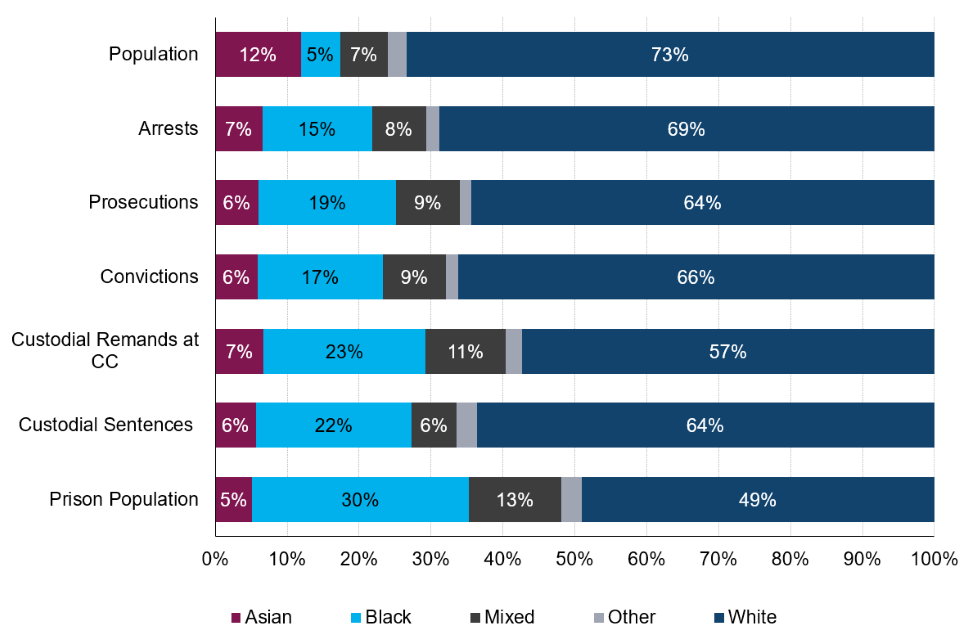
(Source: See sources via relevant chapters throughout the report)
Key messages
Victims
| Since 2018/19, levels of personal crime, excluding fraud and computer misuse, have decreased significantly from 4.1% to 2.5%. | There were statistically significant decreases in the prevalence of personal crimes since 2018/19 in the black (from 6.0 to 1.8%) and white (from 4.2 to 2.6%) ethnic groups. |
| Between 2019/20 and 2021/22, a third of black homicide victims were aged 20 or younger. | This compares to 13% of white victims and 25% of victims from the other ethnic group. |
Police Activity
| Between 2019/20 and 2022/23, the proportion of stop and searches for people from the white ethnic group increased from 60% to 69%. | Over this period, there were corresponding decreases in proportions accounted for by black individuals (21% to 14%) and Asian individuals (13% to 11%). |
| In 2022/23, white individuals accounted for 78% of arrests, 8% were of black individuals, 8% were of Asian individuals, 4% were of mixed ethnicity individuals and 2% were of other ethnicity individuals. | Relative proportions of arrests across ethnic groups remained relatively stable between 2019/20 and 2022/23, with a slight increase in the proportion of individuals from the white group and corresponding decrease in those from the black ethnic group. |
| In 2022/23, 69% of children arrested in London were from ethnic minorities (excluding white minorities) | A larger proportion of arrests in London were for individuals from ethnic minorities (excluding white minorities), at 56%, compared to 17% across the rest of England and Wales. |
Defendants
| Convictions for drug offences accounts for the largest proportion of convictions for all other ethnic groups combined. | In 2022, the largest proportion of convictions for all other ethnic groups combined was for drug offences (28% to 36%), while the largest proportion of convictions for white defendants was for violence against person offences (25%). |
| Since 2018, white defendants have had a consistently lower average custodial sentence length (ASCL) than all other ethnic groups combined for indictable offences. | In 2022, white offenders had an ACSL of 21.2 months in comparison to 30.5 months for Asian offenders, 27.9 months for black offenders, 25.2 months for mixed offenders and 22.9 months for the other ethnic group. |
| Black defendants were more likely to elect themselves to be heard at Crown Court. | In 2022, the black ethnic group had the highest proportion of defendants electing themselves to be heard at a Crown Court, at 27%. This was followed by defendants from the mixed ethnic group (21%), Asian and other defendants (18%), and white defendants (15%). |
Offender Management
| A greater number of children in prison were from ethnic minorities (excluding white minorities). | The ethnicity of prisoners varied across age groups, with a higher proportion of younger prisoners being from all other ethnic groups combined (51% of under 18-year-olds). In contrast, 16% of prisoners aged 50 or over were from all other ethnic groups. |
| Black prisoners served the greatest proportion of their original sentence in custody. | In line with previous years, black defendants continued to serve a greater proportion of their original determinate sentence in custody (68% in 2022) when compared with mixed (64%) white (59%), Asian (58%) and prisoners from other ethnic groups (61%). |
| In the 2022/23 HM Inspectorate of Prisons survey, prisoners from ethnic minorities (excluding white minorities) reported more negative results across the survey. | With slight differences between males and females, in comparison to other ethnic groups, higher proportions of white prisoners generally reported more positive experiences within prisons, including feeling respected by and receiving less abuse/victimisation from staff, access to daily showers, and having enough cleaning facilities. |
Offender Characteristics
| In 2022, 77% of all males prosecuted for indictable offences were from the white ethnic group, compared to 86% of all females prosecuted. | The proportion of defendants from the black ethnic group was 11% of all male prosecutions, compared to 6% of all female prosecutions. |
| A higher proportion of prosecutions for mixed and black ethnic groups were against children, 12% and 9%, respectively, compared to 4% for defendants from the white ethnic group. | In 2022, children from the black ethnic group received longer custodial sentences, at 23.8 months on average, an increase of 3.6 months compared to 2018 (20.2 months). |
| The reoffending rate of adults was highest for those aged 18-20 for ethnic minorities (excluding white minorities). | The reoffending rate for offenders from the black, Asian, and other ethnic groups was highest for those aged 18-20. For offenders from the white ethnic group, those aged 35-39 presented the highest reoffending rate. |
| The educational attainment of young people who were cautioned or sentenced for an offence was lowest for the white ethnic group, across all three measures. | Of young people from the white ethnic group matched to a KS4 attainment record in academic years 2013/14 and 2014/15, 12% achieved 5 or more GCSEs (or equivalents) graded A* to C, compared to other ethnic groups at 24%. |
| More than half of young people who were cautioned or sentenced for an offence were eligible for Free School Meals (FSM) across all ethnic groups. | This was highest across young people from other ethnic groups, at 64%, followed by the black ethnic group at 63%, compared to the white ethnic group at 52%. This contrasts with the proportion of pupils in the all-pupil population where 26% were eligible for FSM. |
Practitioners
| The ethnic profile of practitioners in the Criminal Justice System (CJS) has become slightly more diverse over the last 5 years. | The proportion of staff from white backgrounds has decreased between 1 and 3 percentage points across all CJS organisations over the last 5 years, as a result of increases in the proportion of staff from all other ethnic groups. |
Offence analysis
| There was an association between an offender’s ethnicity and receiving a custodial sentence for indictable offences between 2018 and 2022. | When controlling for various offender and case characteristics within logistic regression models, there was a statistically significant association for offenders of black and mixed ethnicity with increased odds of receiving a custodial sentence compared to the white ethnic group, across all five-years 2018-2022. |
| The extent of ethnic disparity in custodial sentencing varied across offence groups. | When controlling for various offender and case characteristics within logistic regression models, the clearest disparity was seen for drug offences, where offenders from most ethnic minority groups were associated with a statistically significant increase in odds of receiving a custodial sentence. To a lesser magnitude, the black and mixed ethnic groups were also associated with increased odds of receiving a custodial sentence for violence against the person offences and sexual offences. |
| Differences were observed between granular ethnicities within the same aggregated ethnic groupings. | The logistic regression analysis highlighted the value of utilising detailed ethnic groupings when analysing ethnic disparity in sentencing, otherwise specific findings can be masked when limiting the approach to only include aggregated groupings. For example, the magnitude of association for the Chinese ethnic group being sentenced to custody for drug offences was notably larger compared to alternative ethnicities within the aggregated Asian group. |
2. Introduction
Section 95 of the Criminal Justice Act 1991 states that:
The Secretary of State shall in each year publish such information as he considers expedient for the purpose… of facilitating the performance of those engaged in the administration of justice to avoid discriminating against any persons on the ground of race or sex or any other improper ground…
Documents fulfilling this requirement have been published since 1992, in the form of statistical reports. This publication compiles statistics from data sources across the Criminal Justice System (CJS), to provide a combined perspective on the typical experiences of different ethnic groups, how outcomes vary between groups and how this has changed over time.
The areas of focus include: victimisation; police activity; defendants and court outcomes; offender management; offender characteristics; offence analysis; and practitioners.
The publication aims to help practitioners, policy makers, academics and members of the public understand outcomes and trends for different ethnic groups in the CJS in England and Wales. This is the latest biennial compendium of Statistics on Ethnicity (formerly Race) and the Criminal Justice System and follows on from its sister publication Statistics on Women and the Criminal Justice System published last year.
Limitations on conclusions
Although we explore differences between ethnic groups, it is important that inferences are not made about individuals from group-level data as we consider averaged outcomes that do not take into consideration the individual circumstances which differ in each case. Because of this, the statistics presented in this report cannot present the typical experience of a person of a particular ethnic group, but it can highlight areas where further investigation or research may be warranted when looking at differences between ethnic groups.
It is important to note that for the majority of the report, no controls have been applied for other characteristics of ethnic groups (such as average income, geography, offence mix or offender history), so it is not possible to determine what proportion of differences identified in this report are directly attributable to ethnicity. It is not possible to make any causal links between ethnicity and CJS outcomes. The identification of differences should not be taken as evidence of bias or as direct effects of ethnicity. However, for ECJS 2022, we have included a logistic regression in the Offence Analysis chapter to control for various offender and case characteristics to analyse the association between an offender’s ethnicity and receiving a custodial sentence for indictable offences (and specific focus on particular offence groups). This is not a permanent addition to the ECJS publication – if these statistics are beneficial to you, please get in touch to ensure they continue to be collected in future editions of the ECJS.
Ethnicity
Ethnicity is recorded by either self-reporting or as identified by a police officer[footnote 4]. When ethnicity is self-reported, it is based on five broad categories: Asian, black, mixed, white and other. When ethnicity is officer identified[footnote 5], it has four broad ethnicity categories: Asian, black, white and other[footnote 6]. Generally, we discuss the broad categories individually, to reflect their different experiences, but given the much greater numbers of white individuals in the population it is sometimes necessary or appropriate to consider the ethnic minorities (excluding white minorities) together. Whilst there is a need to focus on these aggregated ethnic groups to provide consistency and comparisons across the publication, this does not allow the disaggregation of more detailed ethnic groups across all data sources, restricting the ability to pinpoint disparity for ethnic groups within the 5+1 categories (e.g. White – Gypsy or Irish Traveller). We encourage users to refer to the Technical Guide to explore the source data at a more granular level (e.g. Criminal Justice Systems Statistics Annual pivot tools). The Offence Analysis chapter, using a regression analysis, has explored both 5+1 and 18+1 ethnicity classifications for the first time.
In acknowledgement of the subjective, multifaceted and changing nature of ethnic identification, we use self-identified ethnicity where this data is available[footnote 7]. The ethnicity classification used in each section is referenced throughout.
Individuals with an unknown or not stated ethnicity are not included in the analysis, because it is impossible to tell where they should be counted. High levels of missing ethnicity data would be of concern, both in terms of sample sizes and the risk of systematic bias. To allow users to assess the confidence they have in the data we are using, levels of missing or unreported ethnicity are reported throughout.
Labelling of the tables (impacting some graphs) are consistent with that of the source data, whilst references to ethnic groups within the text have been adjusted to be as consistent across sources as possible. For more information on ethnicity classifications and data sources, please see the technical guide.
In previous publications we have made comparisons to the population using Census data. In the 2021 Census, the proportion in each ethnic group was as follows: 9% Asian, 4% black, 2% mixed, 84% white and 2% other.
Data
Every effort is made to ensure that the figures presented are accurate and complete. However, these data have been extracted from large administrative data systems and surveys generated by the courts, police forces and other agencies, so some care should be taken, in particular when considering small differences and or sample sizes. Where possible, this report takes into consideration the recommendations of the Lammy Review (a 2017 independent review into the treatment of, and outcomes for black, Asian and Minority Ethnic individuals in the criminal justice system). This includes putting more information in the public domain with ethnicity breakdowns, the use of the Relative Rate Index[footnote 8] where appropriate and a focus on outcomes for children distinct form the adult population.
In most instances data are presented in terms of calendar years (up to 2022) and financial years (up to year ending March 2023), reflecting the reporting cycles and data collection of the agencies contributing information for this publication. Five-year time series have been presented wherever possible. Where changes to data systems or data quality issues do not allow for this, trends have been presented for the longest periods possible. The latest data available during the compilation of this report have been included.
Measures in this bulletin for 2020 and 2021 have been impacted by actions taken in response to the COVID-19 pandemic. For example, in April 2020, the Judiciary published guidance on the prioritisation of listings[footnote 9]. During the reporting period, all offences likely to result in custody were prioritised which impacted outcomes such as custody rate and average custodial sentences. This should be taken into consideration when interpreting trends that incorporate affected figures (e.g. prosecutions, convictions, sentencing, including average custodial sentence length [ACSL] and custody rates).
All results relate to England and Wales unless explicitly stated otherwise. Large figures are generally presented rounded to the nearest thousand, and percentages to the nearest percentage point in the text. Unrounded figures can be found in the accompanying spreadsheet tables and/or published source data.
The statistics reported in this bulletin are primarily accredited official statistics[footnote 10], as drawn from either other published accredited official statistics bulletins or the data underpinning them. However, as in previous reports, in order to present as full a picture as possible we have also included some statistics that do not have this badging where accredited official statistics are not held on important or new topics. These include the following data sources with corresponding locations within the report:
-
Victims chapter – Crime Survey England and Wales (official statistics)[footnote 11]
-
Police activity chapter – Police recorded crime (official statistics)[footnote 12]
-
Offender management chapter – Survey data from Her Majesty’s Inspectorate of Prisons Annual Report (official statistics)
-
Offender characteristics chapter – Understanding Educational background of young people who had been cautioned or sentenced for an offence MoJ/ DfE data share (official statistics)
-
Offence analysis chapter – regression analysis (official statistics)
Where a source is not accredited official statistics, users should consider this when making judgements about the weight that can be put on related findings.
Information provided
-
Supplementary spreadsheet tables accompany the chapters, providing additional data where the figures have not previously been published (or not published in that form). Where figures have already been published, links are provided as part of the text and tables.
-
A technical guide titled ‘A Technical Guide to Statistics on Ethnicity and the Criminal Justice System’ is available alongside this report, which provides users with information on the concepts and terminology used within the report, as well as information about data sources, data quality and references.
-
A user guide titled ‘A User Guide to Statistics on Ethnicity and the Criminal Justice System’.
-
An infographic is published alongside this report to provide visualisations of key messages.
-
A dashboard (PowerBi) to allow users to have more interactivity with visualising trends, with additional breakdowns where possible.
-
This report is also accompanied by an infographic summarising key findings.
The dashboard is not a permanent addition to the report and therefore we ask you to get in touch if you find it beneficial and wish for its production to be continued. The production team is looking to focus more on the dashboard and reduce commentary within the ECJS bulletin in the future in order to maximise the experience of our users and flexibility of analysis. Feedback on this proposal is welcomed. Please complete the survey here to contact the team.
The data share between Ministry of Justice and Department for Education in the Offence Characteristics Chapter and the regression analysis in the Offence Analysis chapter are not permanent editions to the ECJS publication. If these statistics are beneficial to you, please get in touch to ensure they continue to be collected in future editions of the ECJS.
The Ministry of Justice would welcome any feedback on the content, presentation, or on any other aspect of this bulletin – we can be contacted through:
Email: CJS_Statistics@justice.gov.uk
3. Victims
Since 2018/19, levels of personal crime, excluding fraud and computer misuse, have decreased significantly from 4.1% to 2.5%.
There were statistically significant decreases in the prevalence of personal crimes since 2018/19 in the black (from 6.0 to 1.8%) and white (from 4.2 to 2.6%) ethnic groups.
Between 2019/20 and 2021/22, a third of black homicide victims were aged 20 or younger.
This compares to 13% of white victims and 25% of victims from the other ethnic group.
This chapter explores the nature, extent and risk of victimisation, in relation to ethnicity, from Crime Survey for England and Wales (CSEW): year ending March 2023 and Homicide in England and Wales: year ending March 2022[footnote 13].
3.1 Crime Survey
The CSEW is a large nationally representative survey that asks people about their experience as a victim of a crime in the previous 12 months. It offers insights into the experience of victims which other sources of data, such as police records, may not capture[footnote 14]. In this section, where there are statistically significant differences between groups at the 95% level, this will be stated. Where differences are not referred to as being statistically significant these are either not significantly different, or differences have not been tested.
Due to the coronavirus pandemic the CSEW was moved to a telephone format referred to as the Telephone-operated Crime Survey for England and Wales (TCSEW). Data collected from the TCSEW in 2020/21 and 2021/22 are not presented as they are not directly comparable with CSEW data.
Personal crime [footnote 15] against adults (excluding fraud and computer misuse)[footnote 16]
In 2022/23, the CSEW estimated that 2.5% of adults were a victim of a personal crime on one or more occasions. The Asian ethnic group (1.8%) were significantly less likely than the white ethnic group (2.6%) to be victims of a personal crime[footnote 17].
Since 2018/19, the percentage of adults who were victims of a personal crime once or more, decreased significantly (from 4.1% to 2.5%). This decrease was driven by statistically significant decreases in the black (from 6.0 to 1.8%) and white (from 4.2 to 2.6%) ethnic groups.
Figure 3.01: Percentage of adults who reported being victims of a CSEW personal crime by ethnic group, England and Wales 2018/19 and 2022/23[footnote 18]
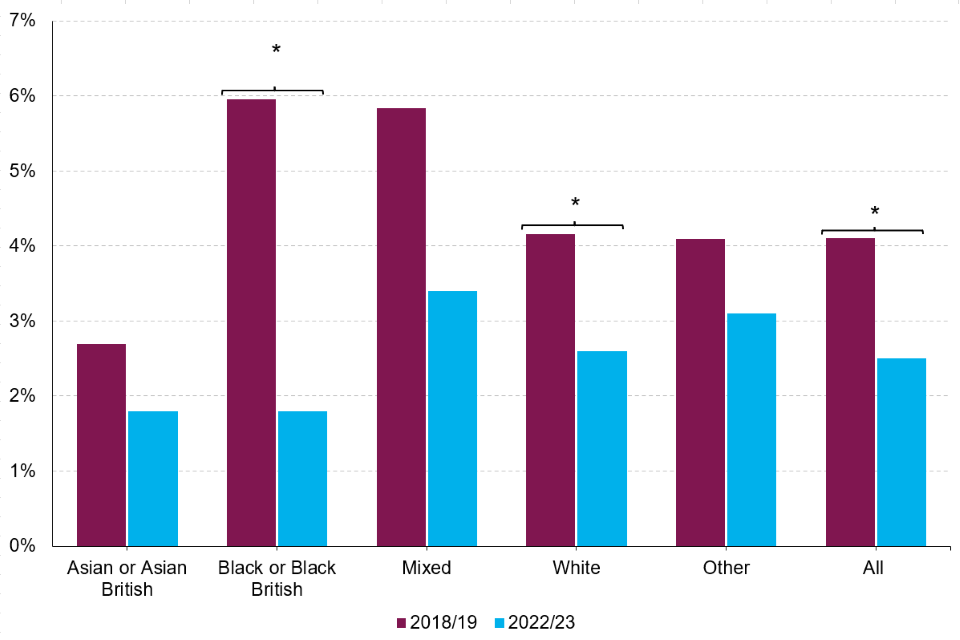
(Source: Ministry of Justice – Ethnicity and the Criminal Justice System: Chapter 3: Victims - Table 3_01a [derived from ONS – CSEW])
Personal crime against children[footnote 19]
In 2022/23, an estimated 9.4% of children were a victim of a personal crime once or more, based on findings from the CSEW. Children from the Asian ethnic group presented the lowest proportion (at 8.4%) whilst those from the mixed ethnic group presented the highest (12.6%). An estimated 9.6% of both black and white children reported being a victim of personal crime in 2022/23.
The percentage of children who reported victimisation in 2022/23 aligns with that of 2018/19, after a considerable decrease across all ethnic groups in 2019/20. Compared to 2018/19, slight increases were seen in 2022/23 for children from the Asian (6.9 to 8.4%) and black (8.3 to 9.6%) ethnic groups, whilst children from the white group remained constant at 9.6%.
Racially motivated incidents
A non-significant decrease of 32% was seen in the number of racially motivated incidents reported in 2022/23 compared to 2018/19. Personal crime that was racially motivated decreased 38% over this period, whilst household crime that was racially motivated decreased 17% [footnote 20].
Confidence of the effectiveness of the CJS
Overall percentage of adults who are confident that the CJS is effective in 2022/23 was 52%, consistent with that of 2019/20. This trend was seen across all ethnic groups apart from the black group, where the percentage increased significantly from 55% in 2019/20 to 65% in 2022/23.
In 2022/23, a significantly higher percentage of Asian (69%), black (65%) and those in the other ethnic group (73%) adults were confident that the CJS was effective, compared to white adults (50%).
3.2 Homicide
As homicide is a relatively low-volume offence, there will be fluctuations in numbers from year to year. This is especially true where data have been broken down further for analysis. Therefore, figures have been collated over a three-year period in order to accurately represent trends over time.
In the year ending March 2022, there were 671 homicides in the Home Office Homicide Index[footnote 21], where the ethnicity of the victim was recorded[footnote 22]. Almost three quarters (74%) of these victims were from the white ethnic group, with 14% involving black victims and 13% from the other ethnic group[footnote 23]. The long-term trend has shown a decrease in the percentage of white victims (from 82% in 2012/13), although this has fluctuated over the last 10 years, with corresponding increases in proportions of black (from 10%) and other ethnic group (from 8%) victims. Since 2012/13, currently recorded homicides have increased by over a quarter (26% where ethnicity known, 28% overall).
Although the majority of homicide victims were white, accounting for different population sizes shows that black people had higher rates of victimisation. In the three years to year ending March 2022[footnote 24], average rates per million population were around four times higher for black victims than white victims or victims of other ethnicities. Homicide rates across all ethnic groups over the last three years increased compared with the three-year period to year ending March 2016. The homicide rate for black victims has shown the biggest increase, from 24.5 to 39.7 per million population. This compares with the rate for white victims, which increased from 8.0 to 8.9 per million population. For further information on disparity rates, please visit Homicide in England and Wales: year ending March 2022 (See Appendix table 7).
Sex and age
Over the three-year period between 2019/20 and 2021/22, there were a greater number of male than female homicide victims across all ethnic groups. The proportion of victims who were male was highest in the black ethnic group (87%), followed by the other ethnic group (73%), with white victims presenting the lowest proportion that were male (69%).
Over the same period, where ethnicity was known, 82% of all homicide victims were over 21 years old, with 7% between 18 and 20 and 11% under 18. This trend varies across intersections between ethnicity, sex, and age. Female victims were aged over 21 in 87% of homicides, rising to 89% where victims were white and falling to 83% and 81% when victims were from the black and other ethnic groups, respectively.
Male victims were aged over 21 in 80% of homicides, rising to 86% where victims were white and falling to 73% and 64% when victims were from the other and black ethnic groups, respectively. Whilst male victims from the white group were aged 18-20 in only 5% of cases, this accounted for 18% of victims from the black ethnic group and 14% from the other ethnic group. A similar trend was seen where male victims were 15-17, accounting for 3% of white, 12% of black and 8% of other ethnic group victims. This compares to 0-2% of female victims aged 15-17 across all ethnic groups.
These differences will partly reflect the different age distributions of ethnic groups in the population, for further information see Ethnic group by age and sex, England and Wales: Census 2021.
Geography
London showed a markedly different pattern than the rest of England and Wales. There was a total of 390 homicides in London[footnote 25] between 2019/20 and 2021/22, where ethnicity of the victim was recorded, accounting for 21% of all homicides currently recorded. This was the only region in which homicide victims were more likely to be from the black ethnic group (42%), followed by white ethnic group (37%), with only 8% of homicides involving black victims throughout the rest of England and Wales[footnote 26]. This may partly reflect the different distributions of ethnic groups in the population in different locations, as London is more ethnically diverse than England and Wales as a whole.
Method of killing
A sharp instrument was the most frequent apparent method of killing across most ethnic groups, accounting for 41% of all homicides[footnote 27] in the period between 2019/20 and 2021/22. This method accounted for 66% of homicides involving black victims, but only 35% of those involving white victims. A higher proportion of homicides involving white victims had hitting (kicking, etc.) as the apparent method of killing at 21% (7-8% for other groups), whilst those involving victims from the other ethnic group had a higher proportion as strangulation than other ethnic groups at 20% (1-7% for other groups). A higher proportion of homicides involving black victims had shooting as the apparent method of killing at 14% (3-6% for other groups).
Figure 3.02: Proportion of homicides currently recorded by location of homicide and ethnic appearance of victim, England and Wales, combined data for 2019/20 to 2021/22
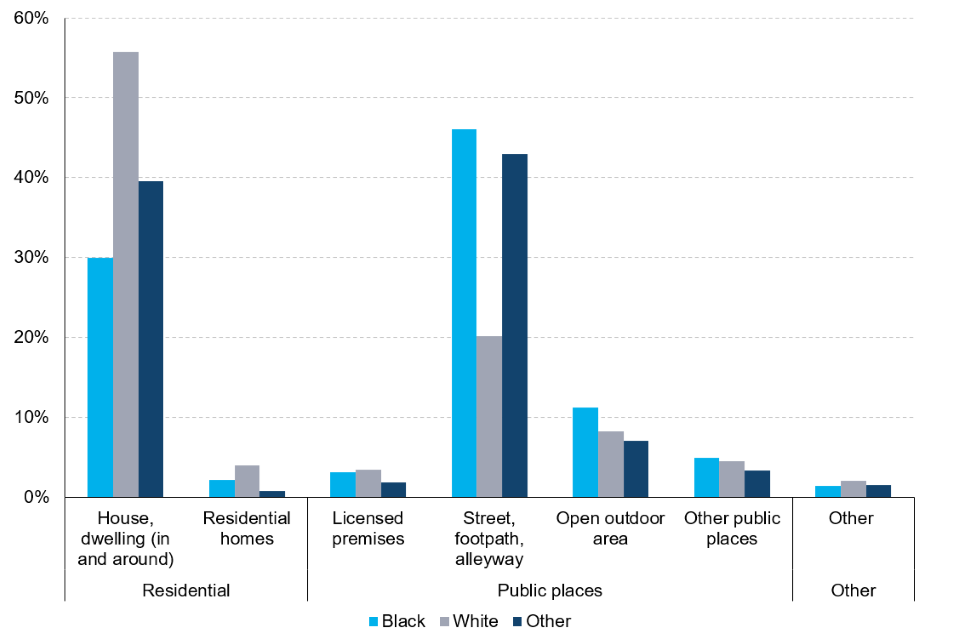
(Source: Ministry of Justice – Ethnicity and the Criminal Justice System: Chapter 3: Victims - Table 3_09 [derived from Home Office Homicide Index])
Location
The location in which a homicide was committed showed distinct differences between ethnic groups. Between 2019/20 and 2021/22, homicides involving victims from the black and other ethnic group were most often located in public places (65% and 55%, respectively), whilst those involving white victims took place most often in residential locations (60%). The most frequent location for homicides involving white victims was in and around the house (or dwelling) at 56%, whereas those involving victims from the black and other ethnic groups more often took place on the street (including footpaths and alleyways), at 46% and 43%, respectively.
Principal suspects and circumstances[footnote 28]
Between 2019/20 and 2021/22, 68% of principal suspects convicted of homicide were from the white ethnic group, followed by 14% from the black ethnic group and 15% from the other ethnic group. For each ethnic group, victims were most often associated with a principal suspect of the same ethnic group (white: 83%, black: 58%, other: 52%).
The relationship between white homicide victims and associated principal suspect[footnote 29] was most often a friend or acquaintance (20%), whilst those involving black or other ethnic group victims was more often a stranger (22% and 27%, respectively)[footnote 30]. Where homicide victims were under 16, the most frequent relationship of victim to principal suspect was family (black: 19%, white: 44%, other: 67%), although volumes are very low across non-white ethnic groups in this cohort.
In cases where the victim was acquainted with the principal suspect, the apparent circumstances were most often quarrel, revenge or loss of temper (64%); this was consistent across all ethnic groups. This was also the case where the victim was not known to be acquainted with the principal suspect for homicides involving white (44%) and black (63%) victims, whilst the circumstances for those involving victims from the other ethnic group were more often ‘other circumstances’[footnote 31][footnote 32].
4. Police Activity
Between 2019/20 and 2022/23, the proportion of stop and searches for people from the white ethnic group increased from 60% to 69%.
Over this period, there were corresponding decreases in proportions accounted for by black individuals (21% to 14%) and Asian individuals (13% to 11%).
In 2022/23, white individuals accounted for 78% of arrests, 8% were of black individuals, 8% were of Asian individuals, 4% were of mixed ethnicity individuals and 2% were of other ethnicity individuals.
Relative proportions of arrests across ethnic groups remained relatively stable between 2019/20 and 2022/23, with a slight increase in the proportion of individuals from the white group and corresponding decrease in those from the black ethnic group.
In 2022/23, 69% of children arrested in London were from ethnic minorities (excluding white minorities).
A larger proportion of arrests in London were for individuals from ethnic minorities (excluding white minorities), at 56%, compared to 17% across the rest of England and Wales.
This chapter explores police activity by ethnicity of persons stopped and searched and/or arrested. It covers statistics on stop and searches and arrests, which are published by the Home Office in the Police powers and procedures: Stop and search and arrests, England and Wales, year ending 31 March 2023[footnote 33]. It also covers trends in Penalty Notices for Disorder and cautions issued, published in Criminal Justice Statistics Quarterly: December 2022.
4.1 Stop and searches[footnote 34]
Police officers have the power to stop and search individuals under different pieces of legislation. In this chapter, those conducted under section 1 of the Police and Criminal Evidence Act 1984 (PACE) and section 60 of the Criminal Justice and Public Order Act 1994 have been combined[footnote 35].
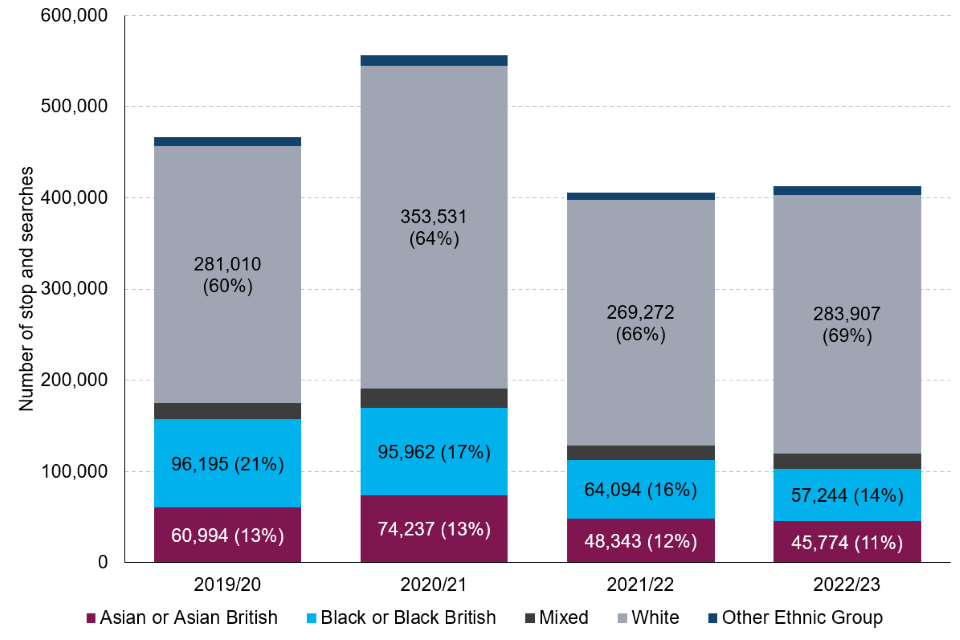
Where ethnicity is known[footnote 36], the total number of stop and searches fluctuated between 2019/20 (466,000) and 2022/23 (413,000), with a peak in 2020/21 (556,000). The increased level of stop and search in the year ending March 2021 was partly due to proactive policing during COVID-19 lockdowns. Throughout this period, the proportion of stop and searches for those from the white ethnic group increased from 60% to 69%, with associated decreases in proportions accounted for by black individuals (21% to 14%) and Asian individuals (13% to 11%).
Figure 4.01: Numbers and proportions of stop and searches by ethnicity, England and Wales, 2019/20 to 2022/23
(Source: Home Office – Police Powers and Procedures: Stop and search and arrests – Stop and search open data tables)
Reasons for Stop and Search
When conducting a stop and search, police record the reason for the stop and search as well as the ethnicity of the person searched[footnote 37]. There are various reasons why the police may carry out a stop and search, for example they may suspect an individual is carrying drugs or a weapon.
In the latest year, suspicion of drugs was the most common reason for stops across all ethnic groups. In 2022/23, 70% of stop and searches conducted on individuals from the Asian ethnic group were for drugs, compared to 58 to 61% of all other ethnic groups. Black individuals had the highest proportion of stop and searches for offensive weapons (including firearms) at 24%, compared to 15 to 21% for all other ethnic groups[footnote 38]. Since 2019/20, the proportion of reasons for stop and search accounted for by drugs has remained constant, at 62% The peak in the year ending March 2021 may have been affected by proactive searches for drugs during national lockdowns throughout the COVID-19 pandemic.
Comparisons between London [footnote 39] and the rest of England and Wales
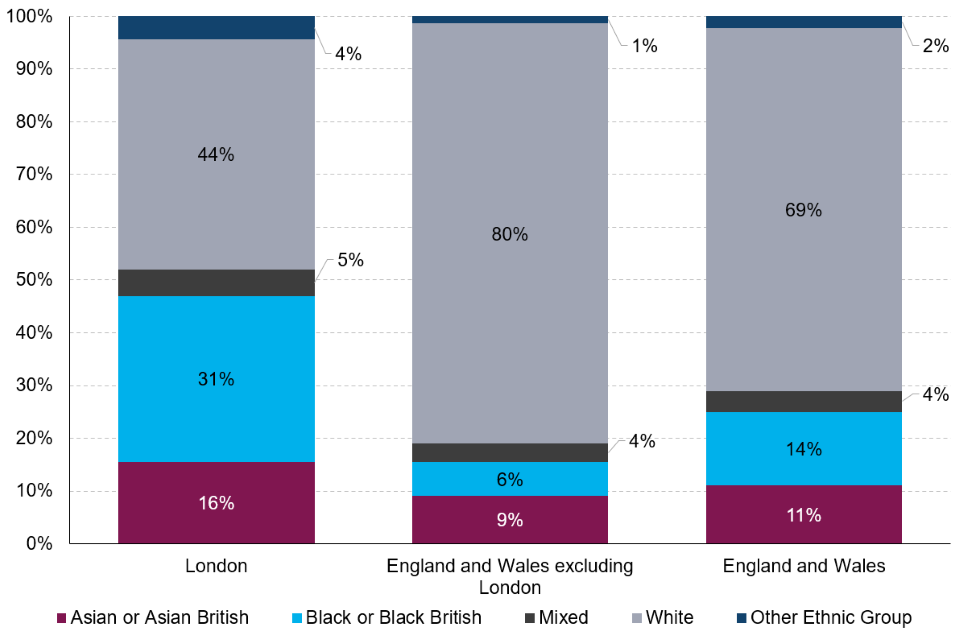
The overall ethnicity trends for stop and searches tend to be influenced by stop and searches conducted in London, due to London’s ethnic composition compared with the rest of England and Wales. In 2022/23, 30% of all stop and searches (where ethnicity is known) were conducted in London; this proportion has decreased from 48% in 2019/20. Of those conducted in London, 56% involved individuals from ethnic minorities (excluding white minorities; 31% black, 16% Asian, 5% mixed and 4% other), which decreased from 61% (35% black, 18% Asian, 4% mixed and 3% other)[footnote 40] over the last 4 years. This still remains markedly higher than the rest of England and Wales, at 20% in 2022/23 (6% black, 9% Asian, 4% mixed and 1% other).
Figure 4.02: Proportions of stop and searches in London and England and Wales, by ethnicity, 2022/23
(Source: Home Office – Police Powers and Procedures: Stop and search and arrests – Stop and search open data tables)
Stop and Search outcomes
This section focusses on disaggregating the outcomes that are a result of a professional judgement (i.e., the officer found what they were searching for), and those where the item found was not what the officer was searching for, or where nothing was found.
In 2022/23, 22% of all stop and searches (where ethnicity is known) resulted in an outcome that was linked to the reason for the search, i.e., the officer found what they were searching for[footnote 41]. Mixed ethnicity individuals had the highest proportion of stop and searches in which the outcome was linked (26%) compared to all other ethnic groups, these ranged from 21% to 23%. Individuals from the other ethnic group had the highest proportion of stop and searches where nothing was found (74%), followed by white individuals (73%).
In 2022/23, 69% of stop and searches resulted in the principal outcome ‘no further action’[footnote 42]. Arrests were the principal outcome in 14% of stop and searches, community resolutions in 9% and other outcomes in 8%[footnote 43]. A higher proportion of black individuals received the principal outcome of arrest at 17%, followed by 16% of mixed ethnicity individuals, 15% of individuals from the other ethnic group, 14% of white individuals and 13% of Asian individuals. Since 2019/20, the proportion of stop and searches that resulted in no further action has decreased across all ethnic groups, with corresponding increases across other outcomes as a whole.
Arrests resulting from Stop and Search
Stop and search is an important detection tool for the police – it allows officers to search individuals without an arrest taking place[footnote 44]. Since 2019/20, individuals from black and mixed ethnic groups have had among the highest arrest rate each year, at 17% and 16% in 2022/23, respectively. Asian individuals have consistently presented the lowest arrest rate each year, at 13% in 2022/23.
Reasons for searches that resulted in arrest[footnote 45]
Across all ethnic groups, drugs were the most common reason for searches that resulted in an arrest after a stop and search, accounting for 62% of resultant arrests for Asian individuals, 51% for white individuals, 50% for black individuals, 49% for mixed ethnicity individuals and 48% for those from the other ethnic group. This proportion has decreased for all ethnic groups since 2020/21.
Stop and Search arrests
In 2022/23, stop and searches which resulted in arrests accounted for 10% of total arrests made in England and Wales (where ethnicity is known). Black individuals had the highest proportion of arrests that resulted from stop and search, accounting for 20% of total arrests, which decreased from 24% in 2019/20. This proportion varied between 8% and 13% for all other ethnic groups in 2022/23. This overall trend is influenced by the higher number of stop and searches carried out in London, where stop and search arrests accounted for 25% of total arrests, which decreased from 26% in 2019/20. In the rest of England and Wales, stop and search arrests accounted for just 8% in 2022/23.
4.2 Arrests[footnote 46]
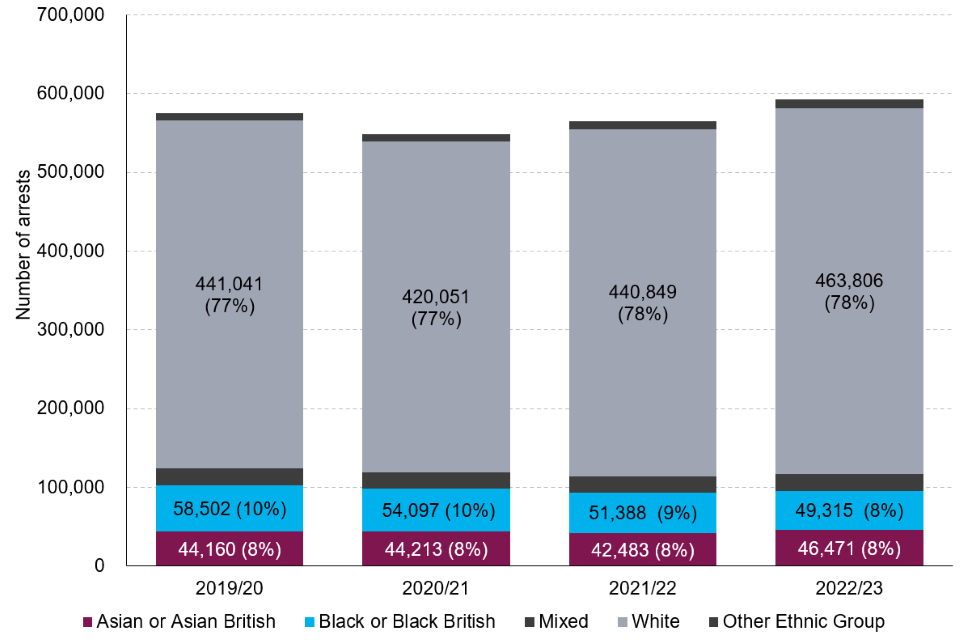
Figure 4.03: Number and proportions of arrests in England and Wales by ethnicity, 2019/20 to 2022/23[footnote 47]
(Source: Home Office – Police Powers and Procedures: Stop and search and arrests – Arrests open data tables)
The total number of all arrests (where ethnicity is known) increased by 3% between 2019/20 and 2022/23[footnote 48]. Whilst arrests of individuals within the Asian, white, and other ethnic groups increased over this period (5%, 5% and 9%, respectively), arrests of those from the mixed and black ethnic groups decreased (1% and 16%, respectively).
In 2022/23, white individuals accounted for 78% of arrests, 8% were of black individuals, 8% were of Asian individuals, 4% were of mixed ethnicity individuals and 2% were of other ethnicity individuals. Relative proportions of arrests across ethnic groups remained relatively stable between 2019/20 and 2022/23, with a slight increase in the proportion of individuals from the white group and corresponding decrease in those from the black ethnic group.
Offence groups[footnote 49]
Violence against the person offences have accounted for the largest proportion of total arrests (where ethnicity is known) since 2019/20, at 46% in 2022/23. The proportion of total arrests for which theft offences account decreased over this period (17 to 13%), as well as drug offences (11% to 9%), with a corresponding increase in the proportion accounted for by violence against the person offences (40 to 46%). This trend was broadly consistent across ethnic groups.
In 2022/23, arrests for drugs offences accounted for 16% of all black people arrested, this compares to 7-13% for all other ethnic groups. Whilst drug offences accounted for the second most frequent reason for arrest for ethnic minorities (excluding white minorities), white individuals were more often arrested for theft (14%).
Age groups[footnote 50]
Between 2019/20 and 2022/23, arrests decreased 5% for children, while increasing 4% for adults. This decrease in arrests for children was consistent across ethnic minorities (excluding white minorities), each declining by between 16% and 28%, with arrests of white children increasing 2% over this period. Adult arrests increased across all ethnic groups (1-12%) except for black individuals, who presented a 13% decrease.
Arrests by Police Force Area: London
In 2022/23, 13% of all arrests (where ethnicity is known) were made in London[footnote 51]. A larger proportion of arrests in London were for individuals from ethnic minorities (excluding white minorities), at 56%, compared to 17% across the rest of England and Wales. This is expected given the more diverse population of London. since 2019/20, the proportion of arrests in London and across England and Wales have remained relatively stable by ethnic group.
Children from ethnic minorities (excluding white minorities) accounted for 69% of arrests of children made in London in 2022/23. Over the last 5 years, the proportion of children arrested in London from white ethnic groups has decreased from 33% to 31%, with a corresponding increase in arrests of children from the mixed ethnic group.
4.3 Out of Court Disposals[footnote 52]
Penalty Notices for Disorder (PNDs)[footnote 53] issued
The number of PNDs issued has continued to decline over the last 5 years, falling by 64% from 18,900 in 2018 to 6,900 in 2022[footnote 54].
Penalty Notices for Disorder - Offences
Possession of cannabis accounted for the highest proportion of PNDs issued to defendants from the Asian (65%), black (67%) and mixed (59%) ethnic groups. Drunk and disorderly accounted for the highest proportion of those issued to defendants from the white ethnic group (55%), as well as the other (34%) ethnic group, which was closely followed by possession of cannabis (31%).
Penalty Notices for Disorder - Payment
In 2022, 51% of PNDs were paid in full, whilst 37% resulted in a fine for late payment. In each of the last 5 years, defendants from the Asian ethnic group had the highest proportion of PNDs paid in full (at 57% in 2022) and those from the black ethnic group had the lowest (at 35% in 2022). Asian defendants were among those with the lowest proportion of fines for late payment each year, at 34% in 2022, whilst black defendants consistently had the highest, at 54%.
Cautions issued[footnote 55][footnote 56]
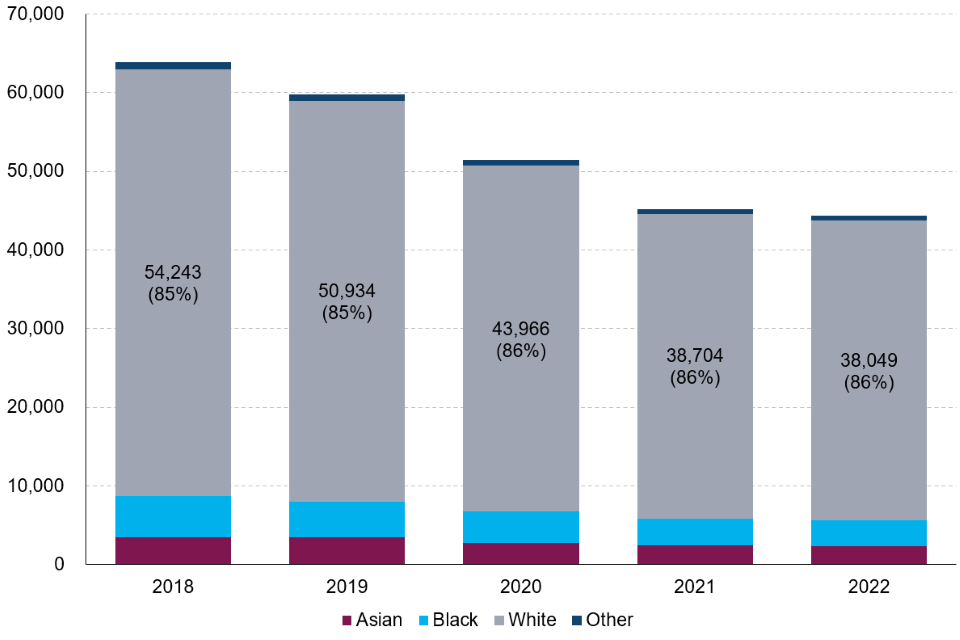
The volume of cautions issued has continued to decline over the last 5 years, falling 30% to 44,400 in 2022. Of these, 5% were issued to Asian defendants, 7% to black defendants, 2% to defendants from the other ethnic group and 86% were issued to white defendants.
Cautions - Offences[footnote 57]
In 2022, 53% of all cautions were issued for indictable offences; this is similar to that of 5 years ago, after the peak of 57% seen in 2020. White defendants had a consistently lower proportion of cautions issued accounted for by indictable offences (52% in 2022) than those from all other ethnic groups combined (55-59% in 2022), across each of the last 5 years.
Drug offences accounted for the highest proportion of indictable offences leading to a caution being issued, across all ethnic groups. The highest proportion was for black and Asian (43%), followed by white (37%) and other (36%) ethnic groups. Violence against the person offences accounted for the second largest proportion of indictable offences resulting in a caution, for each ethnic group, with the highest presented by white defendants (25%) followed by Asian and black defendants (20%), and defendants from the other ethnic group (18%).
Figure 4.04: Number and proportions of cautions issued, by ethnicity, England and Wales, 2018 to 2022
(Source: Ministry of Justice - Criminal Justice Statistics Quarterly: year ending December 2022 - Out of Court Disposals tool)
Cautions types[footnote 58]
Around half (49%) of all cautions issued in 2022 were Adult Simple cautions, with the remainder accounting for Adult Conditional cautions (41%) and Youth Simple (5%) and Conditional (5%) cautions. A higher proportion of black defendants received either a simple or conditional youth caution (15%) when compared to other ethnic groups (5-9%). Of all adult cautions issued, defendants from the Asian (57%), black (62%), and other (71%) ethnic groups received a higher proportion of conditional cautions (rather than simple) compared to white (54%) ethnic group.
5. Defendants
Convictions for drug offences accounts for the largest proportion of convictions for all other ethnic groups combined.
In 2022, the largest proportion of convictions for all other ethnic groups combined was for drug offences (28% to 36%), while the largest proportion of convictions for white defendants was for violence against person offences (25%).
Since 2018, white defendants have had a consistently lower average custodial sentence length (ASCL) than all other ethnic groups combined for indictable offences.
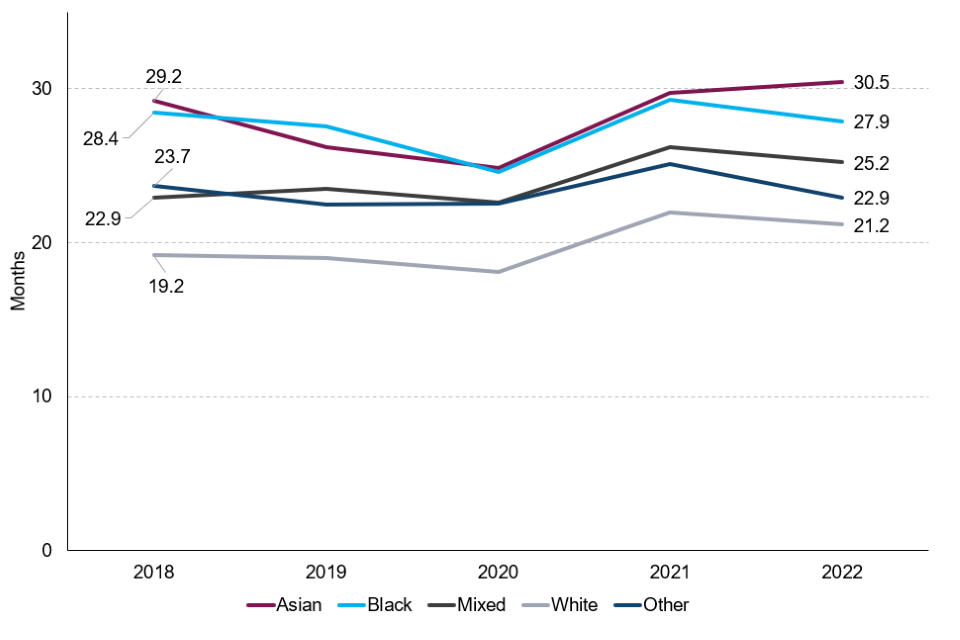
In 2022, white offenders had an ACSL of 21.2 months in comparison to 30.5 months for Asian offenders, 27.9 months for black offenders, 25.2 months for mixed offenders and 22.9 months for the other ethnic group.
Black defendants were more likely to elect themselves to be heard at Crown Court.
In 2022, the black ethnic group had the highest proportion of defendants electing themselves to be heard at a Crown Court, at 26%. This was followed by defendants from the mixed ethnic group (19%), Asian and other defendants (17%), and white defendants (15%).
This chapter explores outcomes for defendants[footnote 59] in the Criminal Justice System (CJS) predominantly drawing on indictable offence[footnote 60] data from the Criminal Justice Statistics quarterly: December 2022 publication. Other sources in this chapter include Criminal Courts Statistics, Legal Aid Statistics and Offender Management Statistics Quarterly. When a suspect is formally charged, they are brought before a magistrates’ court (as a defendant) as soon as possible. Following prosecution (which can include being sent to Crown Court), defendants found guilty are subsequently convicted and sentenced. The defendant can be directed to appear in court or remanded on bail or in custody. When comparing the most recent figures to figures from 2020 and 2021, consideration must be taken regarding the impacts of COVID-19 pandemic on criminal courts proceedings.
This chapter also uses Relative Rate Index (RRI) to compare the difference in rates between two fixed populations and was recommended for use in the Lammy Review, 2017. Please see technical guide for more details. Based on user feedback, we have implemented new charts to display the RRI figures and welcome feedback for future publications.
5.1 Prosecutions and Convictions[footnote 61]
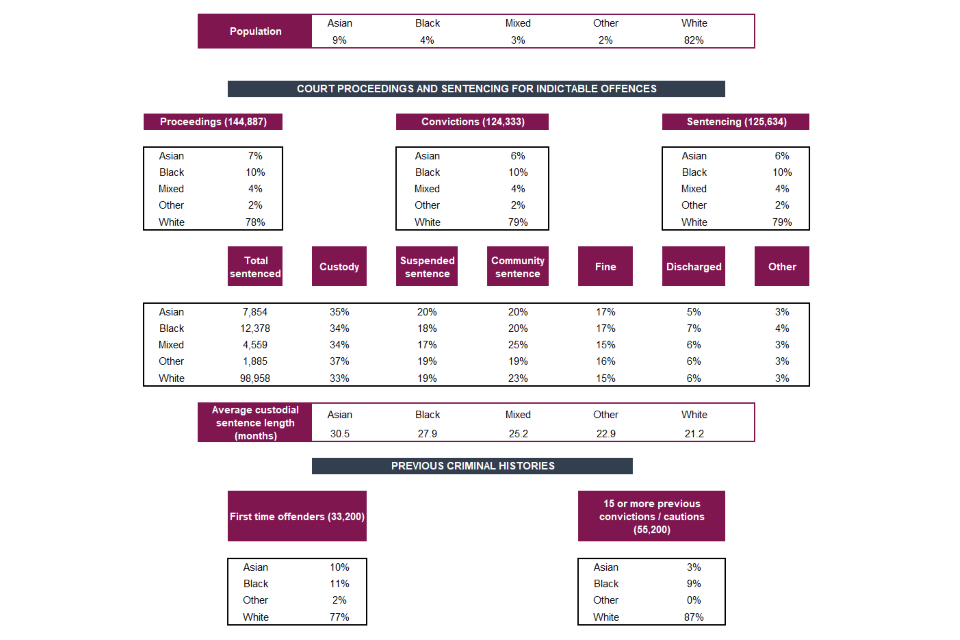
In 2022, of the defendants prosecuted for indictable offences, 78% were white, 10% were black, 7% were Asian, 4% were of mixed ethnicity and 2% were of the other ethnic group. Over the past 5 years, prosecutions and convictions have decreased overall, with the exception of a slight increase in 2021 and 2022 compared to 2020[footnote 62]. Nevertheless, proportions across ethnic groups have remained relatively stable. The largest proportionate change was seen in prosecutions of White defendants, decreasing from 79% in 2018 to 78% in 2022, with proportionate increase across all other ethnic groups combined.
Figure 5.01: Proportions of ethnic groups throughout the Criminal Justice System, 2022[footnote 63][footnote 64][footnote 65]
(Source: See sources via relevant chapters throughout the report)
5.2 Offence groups[footnote 66]
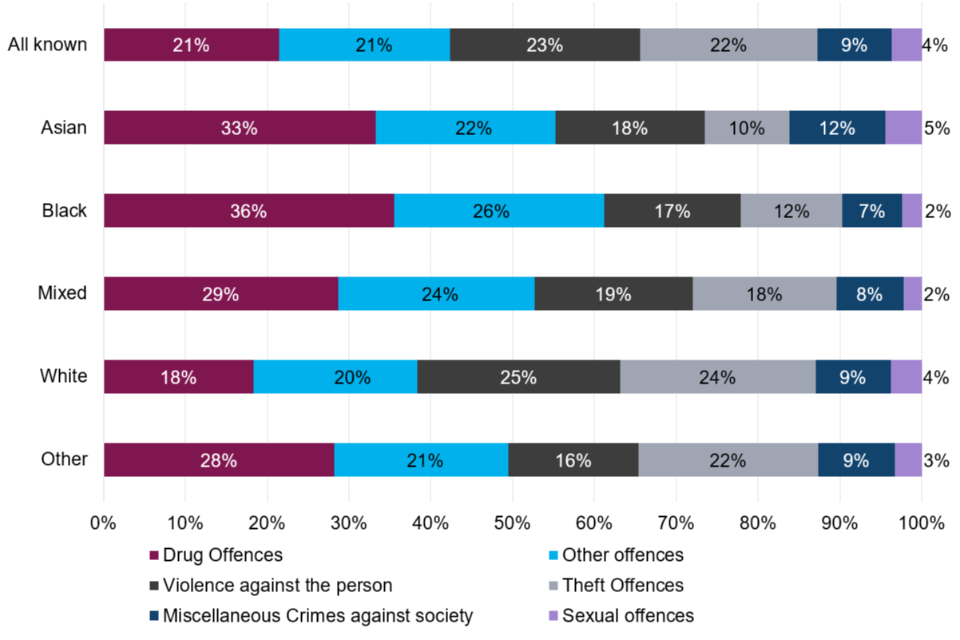
Convictions across indictable offence groups varied between ethnic groups in 2022, with drug offences accounting for the highest proportion of offenders within each ethnic group except for white offenders, where the highest proportion of convictions was for violence against the person (25%). Drug offences accounted for 36% of convictions for black offenders, 33% for Asian offenders, 29% for mixed ethnicity offenders, 28% for the other ethnic group offenders, and 18% for white offenders. Throughout the past 5 years, drug offences convictions accounted for the highest proportion of offenders for Asian, black, and mixed ethnic groups, and for the last 4 years for offenders from the other ethnic group, while the highest proportion of White offenders were convicted for theft offences up until 2020, and violence against person in 2021 and 2022.
Convictions by offence group may be influenced by factors other than ethnicity. For example, in 2022, 23% of all convictions of black individuals were for drug offences dealt with in London[footnote 67], where greater levels of stop and search activity likely lead to increased arrests and subsequent charges for drug possession. See police activity chapter for more information on stop and searches.
Figure 5.02: Proportions of indictable offences convictions for all ethnicities, by offence groups, 2022, England and Wales
(Source: Ministry of Justice - Criminal Justice Statistics Quarterly: year ending December 2022 - Outcomes by Offence data tool)
5.3 Remands
Magistrates’ courts[footnote 68]
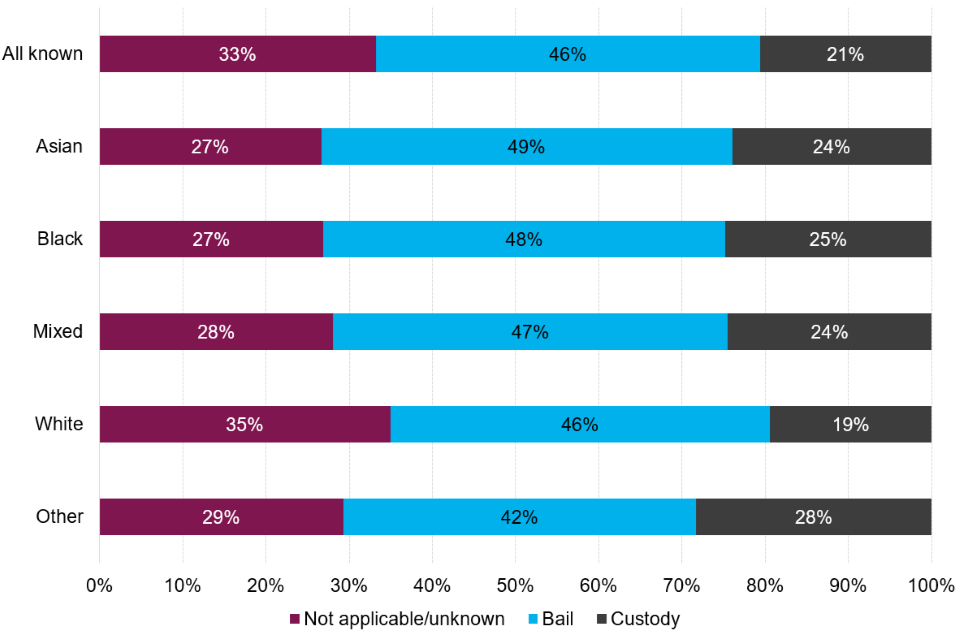
As shown in figure 5.03a, the proportion of defendants remanded in custody for indictable offences at magistrates’ courts was lowest for the white ethnic group, at 19%. The highest proportion of custodial remand was for the other ethnic group at 28%, followed by the black ethnic group (25%), mixed ethnic group (24%) and the Asian ethnic group (24%).
Figure 5.03a: Proportions of remand status by ethnic groups at magistrates’ courts, for indictable offences, 2022, England and Wales
(Source: Ministry of Justice - Criminal Justice Statistics Quarterly: year ending December 2022 - Remands data tool)
Crown Court[footnote 69]
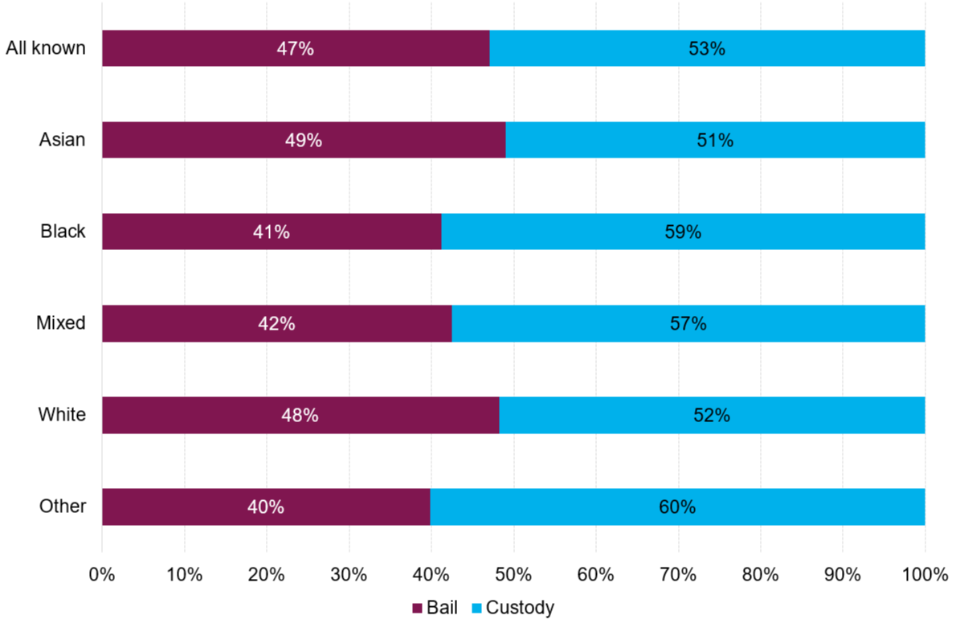
Figure 5.03b: Proportions of remand status by ethnic groups at the Crown Court, for indictable offences, 2022, England and Wales
(Source: Ministry of Justice - Criminal Justice Statistics Quarterly: year ending December 2022 - Remands data tool)
Remand status at Crown Court is shown in Figure 5.03b. In 2022, all ethnic groups were more likely to be remanded in custody for indictable offences, with the other ethnic group having the highest proportion of defendants being remanded in custody at 60%, followed by black ethnic group at 59%. In 2021, white and Asian defendants were more likely to be remanded on bail, at 52% and 53% respectively, while the other ethnic group were more likely to be remanded in custody. Overall, larger proportions of defendants are remanded in custody at Crown Court, compared to magistrates’ courts, which may be expected due to only the most serious cases being dealt with by the Crown Court.
In 2022, of all defendants remanded in custody for indictable offences at Crown Court, 73% were sentenced to immediate custody, a decrease from 76% in 2021. Similar proportions were seen across ethnic groups, ranging from 69% for black defendants to 74% for white defendants. Larger proportions of defendants from black, Asian, mixed and the other ethnic group who were remanded in custody were acquitted or not tried (ranging from 12% to 18%) compared to white defendants at 10%.
Relative Rate Index
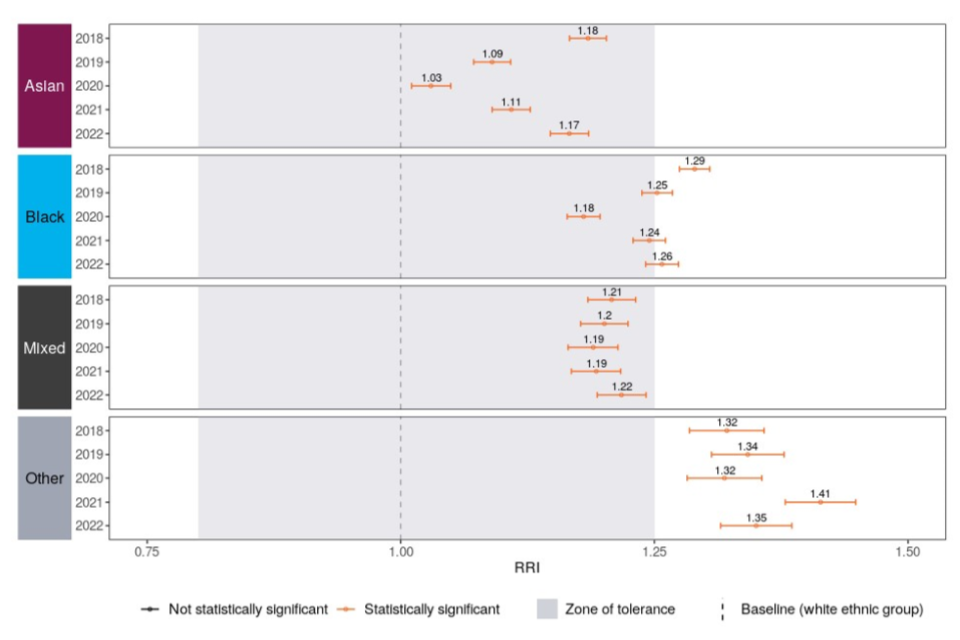
Figure 5.03c: RRI of defendants remanded in custody per all remand decisions at all courts[footnote 70], for indictable offences, 2018 - 2022, England and Wales
(Source: Ministry of Justice – Ethnicity and the Criminal Justice System: Chapter 5: Defendants – Table 5_17 [derived from MoJ, CJSQ])
Relative Rate Index (RRI) analysis for individuals dealt with at all courts in 2022 showed that defendants of the other ethnic group were 35% more likely, black defendants 26% more likely, defendants of mixed ethnicities 22% more likely and Asian defendants 17% more likely to be remanded in custody than white defendants (see Chapter 5: Defendants tables – Table 5.17a).
5.4 Pre-sentence Reports[footnote 71][footnote 72]
This section looks at the pre-sentence reports (PSRs) received and the agreement (concordance) between recommendations made in PSRs and sentences issued at court, and whether they differ between ethnic groups. In 2022, 81% of the total 62,104 PSRs prepared were for white defendants (excluding ‘Missing/Not stated’) which has remained consistent in the last four years (81% to 83%). Overall, there has been a 28% decrease in the total number of PSRs issued since 2018.
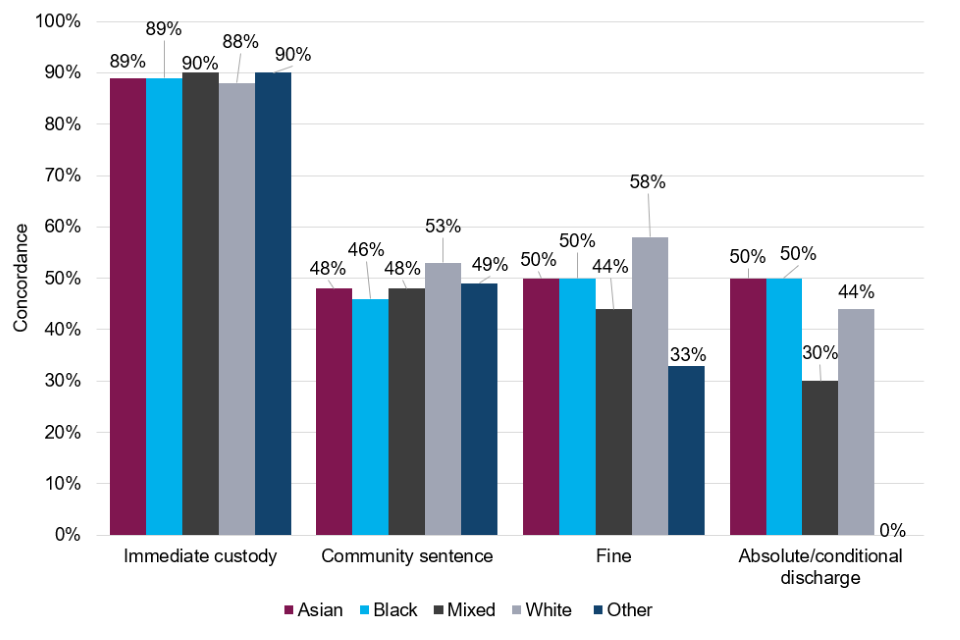
Figure 5.04: The level of concordance between sentences proposed and outcomes for ethnic groups, by sentence type, 2022, England and Wales
(Source: Ministry of Justice – Ethnicity and the Criminal Justice System: Chapter 5: Defendants – Table 5.16b [derived from MOJ, OMSQ])
In 2022, concordance rates[footnote 73] for immediate custodial sentences were the highest for mixed and the other ethnic group, at 90%, followed closely by Asian and black ethnic groups at 89%, and white ethnic group at 88% (excluding ‘Missing/Not stated’). Over the past 5 years, concordance rates have been consistent for all defendants, with immediate custodial sentences ranging between 87% to 89% and community sentences ranging between 51% to 66%. Concordance rates for all PSR figures can be found in the Chapter 5: Defendants tables (Table 5.16b).
Of all PSRs issued in 2022, 26% were oral fast delivery PSRs[footnote 74], and 70% were written fast delivery PSRs, where ethnicity is known. Similar proportions were seen across ethnic groups with oral fast delivery PSRs ranging between 20% to 27% and written fast delivery PSRs ranging between 69% to 75%. Meanwhile, standard PSRs[footnote 75], which are given for more serious offences, were much less common at 4% overall, and ranging between 3% to 5% across ethnic groups. Since 2019, there has been a 62% decrease in oral PSRs issued, with a proportional 28% increase in written PSRs issued, where ethnicity is known. This is largely a result of court closures/limited court activity as a response to the COVID-19 pandemic when the probation service was limited in its capacity to deliver reports orally at court. As the courts recovered to pre-pandemic activity, the number of standard and written PSRs increased, suggesting that, following the pandemic there has been a shift from oral to written PSRs.
5.5 Sentencing Outcomes[footnote 76]
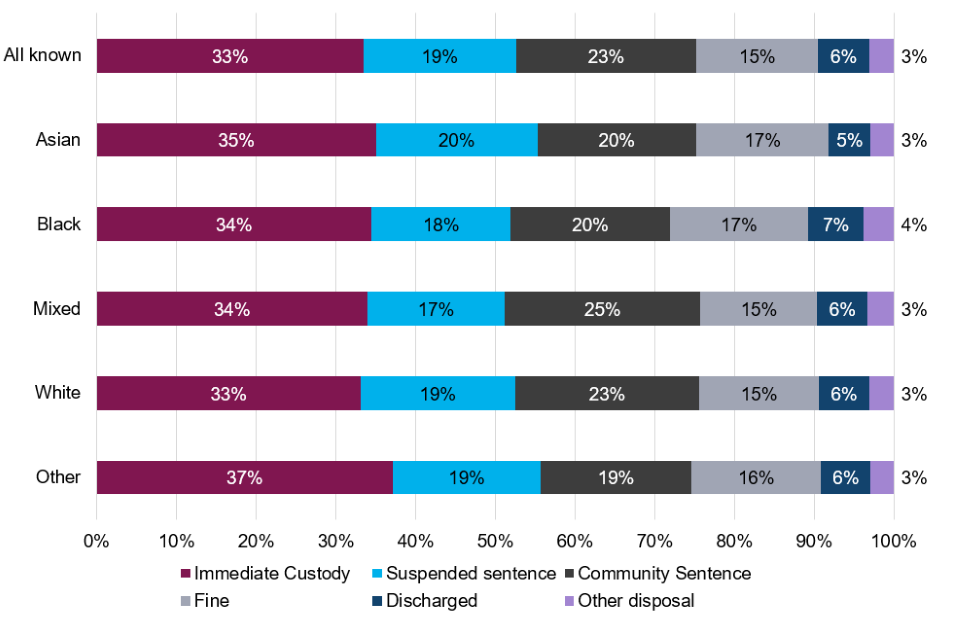
Figure 5.05a: Percentages of sentencing outcomes for all ethnicities, indictable offences, 2022, England and Wales
(Source: Ministry of Justice - Criminal Justice Statistics Quarterly: year ending December 2022 – Outcomes by Offence data tool)
Over the past 5 years, the most common sentence given for indictable offences across all ethnic groups was immediate custody, accounting for 33% of all offenders sentenced in 2022 (where ethnicity is known). In 2022, suspended sentences were most often given to Asian offenders at 20%, closely followed by white and other ethnicities (19%), black (18%) and mixed ethnic groups (17%). Community sentences were most frequently given to offenders from mixed ethnic groups at 25%, followed by white ethnic group (23%), Asian and black ethnic groups (20%) and other ethnicities (19%). Black and Asian ethnic groups were most likely to receive fine at 17%, followed by other ethnicities (16%), and white and mixed ethnicities (15%). However, broadly, all ethnic groups had similar overall sentencing outcomes. Sentencing outcomes across ethnic groups are heavily influenced by the offence mix, a major factor in determining sentencing outcomes. See figure 5.05a for all sentencing outcomes.
Custody Rate[footnote 77]
Over the past 5 years, the overall custody rate for indictable offences remained stable at between 33% and 34%, where ethnicity was known. The greatest increase in custody rate was seen for the other ethnic group, increasing from 36% in 2018 to 37% in 2022, whilst the custody rate for Asian offenders decreased from 39% in 2018 to 35% in 2022[footnote 78].
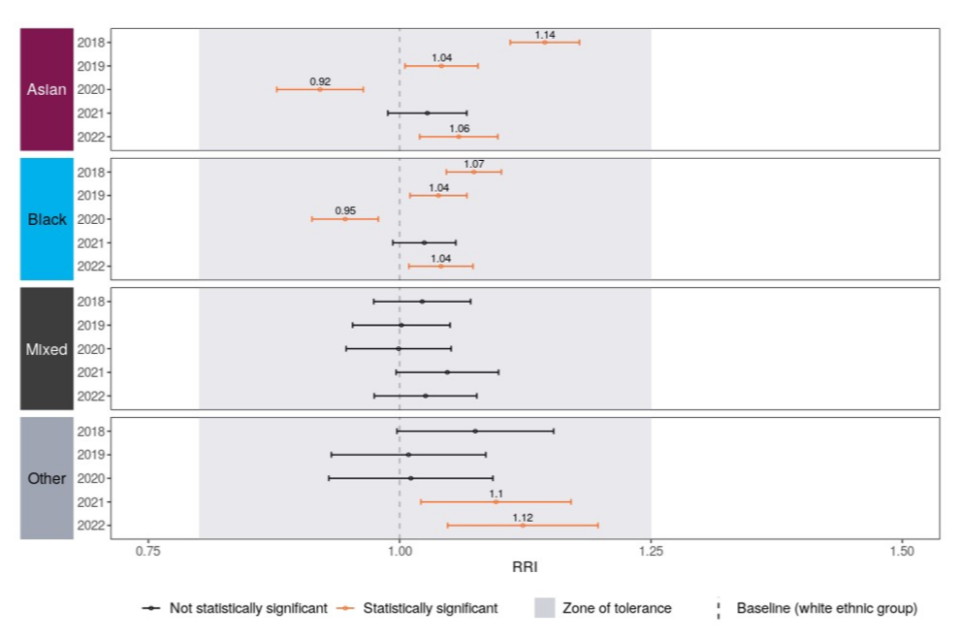
Relative Rate Index (RRI) analysis showed that in 2022, defendants from the mixed ethnic group were not significantly more or less likely to be sentenced to immediate custody compared to White defendants. Defendants from the other ethnic group were 12% more likely, while Asian and black defendants were 6% and 4% more likely to be sentenced to immediate custody in comparison with White defendants, respectively (see Chapter 5: Defendants tables – Table 5.17b).
Figure 5.05b: RRI of defendants sentenced to immediate custody per all sentenced for indictable offences, 2018-2022, England and Wales
(Source: Ministry of Justice – Ethnicity and the Criminal Justice System: Chapter 5: Defendants – Table 5_17 [derived from MoJ, CJSQ])
Average Custodial Sentence Length (ACSL)
The ACSL for indicatable offences[footnote 79] increased from 21.0 months in 2018 to 22.6 months in 2022[footnote 80]. However, this increase has not been gradual, with ACSL peaking in 2021 at 23.4 months. Over the past 5 years, ACSL was consistently lower for white defendants compared to all other ethnic groups combined. In 2022, the ACSL was 21.2 months for white defendants, compared to 30.5 months for Asian defendants (44% longer), 27.9 months for black defendants (32% longer), 25.2 months for mixed defendants (19% longer) and 22.9 months for the other ethnic group (8% longer). The difference in ACSL can be attributed to a range of factors, including the varying offence mix across ethnic groups (see Chapter 9: Offence Analysis). The lower ACSL for white defendants may be a result of a higher percentage of guilty plea rates for this ethnic group, resulting in shorter custodial sentences.
Figure 5.05c: The average custodial sentence length in months for offenders sentenced to immediate custody for indictable offences at all courts, by ethnicity, 2018 to 2022, England and Wales
(Source: Ministry of Justice - Criminal Justice Statistics Quarterly: year ending December 2022 – Outcomes by Offence data tool)
5.6 Guilty plea
Magistrates’ courts
The guilty plea rate[footnote 81] (GPR) of defendants who were proceeded against at magistrates’ court for indictable offences has decreased for the Asian (55% in 2018 to 53% in 2022) and black (58% in 2018 to 54% in 2022) ethnic groups, when compared to 2018. However, the guilty plea rate has increased for white defendants from 67% in 2018 to 68% in 2022, while the guilty plea rate for mixed and other ethnic groups remained stable at 60% and 55% respectively. Across the past 5 years white defendants consistently had the highest guilty plea rate, ranging between 62%-68%. In 2022, the white ethnic group had the highest guilty plea rate, at 68%, followed by the mixed ethnic group at 60%, the other ethnic group at 55%, black ethnic group at 54%, and Asian ethnic group at 53%.
Crown Court
The guilty plea rate[footnote 82] (GPR) of defendants who were committed for trial at Crown Court for indictable offences increased across all ethnic groups when compared to 2018. However, the guilty plea rate is lower for all ethnic groups when compared to 2020 and 2021. The overall increase in guilty plea rates in 2020 and 2021 was likely due to the COVID-19 restrictions courts faced on progressing jury trials (not guilty pleas). Across the past 5 years, white defendants consistently had the highest guilty plea rate, ranging between 68%-77%. In 2022, the white ethnic group had the highest guilty plea rate, at 68%, followed by defendants of mixed ethnic group at 64%, Asian ethnic group at 60%, and other and black ethnic groups at 58%.
Relative Rate Index
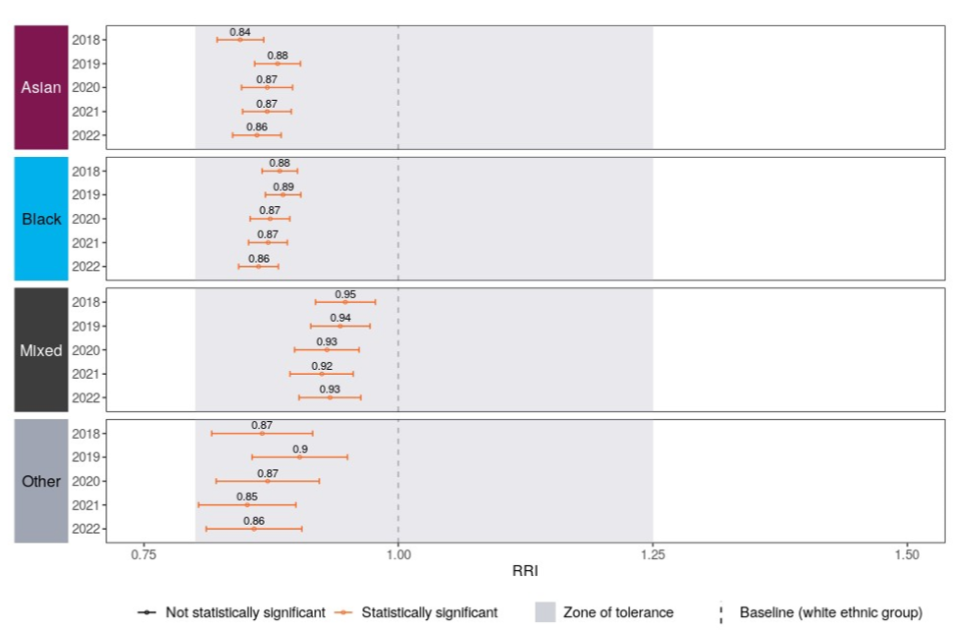
Figure 5.05d: Relative Rate Index (RRI): Defendants who entered a guilty plea per all that entered a plea, for indictable offences, at all courts[footnote 83] , 2018-2022, England and Wales
(Source: Ministry of Justice – Ethnicity and the Criminal Justice System: Chapter 5: Defendants – Table 5_17 [derived from MoJ, CJSQ])
RRI analysis showed that White defendants were more likely than all other ethnic groups to plead guilty for indictable offences. In 2022, defendants from Asian, black, and other ethnic groups were 14% less likely to enter a guilty plea than white defendants, while defendants from mixed ethnic groups were 7% less likely to enter guilty plea than white defendants (see Chapter 5: Defendants tables – Table 5.17c).
5.7 Case Management[footnote 84]
Effectiveness of Crown Court trials
In 2022, the effective trial rate was highest for cases involving defendants from the mixed ethnic group at 37%, and lowest for defendants from the Asian and other ethnic groups at 35%. This trend fluctuated over the last 5 years, with the court restrictions in place during the COVID-19 pandemic contributing to anomalous trends.
Election of defendants to Crown Court
In 2022, the black ethnic group had the highest proportion of defendants electing themselves to be heard at a Crown Court, at 27%. This was followed by defendants from the mixed ethnic group (21%), Asian defendants (18%), other defendants (17%), and white defendants (15%). This pattern has remained relatively stable over the past 5 years, with the black ethnic group having among the highest proportion of defendants electing themselves to be heard at Crown Court each year. Lower GPRs of defendants from all other ethnic groups combined will likely be related to the higher proportion deciding to elect to be tried by a jury at Crown Court. Election rates have increased across all ethnic groups over the last 5 years (3-10 percentage points).
Outstanding cases at Crown Court
Since 2018, the volume of outstanding cases has increased dramatically due to court restrictions put in place in response to the COVID-19 pandemic. The largest increase was seen in the other ethnic group (at 177%), and smallest in the white ethnic group (78%), although this is largely dependent on volumes of cases which differs significantly across white versus all other ethnic groups. Drug offences account for the highest proportion of outstanding cases involving defendants from the Asian and black ethnic groups (27%), whilst violence against the person offences account for the highest proportion of those involving defendants from mixed (30%), other (25%) and white (29%) ethnic groups.
Waiting times at Crown Court[footnote 85]
In 2022, the median waiting time was largely consistent between ethnic groups (between 18.4 and 18.5), whilst the mean waiting time differed between ethnic groups. The shortest was the white ethnic group at 25.8 weeks and longest was the Asian ethnic group at 32.3 weeks. For those remanded in custody, the trend was consistent, with the median waiting time between 13.9 and 14.0 weeks in 2022 for all ethnic groups. The mean waiting time for defendants from the white ethnic group was shortest at 17.4 weeks, and longest for those from the black ethnic group at 24.2 weeks. For those remanded on bail, the median waiting time between 23.6 and 23.9 weeks, with those from the other ethnic group experiencing the longest mean waiting times at 41.4 weeks, compared to 32.4 weeks for white defendants.
Crown Court timeliness
The average number of days from charge to completion at the Crown Court for defendants dealt with in Crown Court cases varied across ethnic groups. In 2022, white defendants had the lowest mean (265) and median (171) number of days, while defendants from Asian ethnic group had the highest mean (355) and those from the black ethnic group, the highest median (246). Time between charge and completion decreased in 2022 for all ethnic groups, after a peak in 2021 during and following the COVID-19 pandemic[footnote 86].
5.8 Criminal legal aid
Criminal legal aid consists of legal advice and representation provided to people being investigated or charged with a criminal offence, covering police stations, prisons, and the courts. Criminal legal aid can be split into two categories, crime higher and crime lower. Crime higher concerns legal representation in the Crown Court and above. Crime lower work is carried out by legal aid providers at police stations, in magistrates’ courts and prison. Crime lower work tends to be relatively high volume, lower cost units of criminal legal aid work.
Crime lower[footnote 87]
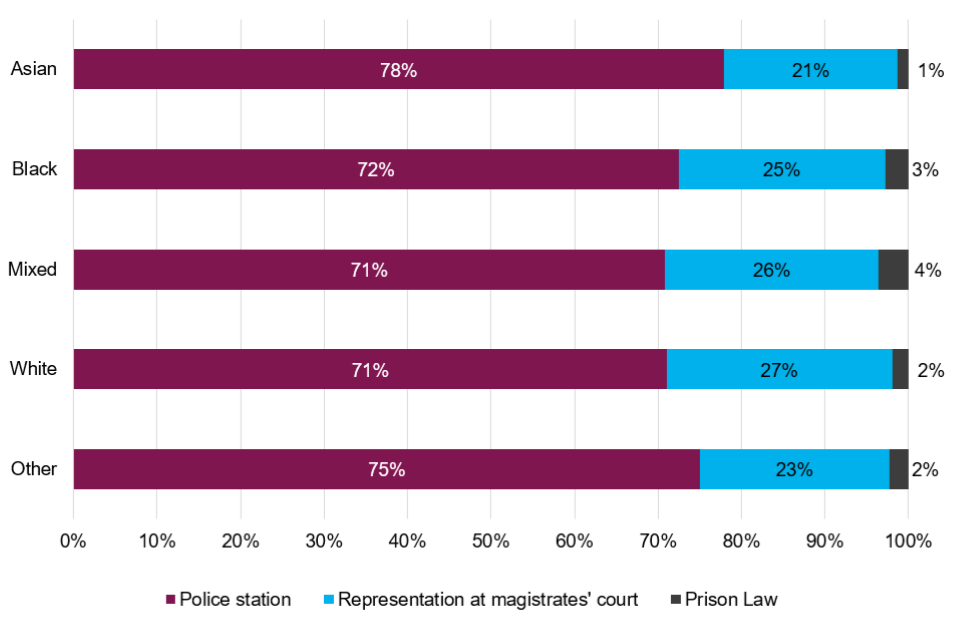
Figure 5.06: Crime lower legal aid workload, by ethnicity and legal aid category, 2022, England and Wales
(Source: Ministry of Justice – Ethnicity and the Criminal Justice System: Chapter 5: Defendants – Table 5.01 [derived from MOJ, OMSQ])
In 2022, 76% of crime lower legal aid workload was for white clients, with 7% for clients from each of the black, Asian, and the other ethnic group, with 3% for mixed ethnic groups. These proportions have remained relatively stable over the past 5 years. Police station advice and magistrates’ court representation constitute the majority of the total crime lower workload (98%). With police station advice alone making up 72% of the workload in 2022. Prison law comprised only 2% of the workload, which has remained stable over the past 5 years.
Of those who received legal aid, a larger proportion of white defendants (27%) received representation at magistrates’ court compared to all other ethnic groups combined, with mixed ethnic groups at 26%, black at 25%, the other ethnic group at 23% and Asian at 21%. Conversely, higher proportions of clients from all other ethnic groups combined received pre charge advice at 78% for Asian, 75% for the other ethnic group, 72% for black, and 71% for white and mixed ethnic groups.
Crime higher[footnote 88]
In 2022, 79% of crime higher legal aid workload was for white clients, with 9% for black, 8% for Asian, and 3% for mixed ethnic group clients. These proportions have remained stable over the last 5 years.
The largest proportion of crime higher workload was for offences which can be tried before either the magistrates’ court or the Crown Court, at 48% overall where ethnicity is known in 2022 and ranged between 46% and 51% when broken down by ethnic group. White clients had a higher proportion of representation at committals for sentence at 22%, compared to all other ethnic groups combined (13-18%), whilst higher proportions of clients from ethnic minorities (excluding white minorities) received representation for indictable trials at 36% for black, 34% for mixed ethnic group and 33% for Asian compared to 29% for white clients.
Prison representation[footnote 89]
In 2022, 73% of the legally aided prison law workload related to white defendants, 10% to black, 8% to other, and 5% to Asian and mixed ethnic groups. Over the past 5 years, these numbers remained stable with white defendants having the highest proportions of the legally aided prison law workload.
6. Offender Management
A greater number of children in prison were from ethnic minorities (excluding white minorities).
The ethnicity of prisoners varied across age groups, with a higher proportion of younger prisoners being from all other ethnic groups combined (51% of under 18-year-olds). In contrast, 16% of prisoners aged 50 or over were from all other ethnic groups.
Black prisoners served the greatest proportion of their original sentence in custody.
In line with previous years, black defendants continued to serve a greater proportion of their original determinate sentence in custody (68% in 2022) when compared with mixed (64%) white (59%), Asian (58%) and prisoners from other ethnic groups (61%).
In the 2022/23 HM Inspectorate of Prisons survey, prisoners from ethnic minorities (excluding white minorities) reported more negative results across the survey.
With slight differences between males and females, in comparison to other ethnic groups, higher proportions of white prisoners generally reported more positive experiences within prisons, including feeling respected by and receiving less abuse/victimisation from staff, access to daily showers, and having enough cleaning facilities.
This chapter provides statistics relating to offenders in custody or under supervision in the community. Much of this information has previously been published in the Offender Management statistics quarterly publication, where statistics on adjudications, Home Detention Curfew, Release on Temporary Licence and Licence Recalls can also be found.
Further information on the following topics related to offender management are available online: Safety in Custody, Substance Misuse Treatment Programmes.
The HMPPS Offender Equalities report 2021/22 also includes information on: Mother and Baby units, Sexual Orientation in the Prison Population, Transgender Prisoners, Accredited Programmes, Incentives and Earned Privileges.
6.1 Prison Population
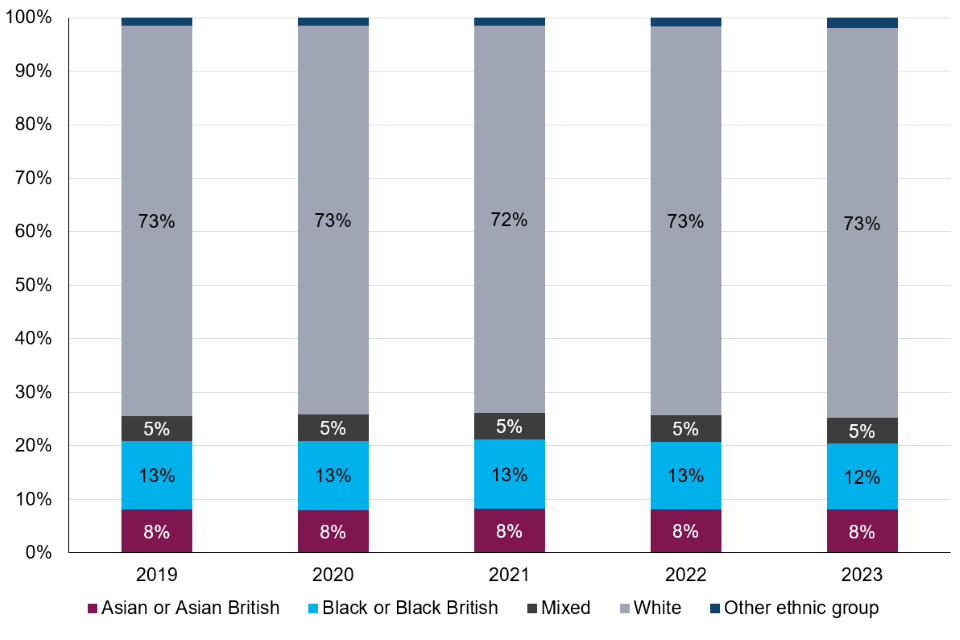
The total prison population in England and Wales was 85,900 on 30th June 2023, the highest within the last five years. The proportions of ethnic groups in the prison population have remained stable across the past 5 years. In June 2023, of prisoners whose ethnicity was known[footnote 90], 73% were white, 12% black, 8% Asian, 5% mixed and 2% from other ethnic groups.
The ethnicity of prisoners varied across age groups, with a higher proportion of younger prisoners being from all other ethnic groups combined (51% of under 18-year-olds). In contrast, 16% of prisoners aged 50 or over were from all other ethnic groups.
In 2023, black offenders made up 30% of the prison population for under-18-year-olds, despite black offenders accounting for only 12% of the whole prison population. Similarly, prisoners of mixed ethnic groups made up 13% of all prisoners under 18, yet only account for 5% of the entire prison population. Black and mixed ethnicity prisoners were disproportionately represented across all younger age groups, making up 22% and 8% respectively of all prisoners aged under 25.
Figure 6.01: Number and proportion of prisoners by ethnicity, England and Wales, years ending June 2018 to 2023
(Source: Ministry of Justice – Ethnicity and the Criminal Justice System: Chapter 6: Offender Management – Table 6_01 [derived from MoJ, OMSQ])
Figure 6.02: Proportion of prisoners by ethnicity and age group, England and Wales, year ending 30th June 2023
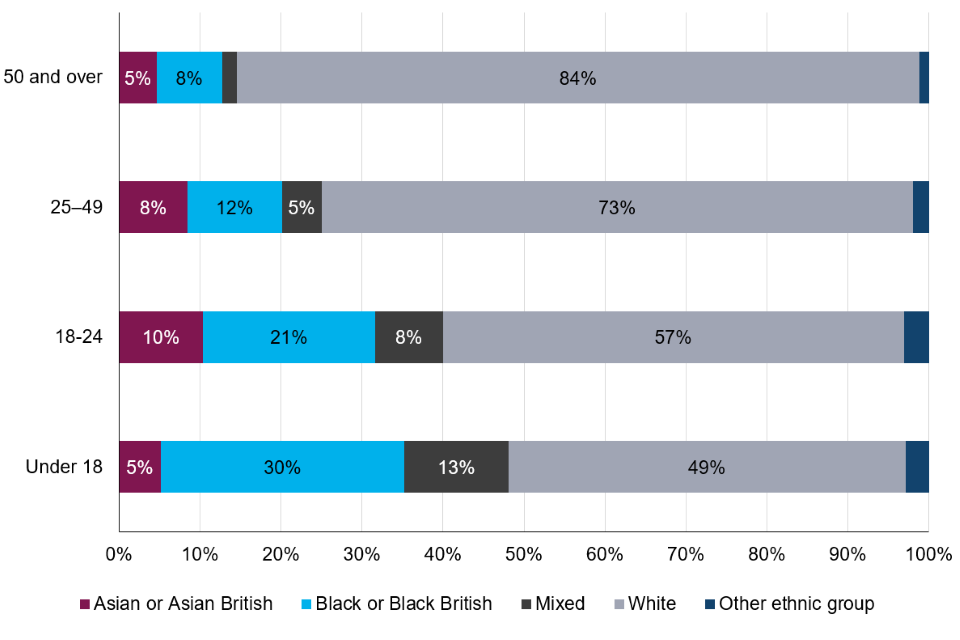
(Source: Ministry of Justice – Ethnicity and the Criminal Justice System: Chapter 6: Offender Management – Table 6_01 [derived from MoJ, OMSQ])
6.2 Proportion of custodial determinate sentence served
As observed in Chapter 5, white prisoners have consistently received the shortest average custodial sentence length (ACSL) in comparison to other ethnic groups. This section looks at the proportion of determinate[footnote 91] sentence served[footnote 92].
Asian prisoners, on average, served the smallest proportion of their original sentence, serving 58% of their determinate sentence in custody in 2022. Since 2018, black prisoners have consistently served a higher proportion of their determinate sentence, at 68% in 2022. Proportion of sentence served is affected by factors such as offence mix and behaviour in prison. See table 6.03 for all proportions of determinate sentences served.
Figure 6.03: Average proportion of determinate sentence served in custody by ethnicity, England and Wales, 2018 to 2022
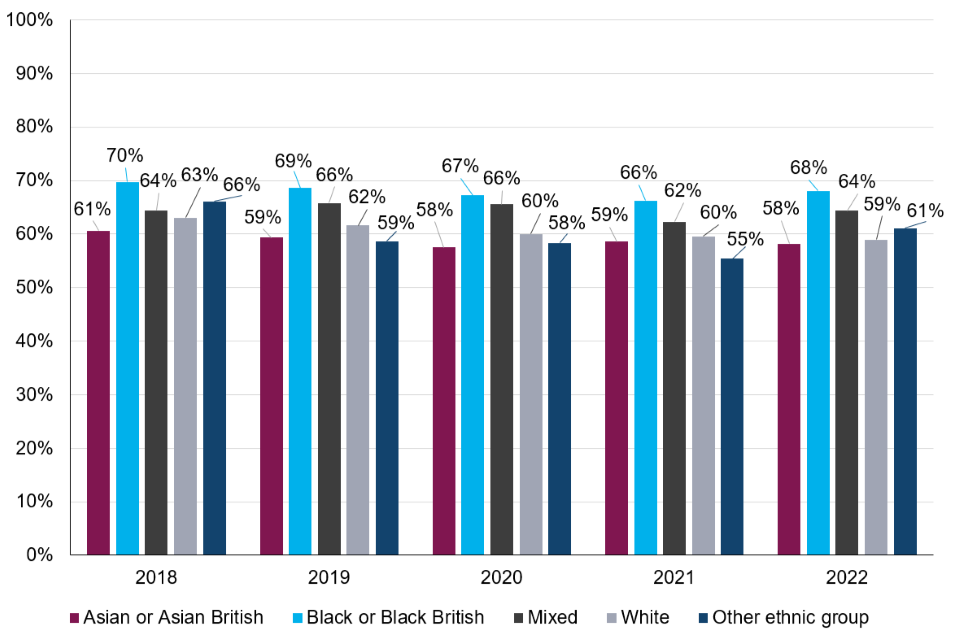
(Source: Ministry of Justice – Ethnicity and the Criminal Justice System: Chapter 6: Offender Management – Table 6_02 [derived from MoJ, OMSQ])
6.3 Prison Experience
Her Majesty’s Inspectorate of Prisons for England & Wales (HMI Prisons) aims to ensure independent inspection of places of detention, report on conditions and treatment, and promote positive outcomes for those detained and the public. The HMI Prisons Annual Report 2022-23 identifies differences in reported prison experiences between racial groups[footnote 93][footnote 94]. In this section, where there are statistically significant differences between groups at the 95% level, this will be stated. Where differences are not referred to as being statistically significant these are either not significantly different, or differences have not been tested.
Female white and mixed ethnicity prisoners reported more positive experiences on their wing/houseblock compared to black, and Asian prisoners, with 66% mixed, and 65% white prisoners reporting that they could shower every day, in comparison with 40% of black and 47% of Asian prisoners. Access to daily showers in Male prisons is higher, ranging between 71-81% across all ethnicities.
White male prisoners reported more positive relationships with staff; 74% reported feeling that they were treated respectfully by staff, in contrast to a range of 55-63% of prisoners from ethnic minorities (excluding white minorities). This is similar within female prisons, with 75% of Asian, and 72% of white prisoners feeling respected by staff, compared to only 53% and 56% of black and mixed ethnicities, respectively.
A slightly higher proportion of male prisoners from ethnic minorities (excluding white minorities) reported experiencing a form of verbal abuse/intimidation, physical or sexual assault, theft, and other types of victimisations from staff in the prisons; 50% for Asian prisoners, 48% for black, 47% for mixed, and 41% of prisoners of other ethnic groups, compared to 39% of white prisoners. This is similar within female prisons, with 58% of mixed ethnicity, and 53% of black prisoners reporting experiencing the above from staff, in comparison to 42% of white and 40% of Asian prisoners.
Fewer males of other ethnic group (34%), black (36%), and mixed (37%) prisoners reported experiencing verbal abuse/intimidation, physical or sexual assault, theft, and other types of victimisations from other prisoners, compared to white (42%) and Asian (40%) groups. Within female prisons, Asian prisoners report experiencing the highest levels of the above from other prisoners (81%), compared to 60-65% across other ethnicities.
6.4 Parole board[footnote 95]
The parole board carry out risk assessments on prisoners to determine whether they can be safely released into the community. Recommendations can also be made for a prisoner to remain in the open prison estate.
Figure 6.04: Outcomes of Parole Board hearings, by ethnicity, year ending March 2023, England and Wales
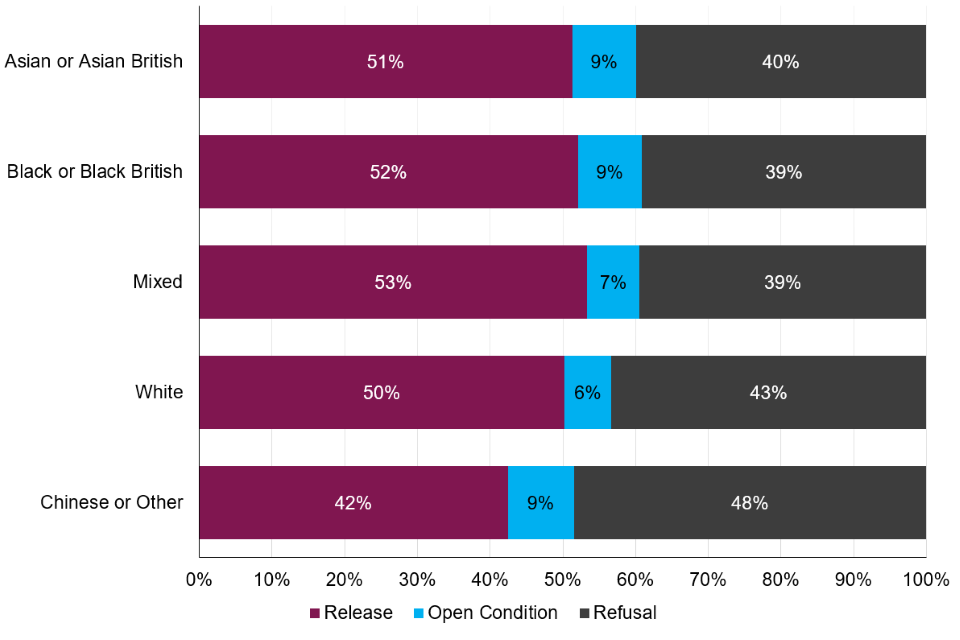
(Source: Ministry of Justice – Ethnicity and the Criminal Justice System: Chapter 6: Offender Management – Table 6_05 [derived from Parole Board])
In the year ending March 2023, there were 5,798 oral parole board hearings where ethnicity was recorded[footnote 96] Of these, 80% were white, 11% black, 5% Asian, 4% mixed ethnicity, and 1% Chinese and other ethnicities. These proportions have remained stable since year ending March 2020.
The proportion of white, black, Asian, and mixed ethnicity offenders that received an oral parole hearing in the year ending March 2023 remained relatively stable with a range of 50-53% receiving a release result, 6-9% remain in open prison estate, and 39-43% refusal of release. A lower proportion of Chinese or other ethnicity offenders received a release result (42%), and a higher proportion received a refusal result (48%)[footnote 97].
6.5 Probation
The Probation Service supervises offenders living in the community under a court order[footnote 98], including those starting supervision as a result of a community or suspended sentence and those who have been released from prison on licence.
In 2022, where ethnicity was known, the number of requirements started under community orders rose to 92,300[footnote 99]; an increase of 28% since 2020. A 34% increase was seen in requirements started under suspended sentence orders. These increases may be due to the removal of court restrictions that were introduced during COVID-19[footnote 100]. Of offenders receiving either type of order, 82% were white, 6% black, 6% Asian, 4% mixed ethnic groups and 2% other ethnic groups. These proportions have remained relatively stable when compared to 2020.
Figure 6.05: Requirements commenced under community orders and suspended sentence orders by ethnicity and requirement, England and Wales, 2022
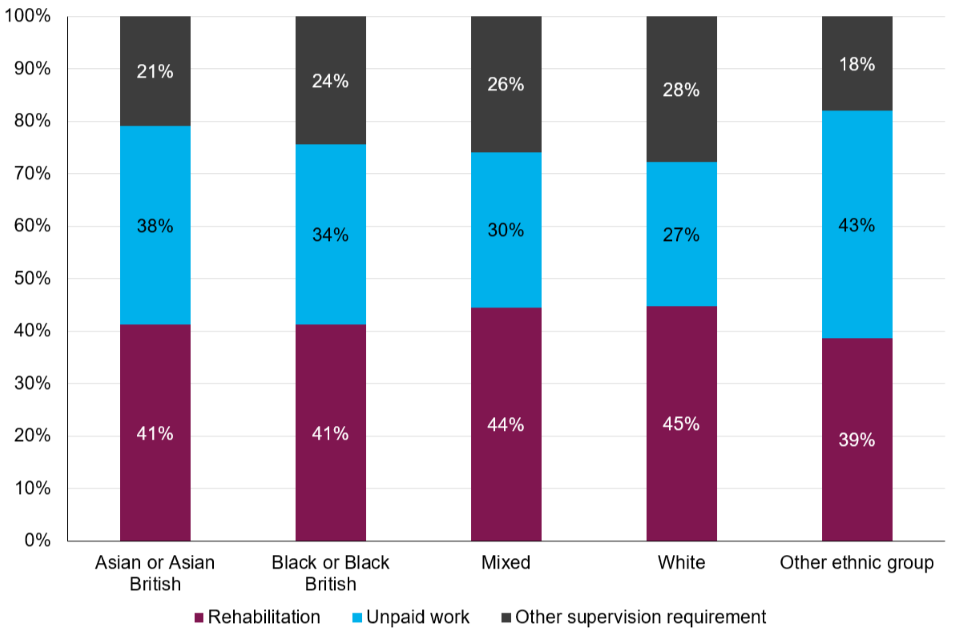
(Source: Ministry of Justice – Ethnicity and the Criminal Justice System: Chapter 6: Offender Management – Table 6_03 [derived from MoJ, OMSQ])
Of those who received a either a community or suspended sentence order, higher proportions of white, black, Asian and mixed ethnicity offenders received rehabilitation requirements[footnote 101], whereas higher proportions other ethnicity offenders received unpaid work requirements.
Of the 63,100 offenders supervised on post release licence in 2022[footnote 102], the proportions across ethnic groups remained in line with that of the previous five years, 75% were white, 11% black, 8% Asian, 5% mixed and 2% other ethnicities. Despite this, since 2018, a percentage decrease ranging between 6-16% was observed across all ethnic groups, except other ethnicities which has seen a 31% increase in post-release supervision in the last five years.
7. Offender characteristics
In 2022, 77% of all males prosecuted for indictable offences were from the white ethnic group, compared to 86% of all females prosecuted.
The proportion of defendants from the black ethnic group was 11% of all male prosecutions, compared to 6% of all female prosecutions.
A higher proportion of prosecutions for mixed and black ethnic groups were against children, 12% and 9%, respectively, compared to 4% for defendants from the white ethnic group.
In 2022, children from the black ethnic group received longer custodial sentences, at 23.8 months on average, an increase of 3.6 months compared to 2018 (20.2 months).
The reoffending rate of adults was highest for those aged 18-20 for ethnic minorities (excluding white minorities).
The reoffending rate for offenders from the black, Asian, and other ethnic groups was highest for those aged 18-20. For offenders from the white ethnic group, those aged 35-39 presented the highest reoffending rate.
The educational attainment of young people who were cautioned or sentenced for an offence was lowest for the white ethnic group, across all three measures.
Of young people from the white ethnic group matched to a KS4 attainment record in academic years 2013/14 and 2014/15, 12% achieved 5 or more GCSEs (or equivalents) graded A* to C, compared to other ethnic groups at 24%.
More than half of young people who were cautioned or sentenced for an offence were eligible for Free School Meals (FSM) across all ethnic groups.
This was highest across young people from other ethnic groups, at 64%, followed by the black ethnic group at 63%, compared to the white ethnic group at 52%. This contrasts with the proportion of pupils in the all-pupil population where 26% were eligible for FSM.
This chapter looks at the interaction between ethnicity and other key characteristics, including sex and age, within the criminal court system, using data from Criminal Justice System statistics: year ending December 2022. To note, we refer only to the most serious (indictable) offences[footnote 103] throughout the court statistics portion of this chapter, due to ethnicity being largely unknown for less serious (summary) offences. This chapter also includes analysis on offending histories, proven reoffending, and the educational background of offenders through a data sharing exercise between Ministry of Justice (MoJ) and Department for Education (DfE).
7.1 Sex & Ethnicity[footnote 104][footnote 105]
Prosecutions and convictions
For indictable offences, ethnic minorities (excluding white minorities) accounted for a higher proportion of male prosecutions and convictions compared to female. In 2022, males from the black ethnic group accounted for 11% of all male prosecutions and 10% of all male convictions, while females from the black ethnic group accounted for 6% of female prosecutions and convictions. Males from the Asian ethnic group accounted for 7% of male prosecutions and convictions, higher than females from the Asian ethnic group, who represented 3% of female prosecutions and 2% of female convictions.
Mixed ethnic groups accounted for 4% of prosecutions for both male and female offenders, 3% of female convictions, and 4% of male convictions. Male offenders from the white ethnic group represented 77% of prosecutions and convictions, while females from the white ethnic group accounted for 86% and 88%, respectively. These proportions have remained broadly consistent across the last 5 years.
Figure 7.01: Proportion of prosecutions for indictable offences by sex and ethnicity, England and Wales, 2022
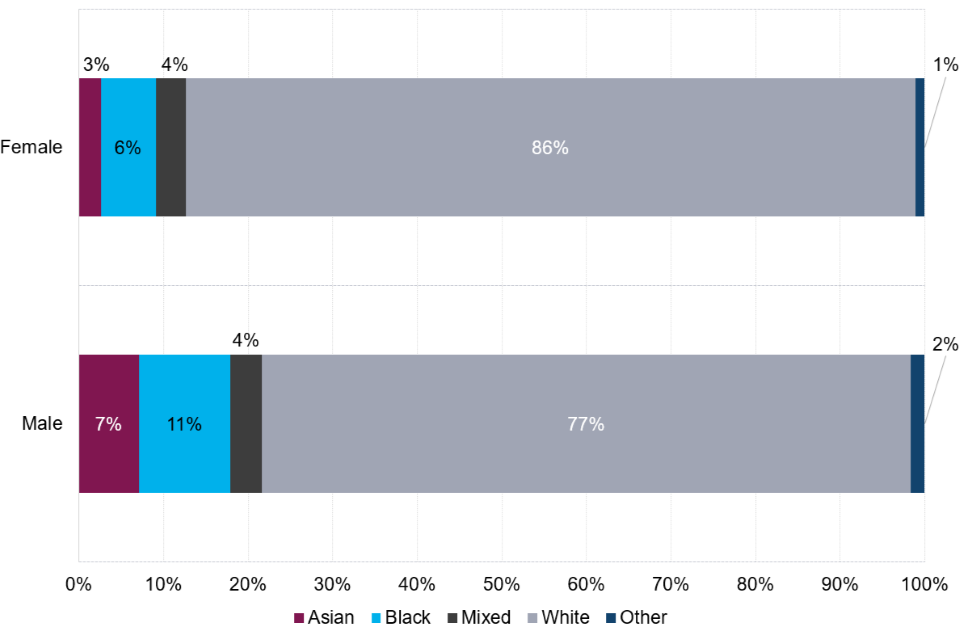
(Source: Ministry of Justice – Criminal Justice Statistics Quarterly: year ending December 2022 – Outcomes by Offence data tool)
Remands[footnote 106][footnote 107]
For indictable offences, females across all ethnic groups had lower proportions of defendants remanded in custody compared to males, both at magistrates’ courts and at the Crown Court, of all those appearing at court. In 2022, the highest proportion of females remanded in custody of all females appearing at magistrates’ courts was across the black ethnic group (15%), followed by the Asian (12%), mixed (12%), white (9%), and other (8%) ethnic groups. In contrast, males from the other ethnic group presented the highest proportion of defendants remanded in custody of all males appearing at magistrates’ court (30%), followed by the black (26%), mixed (26%), Asian (25%), and white (21%) ethnic groups.
At the Crown Court, the highest proportion of females remanded in custody of all females appearing at the Crown Court was across the other ethnic group (47%), followed by the mixed (40%), Asian (36%), black (35%), and white ethnic groups (34%). For males, the ethnic groups with the highest proportion of defendants remanded in custody were the other (61%), black (60%) and mixed ethnic groups (59%). The white and Asian ethnic groups had the lowest proportion at 53% and 51%, respectively.
Average Custodial Sentence Length (ACSL)[footnote 108]
In 2022, for indictable offences, male offenders from the Asian ethnic group had the longest ACSL, at 30.8 months. For female offenders, the longest ACSL was across the other ethnic group, at 21.3 months.
Offenders from the black ethnic group had the second longest ACSL for both male (28.3 months) and female (17.5 months) offenders. For female offenders, they were followed by the Asian (16.5 months), white (13.6 months), and mixed (11.5 months) ethnic groups; whilst male black offenders were followed by the mixed (26.1 months), other (23.1 months), and white (21.8 months) ethnic groups.
Differences in offence mix can cause apparent disparity between groups when comparing ACSL. For example, female offenders are more often dealt with for less serious offences than males; therefore, ACSL is consistently lower for female offenders. Equally, the impact of offence mix can be seen across ethnic groups, with each ethnic group potentially more likely to be dealt with for a different combination of offences, whose overall seriousness may impact that group’s ACSL.
Figure 7.02: Average custodial sentence lengths (ACSL) for indictable offences, by sex and ethnicity, England and Wales, 2022
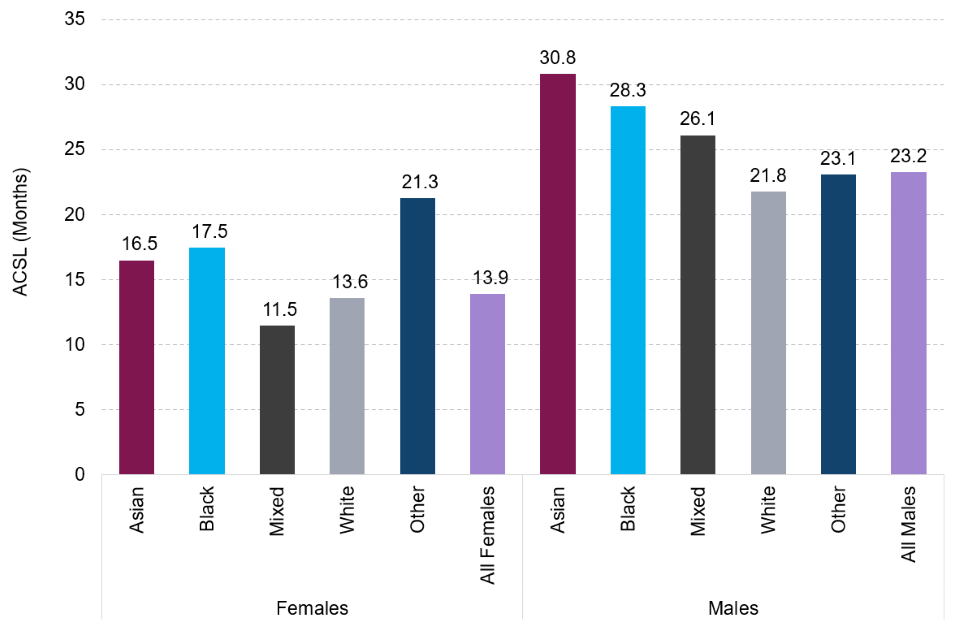
(Source: Ministry of Justice – Criminal Justice Statistics Quarterly: year ending December 2022 – Outcomes by Offence data tool)
7.2 Age[footnote 109][footnote 110]
Prosecutions
In 2022, for indictable offences, the proportion of children prosecuted was highest among defendants from the mixed and black ethnic groups, with 12% and 9%, respectively. For defendants from the Asian and the other ethnic groups, the proportion of children prosecuted was 5% each. Children accounted for 4% of total prosecutions of defendants from the white ethnic group, the lowest proportion of child prosecution among all ethnic groups.
Across the Asian and mixed ethnic groups, drug offences were the most common offence, representing 27% of all prosecutions relating to children from the Asian ethnic group and 24% of prosecutions relating to children from the mixed ethnic group. The most common offence for children from the black ethnic group was possession of weapons (28%), whilst both the white and the other ethnic groups had theft as the most common offence, with a proportion of 22% of children prosecuted for theft offences. For children from the white ethnic group, violence against the person also represented 22% of child prosecution.
Figure 7.03: Age of defendants proceeded against at court for indictable offences by ethnicity, England and Wales, 2022
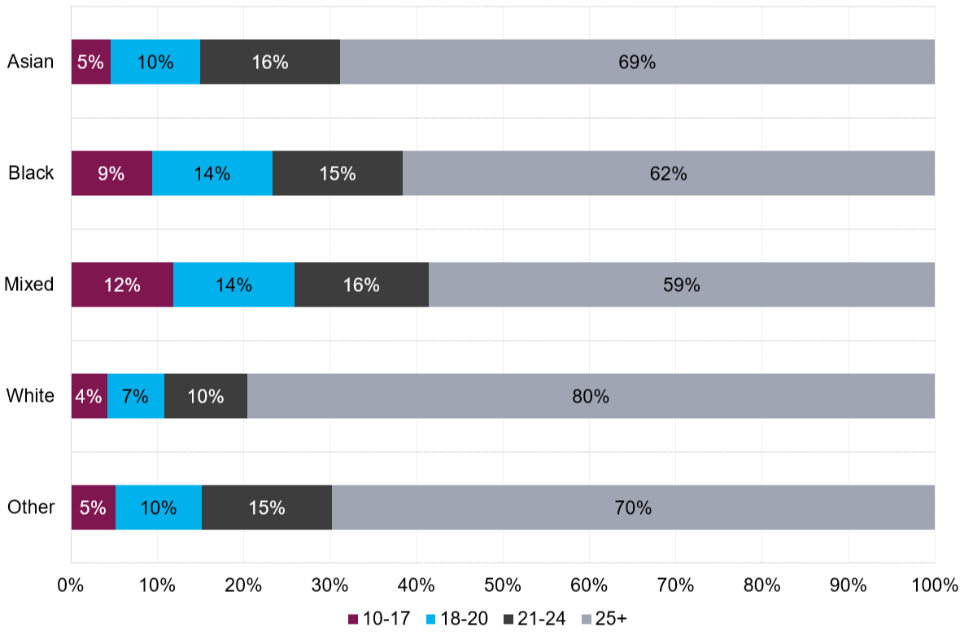
(Source: Ministry of Justice – Criminal Justice Statistics Quarterly: year ending December 2022 – Outcomes by Offence data tool)
Remands[footnote 111]
In 2022, children from the white and Asian ethnic groups had a lower proportion of child defendants remanded in custody of all children appearing at magistrates’ court for indictable offences, at 4% each, compared to children from the mixed ethnic group at 8%, and the other and black ethnic group at 6% and 5%, respectively. The proportion of adults remanded in custody at magistrates’ courts was also lower across defendants from the white and Asian ethnic groups, at 20% and 25%, respectively, compared to the black ethnic group (27%), mixed ethnic group (27%), and the other ethnic group (29%).
The proportion of children from the black ethnic group remanded in custody at the Crown Court has decreased over the last 5 years, from 63% in 2018 to 55% in 2022, whilst the proportion of children from the white ethnic group increased from 45% in 2018 to 53% in 2022, converging with the proportion of children from ethnic minorities (excluding white minorities) remanded in custody at the Crown Court[footnote 112].
Defendants from the other and the black ethnic groups had the highest proportions of adults remanded in custody at the Crown Court, at 60% and 59%, respectively, compared to the mixed ethnic group (57%), white ethnic group (52%), and Asian ethnic group, with the lowest proportion at 51%.
Custody Rate[footnote 113] and Average Custodial Sentence Length (ACSL)
In 2022, children from the mixed ethnic group had the lowest custody rate for indictable offences compared to other ethnicities, at 5%. Children from the other ethnic group had the highest custody rate, at 11%, followed by the black ethnic group at 8%. Children from the Asian and white ethnic groups presented a custody rate of 6% each[footnote 114].
The overall custody rate for children has decreased in the last five years, from 11% in 2018 to 7% in 2022. The custody rate for adult offenders also decreased slightly from 36% in 2018 to 35% in 2022. The custody rate for children from the black ethnic group had a decrease of 7 percentage points (pp), from 15% in 2018 to 8% in 2022.
Figure 7.04: Average custodial sentence length (ACSL) for indictable offences, by age group and ethnicity, England and Wales, 2022
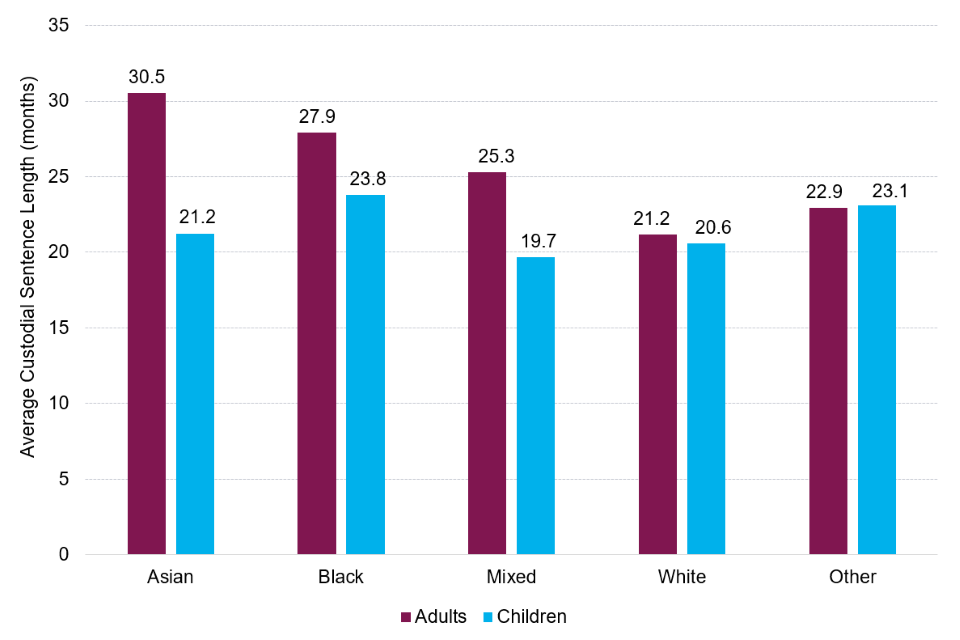
(Source: Ministry of Justice – Criminal Justice Statistics Quarterly: year ending December 2022 – Outcomes by Offence data tool)
Of all children sentenced to immediate custody in 2022, children from the mixed ethnic group had the shortest ACSL at 19.7 months, whilst children from the black ethnic group had the longest ACSL, at 23.8 months, followed by children from the other ethnic group at 23.1 months. The ACSL for children from the Asian and white ethnic groups was 21.2 and 20.6 months, respectively.
7.3 Offender Histories[footnote 115]
A first-time offender is an offender[footnote 116] who has been recorded on the Police National Computer (PNC) by an English or Welsh police force as having received their first conviction, caution or youth caution. All offenders prosecuted by an English or Welsh police force, irrespective of country of residence, are included.
For indictable offences in 2022, the black ethnic group had the lowest proportion of first-time offenders, with 18% of all offenders from the black ethnic group being first-time offenders. Offenders from the other ethnic group[footnote 117][footnote 118], had the highest proportion[footnote 119] of first-time offenders, with 37% of all offenders from the other ethnic group being first-time offenders, followed by the Asian[footnote 120] and white[footnote 121] ethnic groups at 28% and 19%, respectively.
The highest proportion of offenders with a long history of reoffending (15 or more previous convictions or cautions) was across the white ethnic group, where 31% of white offenders had a long history of offending[footnote 122], followed by offenders from the black ethnic group at 22%, Asian ethnic group at 14%, and the other ethnic group, with the lowest proportion of offenders with a long history of reoffending, at 8%.
Within juveniles[footnote 123], the overall proportion of offenders with 15 or more previous cautions and convictions was 1%. Within individual ethnic groups, the Asian ethnic group and the other ethnic group had higher rates of first-time offenders, at 65% and 62%, respectively, compared to the white ethnic group at 54%, and the black ethnic group at 49%. The black ethnic group was the only one among children to present a higher number of offenders with previous offending history (51%) compared to first-time offenders at 49%.
When only adults were considered, the proportion of offenders with previous offending history was higher across all ethnicities, with the black ethnic group having the highest proportion of offenders who had previous offending history, at 85% of all black offenders, followed by the white ethnic group at 83%, the Asian ethnic group at 74%, and the other ethnic group, with the lowest proportion of offenders with previous offending history at 65%.
7.4 Proven reoffending[footnote 124]
A proven reoffence is defined as any offence committed in a one-year follow-up period that resulted in a court conviction, caution, reprimand or warning in this timeframe, or a further six-month waiting period to allow the offence to be proven in court.
Adults
In the 2020/21 cohort[footnote 125], the reoffending rate for adults was highest for offenders from the white ethnic group at 25.1%, followed by the black ethnic group at 24.5%, the Asian ethnic group at 19.6%, and offenders from the other ethnic group at 19.3%. The white ethnic group also had the highest average number of reoffences per reoffender, at 3.7 reoffences, followed by the black ethnic group at 3.2. Offenders from the Asian and the other ethnic group had lower rates at 3.1 each.
Figure 7.05: Adults proven reoffending rate[footnote 126], by ethnicity, annual averages (2016/17 to 2020/21), England and Wales
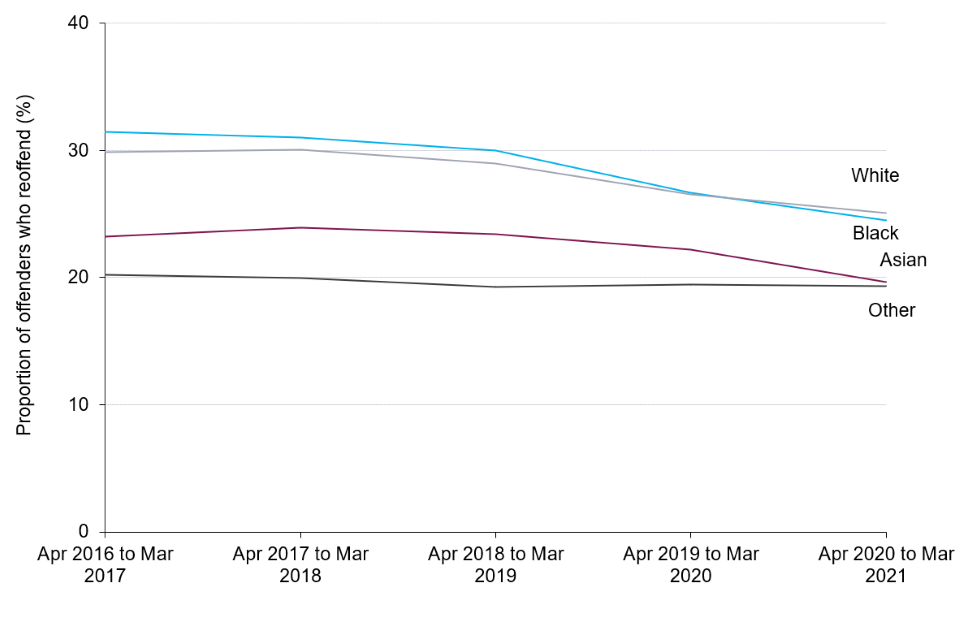
(Source: Ministry of Justice – Proven Reoffending Statistics: Apr 2020 to March 2021)
Figure 7.06: Adult reoffending rate, by age group and ethnicity, April 2020 to March 2021 offender cohort, England and Wales
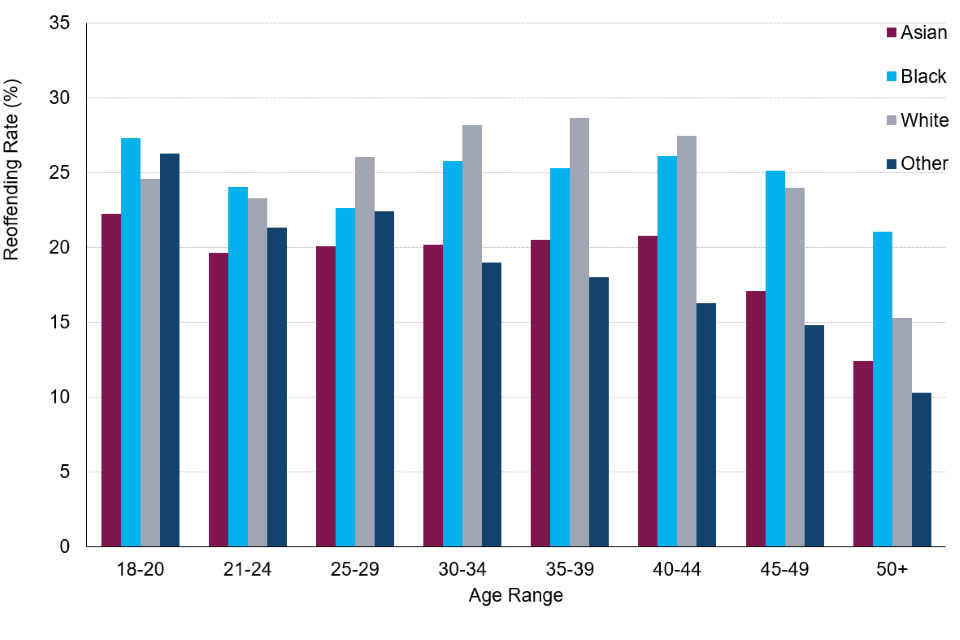
(Source: Ministry of Justice – Proven Reoffending Statistics: Apr 2020 to March 2021)
The reoffending rate for adult offenders from the black, Asian, and the other ethnic group was highest for those aged between 18 to 20. In contrast, the proportion of reoffending for adult offenders from the white ethnic group was highest for those aged 35 to 39.
Children
The juvenile reoffending rate was higher across all ethnic groups compared to adults.
Within children, the proportion of offenders who reoffend was higher across the black ethnic group, at 36.8% in the 2020/21 cohort, and has been consistently higher over the last five years, compared to other ethnicities. Children from the white ethnic group had a reoffending rate of 32.4%, followed by the other ethnic group at 28.2%, and the Asian ethnic group at 25.5%. The reoffending rate in the 2020/21[footnote 127] offender cohort decreased compared to 2016/17, with the highest reduction across children from the black and the other ethnic group, decreasing 11.8 pp each, followed by the Asian ethnic group (10.5pp), and the white ethnic group (9.5pp).
In the latest year[footnote 128], children from the white ethnic group had the highest average number of reoffences per reoffender, at 3.74, followed by the other ethnic group at 3.46, and the black ethnic group at 3.02. Children from the Asian ethnic group presented the lowest average, at 2.98.
Figure 7.07: Children reoffending rate, by ethnicity, annual averages (2016/17 to 2020/21), England and Wales
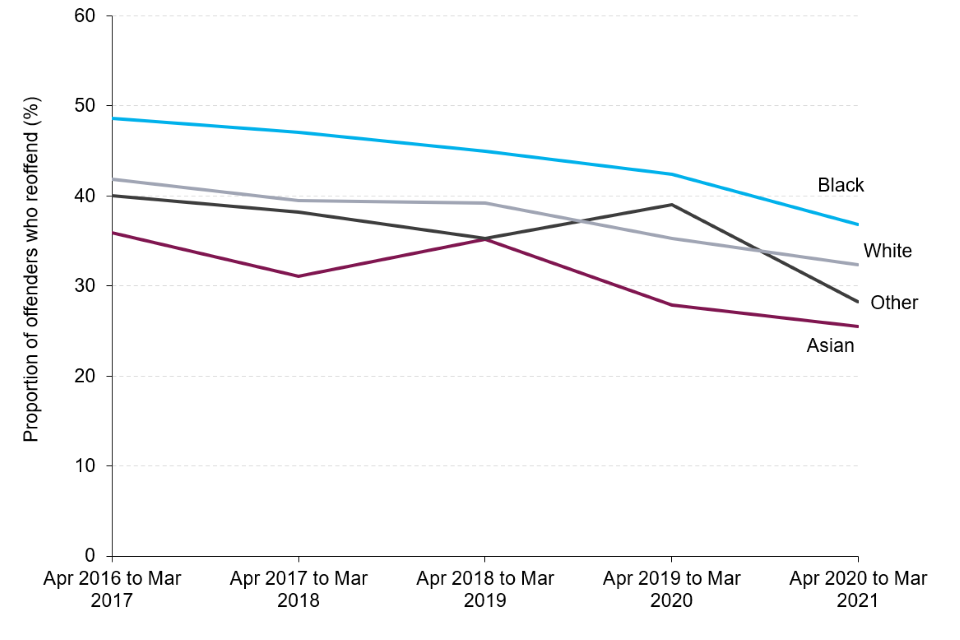
(Source: Ministry of Justice – Proven Reoffending Statistics: Apr 2020 to March 2021)
7.5 Educational background of young people who had been cautioned or sentenced for an offence[footnote 129]
Findings from a data sharing exercise between the MoJ and the Department for Education (DfE) are presented here, with analysis on a matched cohort of those who were in year 6 in either 2008/09 or 2009/10 and who were aged ten at the start of those academic years[footnote 130]. To avoid inconsistency in the length of their offending histories, for those with a KS2 academic year of 2008/09 their offending data has been considered up to 31 December 2019 and for those with a KS2 academic year of 2009/10 it has been considered up to 31 December 2020.
This analysis compares the police identified ethnicities in the matched cohort of young people cautioned or sentenced for an offence, broken down by disposal type, educational attainment, pupil characteristics, persistent absence and exclusion. Results are provided for the all-pupil cohort for comparison purposes[footnote 131][footnote 132].
Educational Attainment at Key Stage 4 (KS4)[footnote 133]
Across all three attainment measures, the educational attainment of young people who had been cautioned or sentenced for an offence was lowest for the white ethnic group. This was also largely consistent across all disposal types. There was greater variation amongst those with the highest educational attainment across the three measures and disposal types, though attainment tended to be highest for the Asian and the other[footnote 134] ethnic group
Figure 7.08: Proportion of young people cautioned or sentenced for an offence who matched to a Key Stage 4 attainment record in academic years 2013/14 and 2014/15, and all-pupil population, by ethnicity, in England
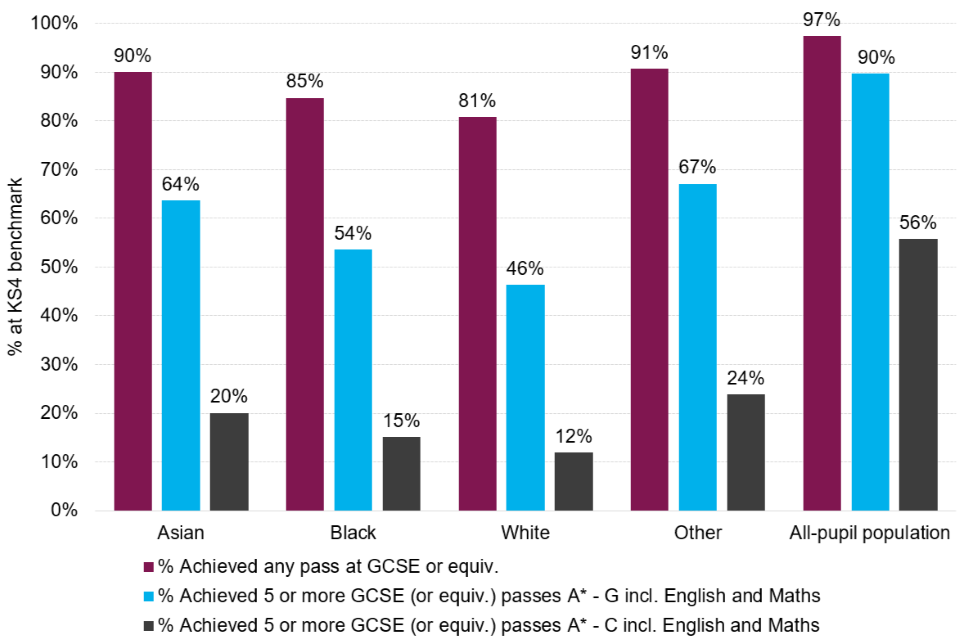
(Source: Ministry of Justice – Ethnicity and the Criminal Justice System: Chapter 7: Offender Characteristics – Table 7.01 [derived from MoJ/DfE Data Share])
The proportion of young people who had been cautioned or sentenced for an offence who achieved 5 or more GCSEs (or equivalents) graded A* to C, including English and Maths, was highest among those in receipt of a fine. This was higher for the Asian (28%) and the other (22%) ethnic group than it was for white (20%) and black (19%) ethnic groups.
The wider attainment measure of 5 or more GCSEs (or equivalents) graded A* to G, including English and Maths was achieved by a greater proportion of pupils. Figure 7.08 shows that of all young people who had been cautioned or sentenced for an offence, 46% of the white, 54% of the black, 64% of the Asian and 67% of the other ethnic group achieved this attainment level. However, this was lower than the proportion of the all-pupil population achieving this attainment level (90%)[footnote 135][footnote 136].
Pupil characteristics
In this section, all analysis looks at those in the matched cohort of young people who had been cautioned or sentenced for an offence, who were eligible for Free School Meals[footnote 137] (FSM) and/or recorded as having Special Educational Needs[footnote 138] (SEN), at any point during secondary school.
Pupil Characteristics: Free School Meals
Where ethnicity was recorded in the data, over half of young people who had been cautioned or sentenced for an offence were eligible for FSM: white (52%), black (63%), Asian (56%), and other (64%) This contrasts with the proportion of pupils in the all-pupil population where 26% were eligible for FSM[footnote 139][footnote 140].
The FSM eligibility of young people who had been cautioned or sentenced for an offence was higher for the black and the other ethnic group across all disposal types compared to the white and Asian Ethnic groups. The greatest FSM eligibility across the ethnic groups was largely among those who had received an immediate custodial sentence.
Figure 7.09: Proportion of young people who had been cautioned or sentenced for an offence matched to a Key Stage 4 academic year of 2013/14 or 2014/15, known to be eligible for free school meals, by ethnicity, in England
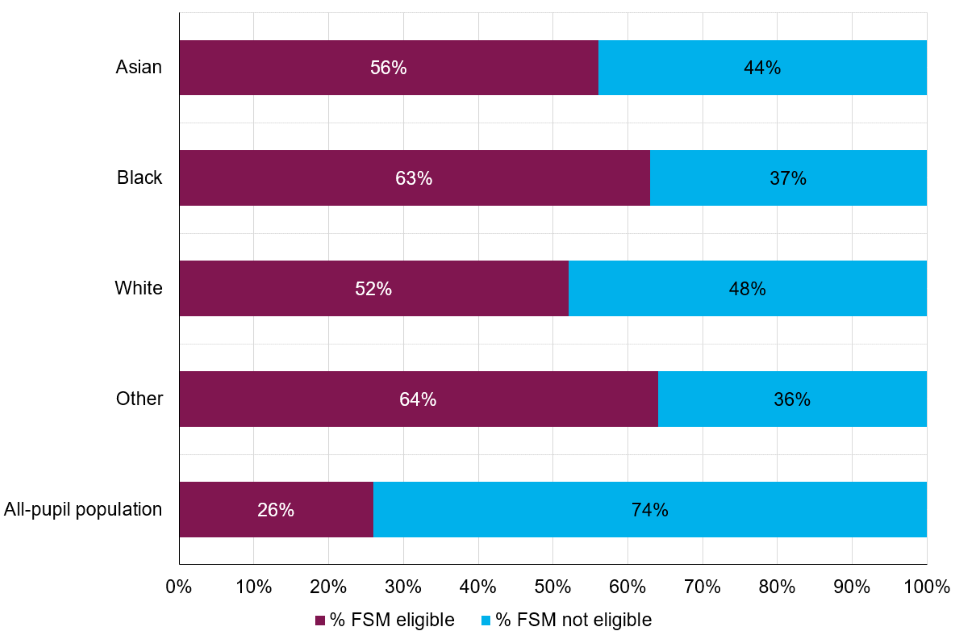
(Source: Ministry of Justice – Ethnicity and the Criminal Justice System: Chapter 7: Offender Characteristics – Table 7.02 [derived from MoJ/DfE Data Share])
Pupil Characteristics: Special Educational Needs (SEN)
Of the young people cautioned or sentenced for an offence, a greater proportion of the white (15%) and black (11%) ethnic groups were recorded as having an Education, Health and Care (EHC) plan[footnote 141] compared to the Asian (4%) and the other ethnic group (6%). This was also much higher than the proportion of the all-pupil population who were recorded as having an EHC plan (4%)[footnote 142][footnote 143].
Figure 7.10 shows that overall, more than half of young people cautioned or sentenced for an offence had been recorded as having SEN support[footnote 144]. Across almost all disposal types there was a larger proportion of young people within the black ethnic group recorded as having SEN support compared to the white, Asian and the other ethnic group.
Figure 7.10: Proportion of young people cautioned or sentenced for an offence matched to a Key Stage 4 academic year of 2013/14 or 2014/15, and all-pupil population, with Special Educational Needs, by ethnicity, in England[footnote 145]
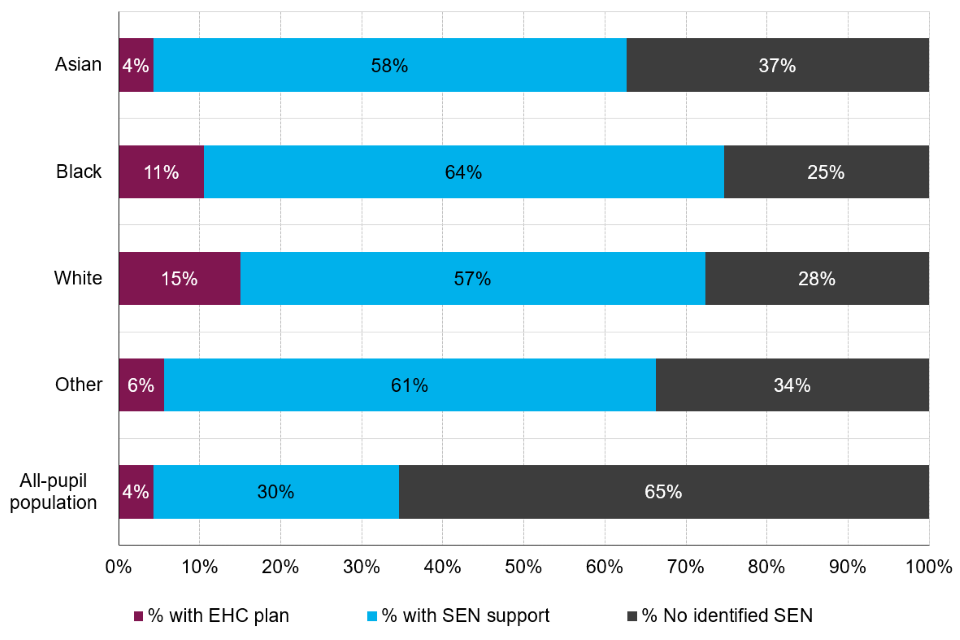
(Source: Ministry of Justice – Ethnicity and the Criminal Justice System: Chapter 7: Offender Characteristics – Table 7.03 [derived from MoJ/DfE Data Share])
Persistent absence and exclusion
The matched cohort data also provided information on the proportion of those sentenced/cautioned that have a history of being persistently absent from school, have a previous record of being permanently excluded from school, or have received a suspension, at any point during KS4.
Persistent absence[footnote 78]
The matched cohort data also provided information on the proportion of those cautioned or sentenced for an offence that had a history of being persistently absent[footnote 146] from school at any point during secondary school, had a previous record of being permanently excluded[footnote 147] from school at any point during primary or secondary school, or had received a suspension[footnote 148] from school at any point during primary or secondary school.
Of those young people cautioned or sentenced for an offence, a greater proportion of the white ethnic group had been persistently absent (77%) than the black (66%), Asian (67%) and the other ethnic group (60%). This was consistent across every disposal type. The greatest difference was for those dealt with by a discharge (82% of the young white ethnic group compared with 68% of the black, 68% of the Asian and 59% of the other ethnic group). In contrast, the proportion of pupils in the all-pupil population who had been persistently absent was 44%[footnote 149][footnote 150].
A larger proportion of the young black ethnic group cautioned or sentenced for an offence received either a suspension (77%), or a permanent exclusion (14%) compared with the white (71% suspension and 11% permanent exclusion), Asian (66% suspension and 7% permanent exclusion) and the other ethnic group (67% suspension and 8% permanent exclusion). Across the ethnic groups, the greatest proportion of suspensions was largely for those in receipt of an immediate custodial sentence. The proportion of pupils in the all-pupil population who had received a suspension or permanent exclusion was 14% and 1% respectively[footnote 151][footnote 152].
8. Practitioners
The ethnic profile of practitioners in the Criminal Justice System (CJS) has become slightly more diverse over the last 5 years
The proportion of staff from white backgrounds has decreased between 1 and 3 percentage points across all CJS organisations over the last 5 years, as a result of increases in the proportion of staff from all other ethnic groups.
This chapter reports on the trends in the composition of staff and practitioners throughout the Criminal Justice System (CJS) by ethnicity. It draws upon published extracts of human resources records for the police (2022/23), Ministry of Justice (MoJ; 2021/22), Crown Prosecution Service (CPS; 2022), His Majesty’s Prison and Probation Service (HMPPS; 2022/23), magistracy and judiciary. To allow for variable changes in headcount throughout the period considered, the ethnicities are best considered in terms of proportions of staff rather than absolute numbers[footnote 153].
8.1 Trends in CJS organisations
Ministry of Justice: Between 2018 and 2022, there has been a 2.4 percentage points (pp) decrease in proportion of staff from the white ethnic group, offset by increases in in the proportion of staff from Asian (1.7 pp)[footnote 154], black (0.3 pp) and mixed (0.8 pp) ethnic groups[footnote 155].
Crown Prosecution Service (CPS): Where ethnicity was stated, the proportion of CPS staff from a white ethnic background has fallen by 2.2 pp, offset by a 2.1 pp increase in the proportion of staff from the Asian ethnic group[footnote 156][footnote 157].
Police officers: The proportion of white practitioners is highest for police officers of all the CJS organisations at 91.6%, despite a 1.4 pp decrease in white officers between 2019 and 2023. The proportion of police officers belonging to all other ethnic groups has increased from 6.9% to 8.4% between 2019 and 2023[footnote 158].
His Majesty’s Prison and Probation Service (HMPPS): Between 2019 and 2023, the proportion of white HMPPS staff has decreased, from 90.4% to 87.4%, due to an increase in the proportion of staff from black (1.1 pp), Asian and mixed (0.9 pp) ethnic groups[footnote 159].
Judiciary: The proportion of white judges has fallen by 1.9 pp, between 2018/19 and 2022/23, driven mainly by an increase in the proportion of practitioners from Asian (1.3 pp) and mixed (0.8 pp) ethnic groups[footnote 160].
Magistrates: The ethnic background of serving magistrates, where ethnicity was known, has remained broadly similar between 2018/19 and 2022/23. The largest change in the proportion of in-post magistrates was a 1 pp decrease in white practitioners and increases of 0.4 pp in the Asian, black and mixed ethnic groups[footnote 161].
Figure 8.01: Proportion of practitioners in organisations involved in the CJS of each ethnicity, by organisation, most recent year available and five years prior, England and Wales
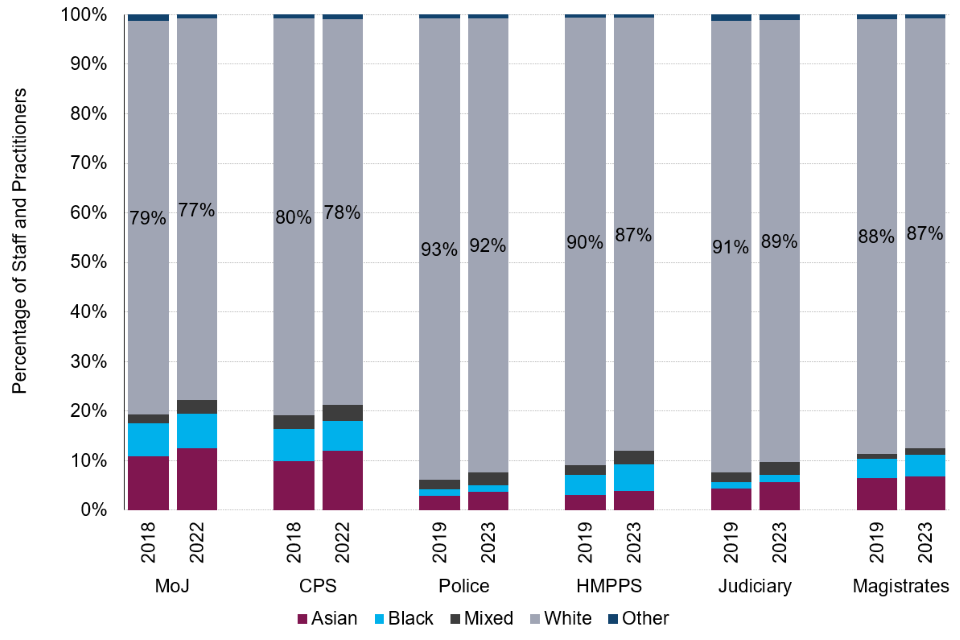
(Source: Ministry of Justice – Ethnicity and the Criminal Justice System: Chapter 8: Practitioners – 8.01, 8.03, 8.05, 8.10 and Judicial Diversity Statistics [2019 and 2023])
8.2 Trends in senior staff and practitioners
Caution should be taken when considering the ethnic breakdown of senior staff because the number of individuals represented is small and changing a single case could have a noticeable effect. Higher proportions of staff and practitioners in more senior roles were white for all organisations, when compared to the ethnic breakdowns of less senior staff[footnote 162].
9. Offence analysis
There was an association between an offender’s ethnicity and receiving a custodial sentence for indictable offences between 2018 and 2022.
When controlling for various offender and case characteristics within logistic regression models, there was a statistically significant association for offenders of black and mixed ethnicity with increased odds of receiving a custodial sentence compared to the white ethnic group, across all five-years 2018-2022.
The extent of ethnic disparity in custodial sentencing varied across offence groups.
When controlling for various offender and case characteristics within logistic regression models, the clearest disparity was seen for drug offences, where offenders from most ethnic minority groups were associated with a statistically significant increase in odds of receiving a custodial sentence. To a lesser magnitude, the black and mixed ethnic groups were also associated with increased odds of receiving a custodial sentence for violence against the person offences and sexual offences.
Differences were observed between granular ethnicities within the same aggregated ethnic groupings.
The logistic regression analysis highlighted the value of utilising detailed ethnic groupings when analysing ethnic disparity in sentencing, otherwise specific findings can be masked when limiting the approach to only include aggregated groupings. For example, the magnitude of association for the Chinese ethnic group being sentenced to custody for drug offences was notably larger compared to alternative ethnicities within the aggregated Asian group.
Investigating the association between an offender’s ethnicity and receiving a custodial sentence.
This chapter analyses the association between an offender’s ethnicity and receiving a custodial sentence for indictable offences[footnote 163], as opposed to an alternative non-custodial sentence[footnote 164], for sentences issued between 2018 and 2022. Firstly, Relative Rate Index (RRI) analysis is conducted to compare the custody rates of ethnic minority groups with the white ethnic group. This is followed by logistic regression analysis to investigate the relationship between ethnicity and sentence outcome when controlling for various offender and case characteristics. The focus throughout is firstly, to investigate whether trends have changed over time (2018-2022) and secondly, whether trends vary across offence groups (violence against the person, sexual offences, and drug offences).
This analysis was undertaken to enhance the ECJS publication, which is predominantly based on descriptive statistics, and provide further insight into the court outcomes of different ethnic groups. To help determine whether similar analysis is to be included in future editions of this publication and the Women and the Criminal Justice System publication, feedback is welcomed on the value of this analysis for users and can be directed to CJS_Statistics@justice.gov.uk.
9.1 Relative Rate Index (RRI)
Overview
As outlined in chapter 5, the custody rate for indictable offences was lowest for the white ethnic group, at 33%, with the highest being for the other ethnic group at 37%. The RRI analysis showed that defendants from the other ethnic group were 12% more likely to be sentenced to immediate custody for indictable offences in 2022, compared to white defendants. Additionally, Asian and black defendants were 6% and 4% more likely, respectively.
This section adapts the RRI analysis methodology to focus on specific offence groups (violence against the person, sexual offences and drug offences) to investigate whether this ethnic disparity in sentencing decisions is more, less or similarly prominent for particular types of offending, and if any trends have remained consistent over a five-year time period between 2018 and 2022. More information on RRI can be found in the technical guide.
Results
Violence against the person
Figure 9.01: RRI for offenders sentenced to immediate custody per all offenders sentenced for violence against the person offences, 2018-2022, England and Wales.
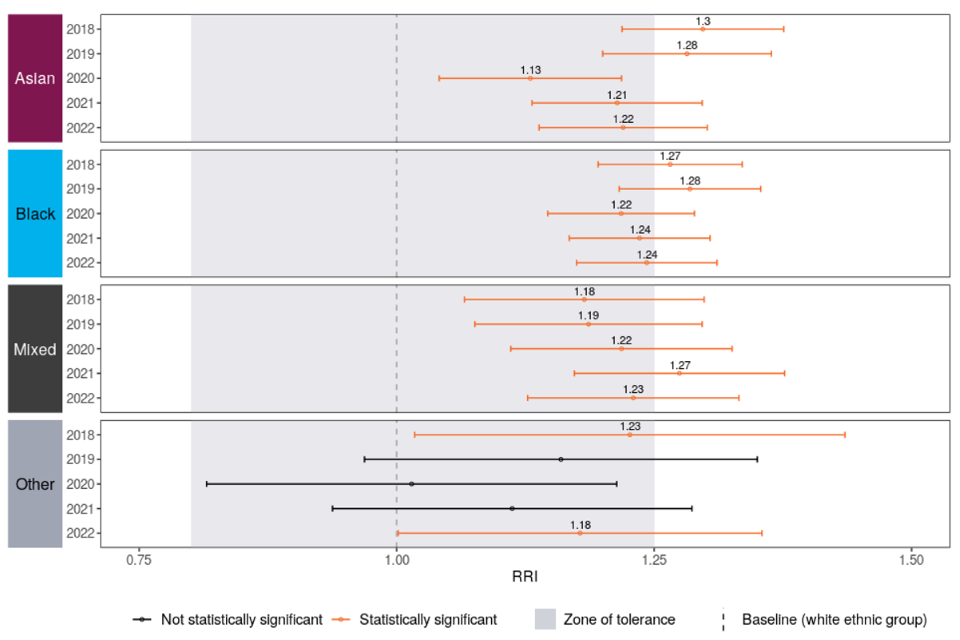
Offenders from the Asian, black and mixed ethnic groups were significantly[footnote 165] more likely to receive a custodial sentence for violence against the person offences, compared to white offenders, in all years 2018-2022. For Asian and black offenders, this was at a level considered practically significant in 2018 and 2019, whereas it has been within the zone of tolerance since 2020. The mixed ethnic group were 18% more likely in 2018, increasing to a practically significant level of 27% in 2021, before decreasing again to 23% in 2022. The other ethnic group were 23% more likely in 2018 and 18% more likely in 2022.
Sexual offences
Figure 9.02: RRI for offenders sentenced to immediate custody per all offenders sentenced for sexual offences, 2018-2022, England and Wales.
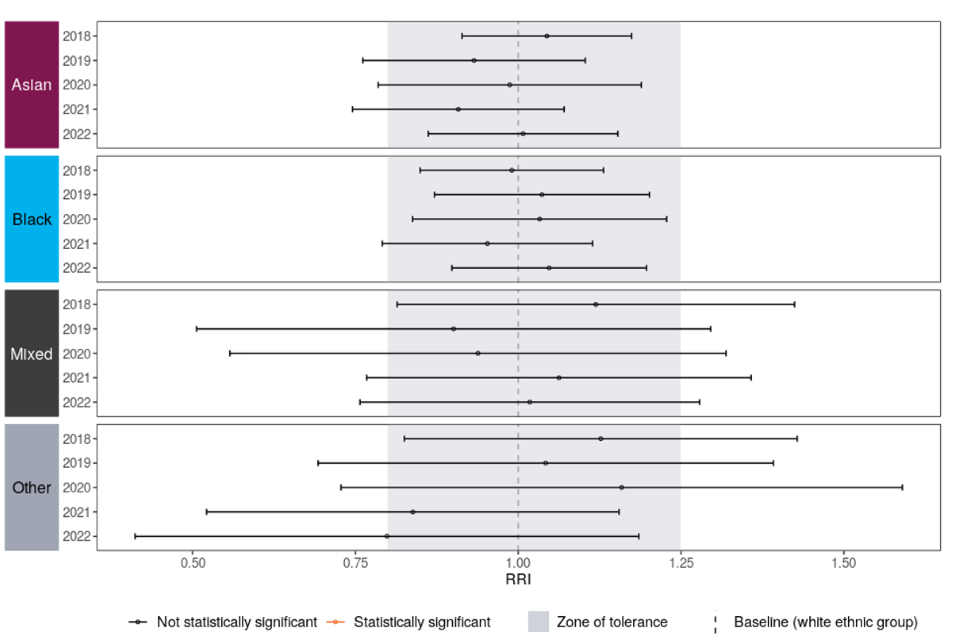
Amongst offenders committing sexual offences, no ethnic groups were significantly more or less likely to be sentenced to custody relative to the white ethnic group.
Drug offences
Figure 9.03: RRI for offenders sentenced to immediate custody per all offenders sentenced for drug offences, 2018-2022, England and Wales.
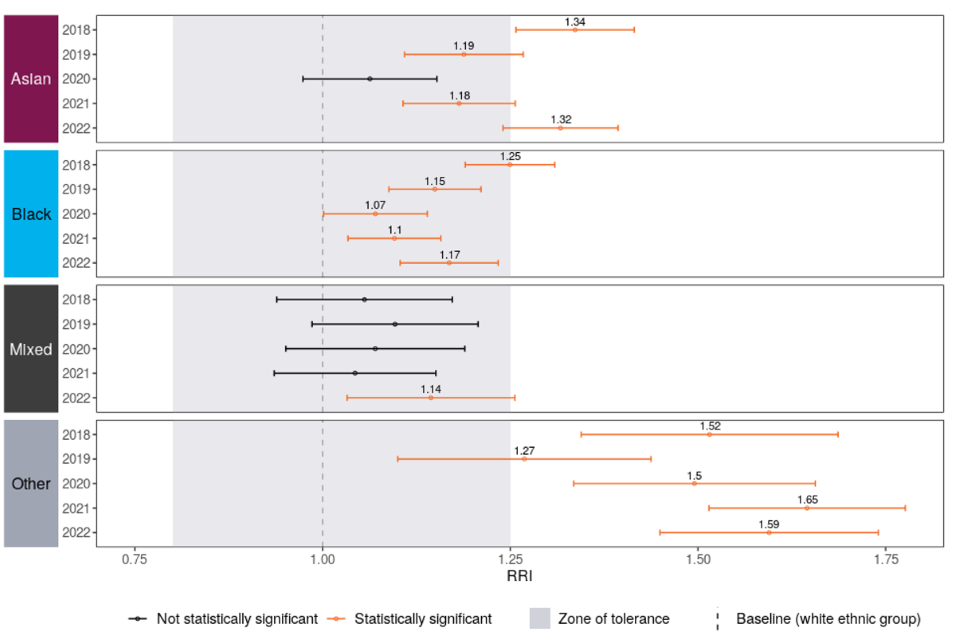
With the exception of 2020, Asian offenders were significantly more likely to receive a custodial sentence for committing drug offences in all other years between 2018-2022. In the latest year, they were 32% more likely, compared to 34% in 2018. However, in 2019 and 2021, the RRI was within the zone of tolerance.
Offenders from the black ethnic group were significantly more likely in all five years, at 17% in 2022, compared to 25% in 2018. Offenders from a mixed ethnic background were 14% more likely in 2022, although they were not significantly more or less likely between 2018-2021.
The largest disparity in custodial sentencing for drug offences was seen for the other ethnic group. They were significantly more likely to receive a custodial sentence in all five years, compared to the white ethnic group. The RRI figures were all outside of the zone of tolerance, with the highest coming in the last two years, at 65% and 59% more likely, respectively.
Conclusion
Although ethnic disparity in custodial sentencing was generally consistent between 2018-2022, the findings varied across offence groups. For example, no ethnic groups were significantly more or less likely to receive a custodial sentence compared to white offenders for sexual offences, however, disparity was seen for offenders committing violence against the person and drug offences. Furthermore, the other ethnic group were significantly more likely than the white ethnic group to receive a custodial sentence for violence against the person offences in 2018 and 2022 only, however, this group were subject to the largest disparity in all five years for drug offences.
It is important to note that sentencing decisions are dependent on various factors and within this RRI analysis, no controls have been applied. Even within specific offence groups, there can be a wide range of offence seriousness and therefore, these findings could potentially reflect variations in the mix of offences across ethnic groups. To achieve a greater understanding of any potential ethnic disparity within sentencing decisions, it would be beneficial to analyse these outcomes whilst controlling for various offender and case characteristics. Therefore, further analysis has been conducted using logistic regression methodology, reported in the following section.
9.2 Logistic Regression
Overview
The aim of this research was two-fold. Firstly, to investigate whether trends in the association between an offender’s ethnicity and receiving a custodial sentence have changed over time. Secondly, to determine whether any ethnic disparity in sentencing decisions is more or less pronounced within specific offence groups.
Previous research, predominantly using data extracted from the Police National Computer (PNC), has shown that offenders of certain ethnicities are more likely to be sentenced to custody. Bhamra & Uhrig (2017)[footnote 166], for example, found that young people of black, Asian and mixed ethnicity were more likely to be sentenced to custody in 2016 compared to young people of white ethnicity, although these results varied over the 2009-2016 time period of the study. This research also found that the association between ethnic group and youth custodial sentencing varied between specific offence groupings. Hopkins (2015)[footnote 167] reported similar findings, although without the specific emphasis on youth offenders, concluding that there was an association between being from an ethnic minority background and being sentenced to prison in 2011. The follow up analysis (Hopkins, Uhrig, & Colahan, 2016)[footnote 168] using 2015 data, found that offenders from self-reported black, Asian, and Chinese or other backgrounds had higher odds of imprisonment than white offenders. This study also reported that the association varied across specific offence groups, with a significant association between ethnicity and custodial sentencing for drug offences, but no effect within the offence groups of acquisitive violence and sexual offences. Similarly, although using data from the Sentencing Council’s Crown Court Sentencing Survey, Isaac (2020)[footnote 169] found that offenders of black, Asian and other ethnicities were more likely to receive a custodial sentence for drug supply offences than white offenders, and that Asian offenders received longer sentences than white offenders for these offences. The RRI analysis above found that although differences in custody rates between ethnic groups were fairly consistent over the last five years, these did vary between offence groups. However, this analysis did not account for any other factors that may have influenced sentencing decisions. Therefore, further analysis of sentencing data, utilising logistic regression, has been conducted to investigate the association between ethnicity and receiving a custodial sentence when controlling for various offender and case characteristics, and whether this varied over a five-year time period (2018-2022). Logistic regression is a widely used and robust method for investigating relationships between different factors and understanding the association between individual factors and an outcome, when other factors are held constant. This analysis also looked into this association within specific offence groups (violence against the person, sexual offences, and drug offences) over the 2018-2022 time period collectively.
In addition to the aforementioned previous research, ongoing projects[footnote 170] as part of the Data First programme[footnote 171] led by the Ministry of Justice and funded by Administrative Data Research UK (ADR UK), include investigations by Dr Kitty Lymperopoulou and Dr Angela Sorsby, exploring similar themes of ethnic disparities in sentencing outcomes. To ensure the uniqueness of this analysis and avoid duplication, deliberate efforts have been made to differentiate the approach in this report, based on the available details of these projects. The analysis in this report has included or focused on the following aspects, in order to differentiate from the Data First projects:
- Examining variation across years, as opposed to solely concentrating on a collective period of time.
- Focusing on findings within specific offence groups, aiming for more targeted findings.
- Controlling for specific offences, aiming for granularity beyond controlling for broader offence groups.
- Inclusion of data from the magistrates’ courts, broadening the scope beyond solely utilising Crown Court data.
Additionally, these Data First projects utilise different datasets to the analysis in this report and therefore have other possibilities, such as the ability to use unique defendant identifiers to calculate the number of previous convictions for an individual and potentially link to other datasets to include additional variables. Whilst there are also similarities between the analysis in this report and the Data First projects, we are considering the option of including this type of analysis in future equalities reports (including in Statistics on Women and the Criminal Justice System), and it is therefore necessary to produce this as an independent piece of work. We welcome feedback on whether this is a useful addition to the report.
Key findings:
- Compared to the white ethnic group, offenders of black and mixed ethnicity were consistently associated with increased odds across all five-years. However, the association was less consistent for the Asian and other ethnic groups over this time period.
- The clearest disparity was seen for drug offences, where offenders from most ethnic minority groups were associated with increased odds.
- The black and mixed ethnic groups were also associated with increased odds of receiving a custodial sentence for violence against the person offences and sexual offences.
- Differences were observed between granular ethnicities within the same aggregated ethnic groupings, highlighting the value of utilising more detailed ethnic breakdowns.
Approach
The dataset used in this analysis was constructed using data from the Court Proceedings Database (CPD), including all offenders[footnote 172] sentenced at magistrates’ court or Crown Court for indictable only or triable-either-way offences between 2018 and 2022, an initial sample size of 930,813. Records with missing information on the court where the offender was sentenced, or for an offender’s ethnicity, sex or age, were excluded, resulting in a sample size of 683,731. 26% of the original sample had an ethnicity recorded as ‘Not stated’.
Ethnicity information included within the analysis is self-identified ethnicity. The quality of ethnicity data available for individuals tried for summary offences is insufficient to justify inclusion, and therefore, this analysis is limited to those sentenced for indictable only or triable-either-way offences (collectively referred to as indictable offences). The analysis was conducted using ethnicity categories based on both the most granular 2011 Census classification (referred to throughout as the 18+1 classification) and the aggregated ethnic groupings (referred to throughout as the 5+1 classification). Please see the technical guide for more information on ethnicity classifications. Ethnic groups that had a volume of records within the dataset, which was deemed too small to remain as a standalone category, were grouped appropriately (see Table 1 for details).
The data used from the CPD is constructed on a principal offence basis, meaning that the information relates to the principal offence for which the defendant was dealt with. When a defendant has been found guilty of two or more offences it is the offence for which the heaviest penalty is imposed. Where the same disposal is imposed for two or more offences, the offence selected is the offence for which the statutory maximum penalty is the most severe. The data is also on a principal disposal basis - i.e. reporting the most severe sentence for the principal offence.
Table 1 summarises the subset of data used for this analysis, showing that offenders of white ethnicity accounted for 79% of the sample, with white British offenders specifically accounting for 72%. Unadjusted custody rates[footnote 173] across the aggregated ethnic groups were relatively similar, ranging between 33% and 35%. However, custody rates did vary within the aggregated ethnic groupings; for example, offenders of Indian ethnicity had a custody rate of 31%, whereas offenders of Pakistani ethnicity were sentenced to custody 39% of the time.
Sentence outcomes can be influenced by various other factors, such as the offence committed. Table 1 also shows that the custody rate across different offence groups varied between 23% and 65%. Therefore, in order to make more robust and meaningful comparisons of the custody rate between offenders of different ethnic backgrounds, it is important to control for these potentially important factors.
Various multivariate logistic regression models were created to explore whether any independent associations were observed between an offender’s ethnicity and being sentenced to custody.
-
Firstly, investigating trends in ethnic disparity over time for all indictable offences, requiring a model for each individual year between 2018-2022, referred to as time-series.
-
Secondly, investigating ethnic disparity within specific offence groups, requiring a model for each offence group of interest, with all sentences for that offence group between 2018-2022 combined.
In addition, each of these models was run separately using 5+1 and 18+1 ethnicity groupings, in order to analyse results at an aggregated (5+1) level and also at a detailed ethnicity (18+1) level. This allowed for any variation within each aggregated ethnic grouping to be identified, which may otherwise be indiscernible when analysing models only including 5+1 ethnicity classification. Additionally, the 18+1 models allow for the white Irish and the any other white background ethnic groups to be compared against the white British group.
Table 1. Descriptive statistics summarising the subset of data extracted from the Court Proceedings Database for this analysis.
| Variable | Value | Number of offenders sentenced | % of sample | % sentenced to custody |
| Ethnicity | Asian | 40,861 | 6% | 35% |
|---|---|---|---|---|
| Bangladeshi | 6,748 | 1% | 32% | |
| Chinese | 650 | 0% | 44% | |
| Indian | 6,471 | 1% | 31% | |
| Pakistani | 14,846 | 2% | 39% | |
| Any other Asian background | 12,146 | 2% | 32% | |
| Black | 69,556 | 10% | 34% | |
| African | 23,242 | 3% | 35% | |
| Caribbean | 22,752 | 3% | 35% | |
| Any other black, black British or Caribbean background | 23,562 | 3% | 34% | |
| Mixed | 23,428 | 3% | 34% | |
| White and Asian | 2,179 | 0% | 34% | |
| White and black African | 2,838 | 0% | 33% | |
| White and black Caribbean | 11,693 | 2% | 36% | |
| Any other mixed or multiple ethnic background | 6,718 | 1% | 32% | |
| White | 540,619 | 79% | 33% | |
| White British | 492,730 | 72% | 33% | |
| White Irish | 6,782 | 1% | 36% | |
| Any other white background* | 41,107 | 6% | 34% | |
| Other | 9,267 | 1% | 35% | |
| Any other ethnic group** | 9,267 | 1% | 35% | |
| Year | 2018 | 157,446 | 23% | 35% |
| 2019 | 151,620 | 22% | 33% | |
| 2020 | 120,167 | 18% | 34% | |
| 2021 | 129,326 | 19% | 33% | |
| 2022 | 125,172 | 18% | 33% | |
| Offence Group | Criminal damage and arson | 6,135 | 1% | 31% |
| Drug offences | 140,416 | 21% | 23% | |
| Fraud offences | 13,158 | 2% | 30% | |
| Miscellaneous crimes against society | 67,439 | 10% | 33% | |
| Possession of weapons | 52,023 | 8% | 34% | |
| Public order offences | 57,851 | 8% | 31% | |
| Robbery | 13,746 | 2% | 65% | |
| Sexual offences | 20,142 | 3% | 59% | |
| Theft offences | 178,842 | 26% | 34% | |
| Violence against the person | 133,979 | 20% | 39% |
‘*’ Includes offenders identifying as ‘Gypsy or Irish Traveller’.
‘**’ Includes offenders identifying as ‘Arab’.
The following variables were used within the models in order to control for these factors and enable the independent association between ethnicity and sentence outcome to be observed:
- Sentence Outcome: binary outcome variable, with the value of either 0 for non-custodial sentence or 1 for custodial sentence.
- Year: year of sentence (only included as a control variable in offence group models, time-series models are split by year).
- Sex: offender characteristic - either ‘Male’ or ‘Female’. Records for non-persons (e.g. companies) or where sex was unknown were excluded from the analysis.
- Age: offender characteristic – under 16’s were grouped together, as were offenders aged 65 or above, all other ages were kept as their original value.
- Ethnicity: offender characteristic – 5+1 ethnic grouping (as discussed above)
- Detailed Ethnicity: offender characteristic – 18+1 ethnic grouping (as discussed above)
- Offence: principal offence committed by the offender. For offences with low sample sizes, these were grouped into general categories within the broader offence groups (e.g. ‘Drug offences – Other’)
- Court: the court where the offender was sentenced (specific courts will not be disclosed in the results of this analysis).
- Plea: the plea entered by the offender. This was either ‘guilty’, ‘not guilty’, ‘not known’, or ‘not applicable’[footnote 174].
The inclusion of these variables within the logistic regression models allowed the associations between ethnicity and receiving a custodial sentence to be examined under similar criminal circumstances. However, these models have not taken into account all factors which could influence sentencing decisions, such as previous offending history, offence motivations, stage of plea or any other associated mitigating and aggravating factors. Additionally, due to exclusions from the sample, the findings are only generalisable to offenders sentenced for indictable offences in England and Wales between 2018 and 2022, where the ethnicity, sex and age of the individual were known.
Results
The logistic regression results are expressed as odds ratios, calculated to quantify the strength of association between the factor and the outcome. An odds ratio greater than 1 indicates increased odds of being sentenced to custody, whereas an odds ratio of less than 1 indicates decreased odds of being sentenced to custody, compared to the reference category[footnote 175]. However, these associations should only be considered and interpreted where statistical significance is met. Statistical significance was assessed at the 0.05 level, expressed as ‘p<0.05’, which means there is at most a five percent likelihood that the result was due to chance. Generally, only results which are statistically significant are reported in this commentary, however, there are instances where a non-significant result is mentioned (for example, where the 18+1 ethnicity model results contrast that of the aggregated 5+1 grouping results).
Although odds ratios are related to probability, it is important not to misinterpret these figures. For example, if an ethnic group has a statistically significant odds ratio of 1.92, this suggests that the odds of receiving a custodial sentence for this ethnic group are approximately 1.92 times higher than the odds for the white ethnic group. This does not mean that this ethnic group are 92% more likely to receive a custodial sentence than the white ethnic group.
To aid interpretation of odds ratios, they were converted into Cohen’s d, a measure of magnitude, and classified as Small (d < 0.2), Medium (0.2 ≤ d < 0.5), or Large (d ≥ 0.5). A statistically significant odds ratio of 1.35 for example, would be considered small, whereas 5.42 would be considered large. These magnitude values are presented only where statistical significance criteria is met.
To add further context to the findings, the logistic regression models are used to calculate a selection of specific predicted probabilities, comparing the likelihood of offenders from each ethnic group receiving a custodial sentence in a specific scenario, when all other factors included in the analysis are the same, referred to as the ‘reference offender’. This means, for an offender of the same age and sex, convicted of the same offence, entering the same plea and being sentenced at the same court, in the same year, the probability of receiving a custodial sentence is X for each ethnic group. The reference offender characteristics were broadly selected based upon the most common factors found in the dataset.
Trends over time - association between an offender’s ethnicity and receiving a custodial sentence, 2018-2022 (model for each year, offenders sentenced for indictable offences)
Tables 2 and 3 show the results for the time-series models, including sentencing for all indictable offences between 2018 and 2022. Over time, the black ethnic group as a whole were consistently associated with increased odds of receiving a custodial sentence, although the magnitude was small. At the detailed 18+1 ethnicity level, all black ethnic groups were associated with increased odds, in all years, with the only exception being the black African ethnic group in 2018 and 2019. The increased odds were highest in 2021 for all black ethnic groups, ranging between 18% and 29%.
Similarly, offenders of mixed ethnicity were consistently associated with higher odds of receiving a custodial sentence over the five-year period, also of small magnitude. At the detailed ethnicity level, although in general the association varied over time, the mixed white and black Caribbean ethnic group were associated with increased odds across all five years, with the highest being at 25% in 2022. The association between being from any other mixed or multiple ethnic background and receiving a custodial sentence was statistically significant since 2020, with increased odds of 24% seen in 2022. The association with increased odds for the white and Asian and white and black African groups was statistically significant in only one of the five years, 2018 and 2021 respectively.
Offenders from any other white background were associated with increased odds of receiving a custodial sentence compared to white British offenders between 2020 and 2022, however, they were associated with decreased odds in 2018 and 2019; these were all of small effect. There was a statistically significant increase in the odds of small magnitude for the white Irish ethnic group between 2020 and 2022.
There was also an inconsistent association for offenders identifying as being from any other ethnic group receiving a custodial sentence. They were associated with increased odds of small magnitude in 2020 and 2022, however, no statistically significant association was observed in other years.
The Asian ethnic group were found to be associated with decreased odds of receiving a custodial sentence in the last 3 years, although the magnitude of this was small at between just 7-10%. At the detailed ethnicity level, the association varied both between Asian ethnic groups and across the five years. For example, offenders of Chinese ethnicity were associated with increased odds of medium effect size in 2018 and 2019, whereas the Indian ethnic group were associated with decreased odds of small magnitude in 2019, 2021 and 2022. The Pakistani ethnic group were associated with increased odds in 2018 but decreased odds in 2020, although the magnitude of both was small. There was no statistically significant difference in the odds of being sentenced to custody for offenders of Bangladeshi or any other Asian background in all five years.
Table 4 shows the predicted probabilities of receiving a custodial sentence for each ethnic group, in each year, based on the reference offender in this time period. In this example, the characteristics of this reference offender were: male, aged 30, pleading guilty, and sentenced at a specific Crown Court for committing the offence of ‘Theft from Shops’. For most ethnic groups, the predicted probability of receiving a custodial sentence in this scenario was lower in 2022 compared to 2018. However, the predicted probabilities vary across ethnic groups, with a difference between the lowest and highest probabilities of between 8 and 11 percentage points across the five-year period. In 2022, those from any other ethnic group were most likely to receive a custodial sentence in this scenario, at 76%, whereas, the Chinese ethnic group were least likely, alongside the mixed white and black African group, at 66%. In contrast, offenders of Chinese ethnicity were most likely to receive a custodial sentence in this scenario in 2018 and 2019, at 80%. The Indian ethnic group were consistently amongst the lowest probabilities across all five years, highlighting the variation that exists even within aggregated ethnic groups.
Table 2. Aggregated ethnicity classification logistic regression model results (by year) for the likelihood of receiving a custodial sentence for indictable offences.
| Ethnicity | 2018 - Odds Ratio | 2018 - Magnitude | 2019 - Odds Ratio | 2019 - Magnitude | 2020 - Odds Ratio | 2020 - Magnitude | 2021 - Odds Ratio | 2021 - Magnitude | 2022 - Odds Ratio | 2022 - Magnitude |
| (White) | ||||||||||
|---|---|---|---|---|---|---|---|---|---|---|
| Asian | 1.05 | 0.96 | 0.91* | S | 0.90* | S | 0.93* | S | ||
| Black | 1.13* | S | 1.14* | S | 1.17* | S | 1.16* | S | 1.14* | S |
| Mixed | 1.13* | S | 1.12* | S | 1.13* | S | 1.19* | S | 1.12* | S |
| Other | 1.13* | S | 0.97 | 1.11 | 1.05 | 1.23* | S |
‘*’ Denotes statistical significance at p < 0.05; Magnitude is shown for statistically significant results only.
Table 3. Detailed ethnicity classification logistic regression model results (by year) for the likelihood of receiving a custodial sentence for indictable offences.
| Ethnicity | 2018 - Odds Ratio | 2018 - Magnitude | 2019 - Odds Ratio | 2019 - Magnitude | 2020 - Odds Ratio | 2020 - Magnitude | 2021 - Odds Ratio | 2021 - Magnitude | 2022 - Odds Ratio | 2022 - Magnitude |
| (White) | ||||||||||
|---|---|---|---|---|---|---|---|---|---|---|
| Bangladeshi | 1.02 | 0.94 | 0.94 | 0.94 | 1.08 | |||||
| Chinese | 1.48* | M | 1.44* | M | 1.21 | 1.07 | 0.80 | |||
| Indian | 0.89 | 0.83* | S | 0.92 | 0.78* | S | 0.81* | S | ||
| Pakistani | 1.12* | S | 0.95 | 0.90* | S | 1.01 | 0.93 | |||
| Any other Asian background | 1.01 | 0.97 | 0.96 | 0.95 | 1.00 | |||||
| African | 1.02 | 1.05 | 1.16* | S | 1.18* | S | 1.14* | S | ||
| Caribbean | 1.13* | S | 1.15* | S | 1.19* | S | 1.21* | S | 1.14* | S |
| Any other black, black British or Caribbean background | 1.17* | S | 1.16* | S | 1.28* | S | 1.29* | S | 1.23* | S |
| White and Asian | 1.27* | S | 1.03 | 0.99 | 1.20 | 0.86 | ||||
| White and black African | 1.14 | 1.14 | 1.18 | 1.39* | S | 0.80 | ||||
| White and black Caribbean | 1.23* | S | 1.19* | S | 1.14* | S | 1.24* | S | 1.25* | S |
| Any other mixed or multiple ethnic background | 0.88 | 0.97 | 1.25* | S | 1.20* | S | 1.24* | S | ||
| White Irish | 1.10 | 0.88 | 1.40* | S | 1.21* | S | 1.17* | S | ||
| Any other white background | 0.89* | S | 0.93* | S | 1.14* | S | 1.34* | S | 1.14* | S |
| Any other ethnic group | 1.11 | 0.96 | 1.14* | S | 1.11 | 1.26* | S |
‘*’ Denotes statistical significance at p < 0.05; Magnitude is shown for statistically significant results only.
Table 4. Predicted probability of receiving a custodial sentence for the reference offender*, by year and ethnicity.
| Ethnicity | 2018 | 2019 | 2020 | 2021 | 2022 |
| Asian | 74% | 72% | 73% | 71% | 70% |
| Black | 76% | 76% | 77% | 76% | 74% |
| Mixed | 76% | 75% | 77% | 76% | 73% |
| White | 73% | 73% | 75% | 73% | 71% |
| Other | 76% | 73% | 76% | 74% | 75% |
| Bangladeshi | 74% | 72% | 73% | 72% | 73% |
| Chinese | 80% | 80% | 78% | 74% | 66% |
| Indian | 71% | 70% | 73% | 68% | 67% |
| Pakistani | 76% | 72% | 72% | 73% | 70% |
| Any other Asian background | 74% | 73% | 74% | 72% | 71% |
| African | 74% | 74% | 77% | 76% | 74% |
| Caribbean | 76% | 76% | 77% | 77% | 74% |
| Any other black, black British or Caribbean background | 76% | 76% | 79% | 78% | 75% |
| White and Asian | 78% | 74% | 74% | 76% | 68% |
| White and black African | 76% | 76% | 77% | 79% | 66% |
| White and black Caribbean | 77% | 77% | 77% | 77% | 75% |
| Any other mixed or multiple ethnic background | 71% | 73% | 78% | 76% | 75% |
| White British | 73% | 73% | 74% | 73% | 71% |
| White Irish | 75% | 71% | 80% | 77% | 74% |
| Any other white background | 71% | 72% | 77% | 78% | 74% |
| Any other ethnic group | 75% | 73% | 77% | 75% | 76% |
‘*’ Male, aged 30, pleading guilty, and sentenced at a specific Crown Court for ‘Theft from Shops’.
Trends across offence groups - association between an offender’s ethnicity and receiving a custodial sentence, by offence group (model for each offence group, offenders sentenced 2018-2022 collectively)
Violence against the person
Tables 5 and 6 shows the results for the offence group models, including sentencing for each offence group of focus, between 2018 and 2022 collectively. For offenders convicted of violence against the person offences, those from the black and mixed ethnic groups were associated with a statistically significant increase, of small magnitude, in odds of receiving a custodial sentence, however, this varied within the detailed ethnic groups. Offenders of black Caribbean and any other black, black British or Caribbean background were associated with increased odds, whereas there was no statistically significant difference in the odds for the black African ethnic group. Similarly, there was a statistically significant association with increased odds for offenders of mixed white and black Caribbean and any other mixed or multiple ethnic background, whereas there was no significant association for the mixed white and Asian and mixed white and black African ethnic groups. The white Irish ethnic group were also associated with increased odds of small effect, whereas the Chinese ethnic group and those from any other white background were associated with decreased odds of being sentenced to custody for violence against the person offences, compared to the white British group.
Table 7 includes the predicted probabilities of receiving a custodial sentence for each ethnic group, derived from the offence group models. In the violence against the person example scenario, the characteristics of the reference offender were: male, aged 22, pleading guilty, committing the offence of ‘Assault of an emergency worker’ and sentenced at a specific Crown Court in 2022. The highest predicted probabilities for this scenario were for offenders of mixed white and black Caribbean (66%), black Caribbean (64%), any other black, black British or Caribbean background (64%) and white Irish (64%). In contrast, the predicted probability for the Chinese ethnic group was 44%.
Sexual offences
For offenders committing sexual offences, the black ethnic group were associated with increased odds of receiving a custodial sentence when compared to the white ethnic group. However, within the aggregated black ethnic group, the black African group were not associated with any difference in odds, whereas offenders of black Caribbean and any other black, black British or Caribbean background were associated increased odds of medium magnitude.
The aggregated mixed ethnic group were also associated with increased odds overall, however this varied greatly within the granular 18+1 ethnic groups. Offenders of mixed white and black Caribbean, or any other mixed or multiple ethnic background were associated with increased odds of medium magnitude, whereas the mixed white and Asian ethnic group were associated with decreased odds of small magnitude.
Offenders of any other white background were also associated with increased odds (21%) of receiving a custodial sentence for sexual offences, compared to the white British cohort.
Table 7 includes the predicted probabilities of receiving a custodial sentence for each ethnic group, derived from the offence group models. In the sexual offences example scenario, the characteristics of the reference offender were: male, aged 22, pleading guilty, committing the offence of ‘Sexual assault on a female’ and sentenced at a specific Crown Court in 2022. Similar to the findings for the assault of an emergency worker scenario, the highest predicted probability for this example were also for offenders of mixed white and black Caribbean ethnicity (67%). Offenders of black Caribbean and any other mixed or multiple ethnic background had a predicted probability of 60% and 61% respectively. In contrast, the predicted probability for the mixed white and Asian ethnic group was 29%.
Drug offences
Of the three offence groups analysed, drug offences highlighted the most disparity between the odds of different ethnic groups receiving a custodial sentence. With the exception of the Indian and mixed white and black African ethnic groups, where no statistically significant differences were found, offenders from all ethnic groups were associated with increased odds compared to the white British group. The magnitude of these increased odds was large for offenders of Chinese, any other white background, and any other ethnic group. The effect was medium for all remaining ethnic groups where statistical significance was observed, except for the Pakistani ethnic group where the increased odds was of small magnitude.
Table 7 includes the predicted probabilities of receiving a custodial sentence for each ethnic group, derived from the offence group models. In the drug offences example scenario, the characteristics of the reference offender were: male, aged 22, pleading guilty, committing the offence of ‘Possession of a controlled drug - Class B (cannabis)’ and sentenced at a specific Crown Court in 2022. Offenders of Chinese ethnicity were most likely to receive a custodial sentence in the scenario (53%), contrasting the findings for the assault of an emergency worker scenario, where the Chinese ethnic group were least likely. Offenders of any other white background were 40% likely to receive a custodial sentence in this situation. The white British ethnic group were least likely (13%), closely followed by the Indian (14%) and mixed white and black African (16%) ethnic groups.
Table 5. Logistic regression model results (by offence group) for the likelihood of receiving a custodial sentence, 2018-2022.
| Ethnicity | Violence against the person - Odds Ratio | Violence against the person - Magnitude | Sexual offences - Odds Ratio | Sexual offences - Magnitude | Drug offences - Odds Ratio | Drug offences - Magnitude |
| (White) | ||||||
|---|---|---|---|---|---|---|
| Asian | 0.99 | 1.02 | 1.17* | S | ||
| Black | 1.17* | S | 1.31* | S | 1.26* | S |
| Mixed | 1.24* | S | 1.37* | S | 1.17* | S |
| Other | 0.95 | 1.23 | 2.15* | M |
‘*’ Denotes statistical significance at p < 0.05; Magnitude is shown only where odds ratio is statistically significant.
Table 6. Logistic regression model results (by offence group) for the likelihood of receiving a custodial sentence, 2018-2022.
| Ethnicity | Violence against the person - Odds Ratio | Violence against the person - Magnitude | Sexual offences - Odds Ratio | Sexual offences - Magnitude | Drug offences - Odds Ratio | Drug offences - Magnitude |
| (White British) | ||||||
|---|---|---|---|---|---|---|
| Bangladeshi | 0.99 | 0.85 | 1.47* | M | ||
| Chinese | 0.56* | S | 1.22 | 7.73* | L | |
| Indian | 0.95 | 1.02 | 1.15 | |||
| Pakistani | 1.08 | 1.29 | 1.41* | S | ||
| Any other Asian background | 0.94 | 0.99 | 1.96* | M | ||
| African | 1.01 | 1.20 | 1.88* | M | ||
| Caribbean | 1.26* | S | 1.68* | M | 1.61* | M |
| Any other black, black British or Caribbean background | 1.23* | S | 1.46* | M | 1.73* | M |
| White and Asian | 0.91 | 0.46* | S | 1.47* | M | |
| White and black African | 1.20 | 1.38 | 1.26 | |||
| White and black Caribbean | 1.35* | S | 2.22* | M | 1.47* | M |
| Any other mixed or multiple ethnic background | 1.20* | S | 1.71* | M | 1.90* | M |
| White Irish | 1.24* | S | 1.58 | 1.42* | M | |
| Any other white background | 0.94* | S | 1.21* | S | 4.54* | L |
| Any other ethnic group | 0.95 | 1.28 | 3.08* | L |
‘*’ Denotes statistical significance at p < 0.05; Magnitude is shown only where odds ratio is statistically significant.
Table 7. Predicted probability of receiving a custodial sentence for a reference offender*, by offence and ethnicity (2018-2022).
| Ethnicity | Assault of an emergency worker | Sexual assault on a female | Possession of a controlled drug - Class B (cannabis) |
| Asian | 59% | 49% | 16% |
|---|---|---|---|
| Black | 63% | 55% | 17% |
| Mixed | 64% | 56% | 16% |
| White | 59% | 48% | 14% |
| Other | 58% | 53% | 25% |
| Bangladeshi | 59% | 43% | 18% |
| Chinese | 44% | 53% | 53% |
| Indian | 58% | 48% | 14% |
| Pakistani | 61% | 54% | 17% |
| Any other Asian background | 57% | 47% | 22% |
| African | 59% | 52% | 22% |
| Caribbean | 64% | 60% | 19% |
| Any other black, black British or Caribbean background | 64% | 57% | 20% |
| White and Asian | 57% | 29% | 18% |
| White and black African | 63% | 56% | 16% |
| White and black Caribbean | 66% | 67% | 18% |
| Any other mixed or multiple ethnic background | 63% | 61% | 22% |
| White British | 59% | 48% | 13% |
| White Irish | 64% | 59% | 17% |
| Any other white background | 57% | 52% | 40% |
| Any other ethnic group | 58% | 54% | 31% |
‘*’ Male, aged 22, pleading guilty, and sentenced at a specific Crown Court in 2022.
Conclusion
This analysis showed that, amongst a large volume of offenders sentenced for indictable offences in England and Wales between 2018-2022, ethnicity was independently associated with receiving a custodial sentence, when as many offender and case characteristics available in the data were held constant.
The black and mixed ethnic groups were consistently associated with increased odds of receiving a custodial sentence compared to white offenders, in all five-years. However, the association was less consistent for the Asian and other ethnic groups over this time period.
When focusing on specific offence groups, the clearest disparity was seen for drug offences, where offenders from all ethnic groups, aside from Indian and mixed white and black African, were associated with increased odds compared to the white British group. The black and mixed ethnic groups were however, also associated with increased odds for violence against the person and sexual offences.
This analysis also highlighted the value of utilising detailed ethnic groupings, otherwise specific findings can be masked when limiting the methodology to only include aggregated groupings. For example, the Asian ethnic group as a whole were found to be associated with increased odds of receiving a custodial sentence for drug offences, although the magnitude was relatively small. Looking further into this using the models based on detailed ethnic groupings, it showed that the magnitude of this disparity was notably higher for offenders of Chinese ethnicity specifically, whereas there was no association found for the Indian ethnic group.
This analysis has not taken into account all factors which could influence sentencing decisions, such as previous offending history, offence motivations, stage of plea or any other associated mitigating and aggravating factors, so it is not possible to discount completely the influence of any factors not included in the analysis. Therefore, the results of this analysis should be regarded as reflective of the broad range of characteristics for which it did control for. Additionally, due to exclusions from the sample, the findings are only generalisable to offenders sentenced for indictable offences in England and Wales between 2018 and 2022, where the ethnicity, sex and age of the individual was known.
As explained throughout this chapter, this analysis was included to enhance this publication, build upon previous research in this area and compliment the valuable on-going projects within the Data First programme focused on this subject matter. This is the first analysis of this type to be included in this publication since the 2016 ‘Race and the criminal justice system’ report. To help determine whether similar analysis is included in future editions of this publication and the Women and the Criminal Justice System publication, feedback is welcomed on the value of this analysis for users and can be directed to CJS_Statistics@justice.gov.uk.
10. Dashboard
A web-based data visualisation tool has been created alongside the report this year, allowing users to view and customise charts based on the published statistics. This dashboard should be seen as a prototype and we hope to continue to develop it for future iterations if there is significant interest. The dashboard should be used as way to discover the data available from the Criminal Justice System and be used a launching point for further investigation. The production team are looking to focus more on the dashboard and reduce commentary within the ECJS bulletin in the future in order to maximise the experience of our users and flexibility of analysis. Feedback on this proposal is welcomed.
Please complete the survey here to contact the team.
11. Further information
11.1 Accredited official statistics status
National Statistics are accredited official statistics that meet the highest standards of trustworthiness, quality and public value. These statistics were awarded accredited official statistics status in January 2011 following an assessment by the Authority’s regulatory arm[footnote 176]. They comply with the standards of trustworthiness, quality and value in the Code of Practice for Statistics and should be labelled as accredited official statistics. It is the Ministry of Justice’s responsibility to maintain compliance with the standards expected for accredited official statistics. If we become concerned about whether these statistics are still meeting the appropriate standards, we will discuss any concerns with the Authority promptly. Accredited official statistics status can be removed at any point when the highest standards are not maintained and reinstated when standards are restored.
11.2 Contacts
Press enquiries should be directed to the Ministry of Justice press office:
Tel: 020 3334 3536
Email: newsdesk@justice.gov.uk
Other enquiries about these statistics should be directed to the Criminal Courts & Sentencing Data and Statistics team in the Data and Analysis unit of the Ministry of Justice:
Email: CJS_Statistics@justice.gov.uk
General information about the official statistics system of the UK is available from:
http://statisticsauthority.gov.uk/about-the-authority/uk-statistical-system
11.3 Feedback
The structure and content of this report is continually being reviewed to reflect user requirements. If you have any feedback about the changes referred to in the introduction, or the report more generally, please contact the production team:
Email: CJS_Statistics@justice.gov.uk
© Crown copyright
Produced by the Ministry of Justice
Alternative formats are available on request from ESD@justice.gov.uk
-
Population data from 2021 Census. ↩
-
Population data from 2021 Census. Prosecutions, convictions, sentence outcomes and remand decisions for indictable offences in 2022. Arrests and stop & search data from 2022/23. Prison population at 30th June 2023. ↩
-
Population data from 2021 Census. Prosecutions, convictions, sentence outcomes and remand decisions for indictable offences in 2022. Prison population at 30th June 2023. ↩
-
More information of ethnic group classifications can be found in the technical guide. ↩
-
Officer identified ethnicity can refer to ethnicity recorded by any third party, such as a police officer, clerk or a member of the data entry team. ↩
-
See technical guide for further details of how detailed ethnicity categorisations are aggregated. ↩
-
See technical guide for concordance in ethnicity reporting between these sources. ↩
-
More information on Relative Rate Index can be found in the technical guide. ↩
-
https://www.judiciary.uk/wp-content/uploads/2020/07/07072020-Amended-Note-on-Listing-Magistrates-re-breaches APPROVED-3.pdf ↩
-
Available at https://osr.statisticsauthority.gov.uk/accredited-official-statistics/ ↩
-
CSEW estimates have been temporarily suspended of their Accredited Official Statistics status, while the data quality is assessed, since the pandemic. For more information, see the Office for Statistics Regulation’s Temporary suspension of National Statistics status for estimates from the Crime Survey for England and Wales note. ↩
-
Police recorded crime data are not accredited official statistics as they are affected by changes in recording practice over time. ↩
-
Data provided by the Home Office listing offences recorded as homicide as of 6th December 2022. ↩
-
As a survey that asks people whether they have experience as a victim of a crime, the CSEW does not cover homicides or crimes where there is no direct victim, such as possession of drugs or motoring offences. ↩
-
Personal crime includes violence, robbery, theft from the person and other theft of personal property excluding fraud and computer misuse. ↩
-
Figures for personal crime exclude fraud and computer misuse as the survey does not ask if these are hate motivated. ↩
-
Unweighted bases for the ‘mixed’ and ‘other’ groups are much lower each year than for other groups. In the year ending March 2023, the unweighted bases for these groups were 433 and 335, respectively. Low unweighted bases will increase the size of confidence intervals around the estimates presented and these figures should therefore be interpreted with caution. ↩
-
Statistical significance between groups over the time series is represented with a ‘*’ ↩
-
Children refer to those aged 10 to 15. The unweighted base for children was considerably lower (1,309) in the most recent year compared to years prior (2,850 in 2018/19, 2,398 in 2019/20). Low unweighted bases will increase the size of confidence intervals around the estimates presented and these figures should therefore be interpreted with caution. ↩
-
Personal crimes include violence, robbery, theft from the person and other theft of personal property; household crimes include domestic burglary, other household theft, vehicle-related theft, bicycle theft and criminal damage. ↩
-
Offences recorded as homicide as at 6 December 2022; figures are subject to revision as cases are dealt with by the police and by the courts, or as further information becomes available. ↩
-
All groups defined by officer-identified ethnicity classification – see technical guide for more information. 4% of homicide victims had ethnicity not known in 2021/22. ↩
-
From 1st April 2021, ethnicity categories were changed on the Homicide Index to be consistent with ONS Census groupings. To enable a time series, ‘Other’ has been grouped to include Asian (Indian sub-continent), Asian, mixed/multiple ethnicities and any other ethnic group. ↩
-
Where ethnicity was known. 4% of homicide victims had ethnicity not known over the period between 2019/20 and 2021/22 ↩
-
Includes police force areas City of London and Metropolitan Police. ↩
-
Excludes London Police Force Areas ↩
-
Where ethnicity was known. 4% of homicide victims had ethnicity not known over the period between 2019/20 and 2021/22 ↩
-
A suspect in a homicide case is defined as either: a person who has been arrested in respect of an offence initially classified as homicide and charged with homicide, including those who were subsequently convicted or a person who is suspected by the police of having committed the offence but is known to have died or committed suicide prior to arrest or being charged. ↩
-
There is only ever one principal suspect per homicide victim. Where there are multiple suspects if any conviction information is available the suspect with the longest sentence or most severe conviction is determined to be the principal suspect. In the absence of any court outcome, the principal suspect is either the person considered by the police to be the most involved in the homicide or the person with the closest relationship to the victim. ↩
-
Instances where there is no current suspect accounted for 26% of all homicides between year ending March 2020 and year ending March 2022, where ethnicity was known. ↩
-
‘Year ending March 2020 includes 39 human trafficking victims who were found dead in a lorry in Essex. The victims were from the other ethnic group which may impact trends across the time series. ↩
-
It is not possible to show separately offences committed in the course of furtherance of a sexual attack as there is often insufficient information available. ↩
-
Data from 2019/20 for the Asian (or Asian British) ethnic group includes people who identify as Chinese. Prior to 2019/20, Chinese arrests are counted within ‘Other Ethnic Group’. Therefore, trends focus on comparisons between 2019/20 and the most recent year. ↩
-
Data for stop and searches is published by Home Office in Stop and search open data tables. Figures for British Transport Police are not included in the totals. ↩
-
Stop and searches under s60 Criminal Justice and Public Order Act 1994 accounted for approximately 1% of all stop and searches (s1 and s60) in the latest year. For more information on stop and search legislation, please see the technical guide. ↩
-
Ethnicity is self-identified, and coverage has improved, at 80% in 2022/23. This may lead to trends driven by the improvement in the proportion of instances where ethnicity is known, so trends should be interpreted with caution. ↩
-
Includes searches under section 1 PACE, section 60 of the Criminal Justice and Public Order Act 1994 and section 47A of the Terrorism Act 2000 (though this power was not used in the year ending March 2023). When a suspect is stopped and searched under s60, the police can search the suspect for offensive weapons or dangerous instruments. For this reason, stop and searches under s60 have been added to the offensive weapons category of s1. ↩
-
Offensive weapons and firearms under s1 PACE. ↩
-
London includes both the Metropolitan and City of London police force areas. ↩
-
Percentages may not sum due to rounding. ↩
-
Excluding ‘unknown link’ and ‘unknown whether article found’. ↩
-
‘No further action’ includes a wide range of scenarios, such as where words of advice would be given, or an individual is detained under section 136 of the Mental Health act. ↩
-
Including cannabis/khat warnings, PNDs, cautions and summons. ↩
-
Stops and searches that do not result in an arrest should not be immediately regarded as a misuse of power. Arrests that result from stop and search may not be linked to the initial reason for the stop and search. ↩
-
When a suspect is stopped and searched under s60 it is so the police can search for offensive weapons or dangerous instruments. To account for the resultant arrests from stop and searches under s60, these have been added to the offensive weapons category of under s1 for the purposes of analysis. ↩
-
The data for this section is available in the Arrests open data tables published by Home Office. ↩
-
Data from 2019/20 for the Asian (or Asian British) ethnic group includes people who identify as Chinese. Prior to 2019/20, Chinese arrests are counted within ‘Other Ethnic Group’. Therefore, trends focus on comparisons between 2019/20 and the most recent year. ↩
-
Ethnicity is self-identified, and the proportion where ethnicity was not stated accounted for 13% of arrests in 2022/23, compared to 15% in 2021/22. This may lead to trends driven by the improvement in the proportion of instances where ethnicity is known, so trends should be interpreted with caution. ↩
-
Offence groups from this chapter are not directly comparable to offence groups from the MoJ Court Proceedings database – see technical guide for further details. ↩
-
Children includes individuals aged up to 17 and adults includes individuals aged 18 and over. ↩
-
Includes City of London and Metropolitan Police forces. ↩
-
Out of court disposals available to the police and CPS in 2022 included: simple and conditional cautions; cannabis and khat warnings; penalty notices for disorder (PNDs); and community resolutions. ↩
-
See technical guide for more information on PNDs. ↩
-
Figures on PNDs exclude cases where ethnicity is not known (26% of PNDs issued in 2022). ↩
-
Figures on cautions exclude cases where ethnicity is not known (8% of all cautions issued in 2022). ↩
-
Summary motoring offences are not considered in relation to cautions or cautioning rates as these tend to be addressed using Fixed Penalty Notices. There is no published data available on Fixed Penalty Notices by sex. ↩
-
Indictable offences are more serious offences that may (if triable-either-way) or must (if indictable only) be passed on to the Crown Court; while summary offences are typically less serious and almost always dealt with entirely in magistrates’ courts. See accompanying technical guide for further details. ↩
-
Caution types include adult conditional caution, adult simple caution, youth caution, youth conditional caution. Criminal Justice Statistics Quarterly have breakdowns by caution type from 2019 onwards. ↩
-
Ethnicity coverage is more complete for triable either way and indictable only offences in courts data. Sections of this chapter that use Criminal Justice System Statistics Quarterly (CJSQ) data are limited to these offences (referred to as indictable) and to defendants aged 10 or over unless otherwise is explicitly stated. Please see technical guide for more information. ↩
-
Indictable offences include indictable-only and triable-either-way offences. Indictable only offences are the most serious and must be tried at the Crown Court; summary offences are the least serious and must be tried at magistrates’ courts; and triable-either-way offences are of intermediate severity and may be tried at either court based on the circumstances of the case. See accompanying technical guide for further details. ↩
-
Where ethnicity is known. 29% of defendants had an unstated ethnicity. ↩
-
The 2021 increase is a consequence of the impact COVID-19 pandemic had on the operation of the Criminal Justice System in 2020. ↩
-
Data underlying the figures in this flowchart is published in the data tools accompanying the MoJ Criminal Justice System statistics publication. ↩
-
Population estimates for 2022 are taken from 2021 census data available at Office for National Statistics Census 2021. ↩
-
The previous criminal histories data for 2022 are taken from First time entrants (FTE) into the Criminal Justice System and Offender Histories: year ending December 2022. Figures are based on indictable offences recorded on the PNC. A range of less serious summary offences, such as TV license evasion and many motoring offences are not recorded on the PNC. Therefore, any figures including summary offences would be an undercount of the true number of cautions and convictions. As such, summary offences have been excluded from this analysis. ↩
-
Where ethnicity is known. 28% of defendants had an unstated ethnicity. ↩
-
Includes City of London and Metropolitan Police forces. ↩
-
Where ethnicity is known. 29% of defendants had an unstated ethnicity. ↩
-
Where ethnicity is known. 27% of defendants in 2022 had an unstated ethnicity. ↩
-
Defendants proceeded against at magistrates’ courts and subsequently committed to the Crown Court will have separate remand decisions made in both courts and will therefore be included twice in the calculation of RRI. A defendant may have a different remand status at Crown Court compared to their status at magistrates’ court. ↩
-
Pre-sentence reports (PSRs) are prepared by the Probation Service to provide information to the court about the offender and any circumstances surrounding the offence, to help decide on a suitable sentence. Data on PSRs relates to those aged 18 or older and all offence types. Statistics on PSRs are published in the probation tables within Offender Management Statistics. ↩
-
Where ethnicity is known. 16% of defendants in 2022 had an unstated ethnicity. ↩
-
Concordance rates are calculated by dividing the number of those who were recommended to receive a sentence disposal and did receive it, by all those who were recommended to receive it. ↩
-
Fast Delivery PSR (oral) – The Criminal Justice Act 2003 removed the requirement for all PSRs to be written. An oral report is usually completed within 24 hours of conviction where a limited amount of information is required by the sentencing court. ↩
-
Standard PSR – A standard delivery (adjourned) PSR is based on a full risk assessment and is suitable for ‘medium’ and ‘high’ seriousness cases and/or where a custody is being considered. ↩
-
Where ethnicity is known. 28% of offenders sentenced in 2022 had a not stated ethnicity. ↩
-
The custody rate is the proportion of all offenders sentenced to immediate custody, out of all offenders sentenced. ↩
-
Further custody rate figures can be found here: https://www.gov.uk/government/statistics/criminal-justice-system-statistics-quarterly-december-2022 ↩ ↩2
-
Where ethnicity is known. 28% of offenders sentenced in 2022 had a not stated ethnicity. ↩
-
The overall increase in ACSL may be due to a change in sentencing guidelines. ↩
-
Where ethnicity is known. 29% of defendants prosecuted for indictable offences in 2022 had a not stated ethnicity. ↩
-
Where ethnicity is known. 28% of defendants committed for trial at Crown Court for indictable offences in 2022 had a not stated ethnicity. ↩
-
Defendants proceeded against at magistrates’ courts and subsequently committed to the Crown Court will have a separate plea recorded at each court and will therefore be included twice in the calculation of rates (if plea is entered/known). A defendant may plead differently at Crown Court compared to their plea at magistrates’ court. ↩
-
Where ethnicity is known. Not stated or unknown accounted for 27-29% of defendants in 2022, across the case management section. ↩
-
The waiting time estimates are a ‘lagged measure’, and defendants are counted at the point of their case being disposed of. As such the waiting time estimates provide a ‘backwards’ look at the durations spent between receipt and main hearing at the Crown Court. ↩
-
See technical guide for further information relating to the impact of COVID-19 on the courts. ↩
-
Where ethnicity is known. 30% of crime lower legal aid clients had an unstated ethnicity. ↩
-
Where ethnicity is known. 25% of crime higher legal aid clients had an unstated ethnicity. ↩
-
Where ethnicity is known. 32% of prison law legal aid clients had an unstated ethnicity. ↩
-
Ethnicity was known for 99.01% of prisoners in England and Wales on 30th June 2023. ↩
-
A determinate sentence is for a fixed period of time and differs from indeterminate sentences that have a minimum fixed period, known as a tariff, that must be served before release is considered by the parole board. ↩
-
45,569 prisoners were released from determinate sentences in 2022, of whom 98.94% were of known ethnicity. ↩
-
Detailed results of the survey can be found in table 6.06 in the tables document published alongside this report. ↩
-
For males, 4,145 white, 722 black, 430 Asian, 430 mixed and 169 prisoners from other ethnic groups completed the questionnaires. For females, the ethnic groups comprised of 344, 18, 17, 35, and 2 respondents respectively. Due to low responses, females from the other ethnic group have been omitted from this commentary. ↩
-
See technical guide for information relating to parole board. ↩
-
Ethnicity was known in 99.79% of oral parole board hearings in the year ending March 2023. Cases where ethnicity was not known have not been included in this commentary. ↩
-
Caution must be taken with interpreting data from the Chinese and Other group as the sample size is very small. ↩
-
Court Orders can contain more than one requirement. ↩
-
Ethnicity was recorded for 92.33% of community orders and 93.68% of suspended sentence orders commenced in 2022. Those where ethnicity was not known/recorded are not included in this commentary. ↩
-
See technical guide for further information relating to the impact of COVID-19 on the courts. ↩
-
The Rehabilitation Activity Requirement was introduced in 2014 under the Offender Rehabilitation Act and requires the offender to attend appointments and participate in activities selected by their responsible officer to support their rehabilitation and reduce reoffending. ↩
-
Ethnicity was recorded for 98.09% of offenders supervised on post-release licence in 2022. Those where ethnicity is not known are not included in this commentary. ↩
-
Indictable offences include indictable-only and triable either-way offences. Indictable offences are more serious offences that may (if triable either-way) or must (if indictable only) be passed on to the Crown Court. ↩
-
Where ethnicity was known. Defendants with unknown or not stated ethnicity accounted for 29% of all indictable prosecutions in 2022. ↩
-
The analysis in this chapter excludes defendants where sex is unknown. Defendants with unknown sex accounted for 4% of all indictable prosecutions in 2022. ↩
-
Where ethnicity was known. Defendants with unknown or not stated ethnicity accounted for 25% of all remanded in custody at magistrates’ courts and 24% of all remanded in custody at the Crown Court for indictable offences in 2022. ↩
-
Remands data in this section are based on the magistrates’ courts’ and on the Crown Court’s decision on whether a defendant prosecuted for a criminal offence, should – during the court proceeding – go on to be placed in custody or released on bail. ↩
-
Where ethnicity was known. Offenders with unknown or not stated ethnicity accounted for 28% of all indictable sentences in 2022. ↩
-
The analysis in this chapter excludes defendants where age is unknown. In 2022, there were 862 prosecutions for indictable offences where the age group was unknown. ↩
-
Where ethnicity was known. Children defendants with unknown or not stated ethnicity accounted for 29% of all indictable prosecutions for children in 2022. ↩
-
Where ethnicity was known. Children defendants with unknown or not stated ethnicity accounted for 28% of all children remanded in custody for indictable offences in 2022. ↩
-
Due to the small population of children from the Asian, mixed, and other ethnic groups, these are subject to greater variance across the years and have therefore been omitted from this comparison. ↩
-
The custody rate is the proportion of all offenders sentenced to immediate custody, out of all sentencing outcomes. ↩
-
Due to the small population of children sentenced to immediate custody from Asian, mixed, and other ethnic groups, trends should be viewed with caution. ↩
-
Figures are based on indictable offences recorded on the PNC. A range of less serious summary offences, such as TV license evasion and many motoring offences are not recorded on the PNC. Therefore, any figures including summary offences would be an undercount of the true number of cautions and convictions. As such, summary offences have been excluded from this analysis. ↩
-
Where there were multiple offences on the same occasion, only the primary offence as recorded on the PNC would be counted. ↩
-
The Police National Computer has a 6+1 ethnicity classification. ↩
-
In this section, other ethnic groups include the following category: Middle Eastern. ↩
-
Where ethnicity was known. Offenders with unknown ethnicity accounted for 4% of indictable offences in 2022. ↩
-
Asian combines the following categories from the published criminal history pivot table for 2022 Q4: Chinese or Japanese or S E Asian, and Asian. ↩
-
White combines the following categories from the published criminal history pivot table for 2022 Q4: White - North European, and White - South European. ↩
-
A long criminal history is defined as 15 or more previous cautions or convictions. ↩
-
Offenders under 18 years of age. The term ‘children’ is being used interchangeably. ↩
-
The figures presented in this section include both indictable and summary offences. ↩
-
Annual cohorts are based on financial years (April to March). ↩
-
As proven reoffences are measured over a one-year follow-up period, and a further six-month waiting period to allow offences to be proven in court, it is worth noting that the waiting period starting from the 2018/2019 offender cohort coincided with operational restrictions following the response to the COVID-19 pandemic. Most recent offender cohorts are still affected by the continued recovery of the courts system, particularly around continued delays in the processing of court cases. ↩
-
This reduction should be viewed with caution, as the 2020/21 offender cohort period overlaps with lockdowns imposed due to the COVID-19 pandemic and a period of on-going recovery for the courts. Police recorded crime data have shown overall reductions in the reporting and recording of many crime types during periods of lockdown. (The first national lockdown was implemented on 23 March 2020 and transitioned to phased reopening until August 2020 - including a limited number of jury trials resuming from 18 May 2020. The second national lockdown was implemented on 5 November 2020 and returned to a three-tier restriction system from 2 December 2020. The third national lockdown was implemented on 6 January 2021 and transitioned to phased reopening until June 2021). ↩
-
April 2020 to March 2021, most recent annual data available. ↩
-
The figures presented in this section include both indictable and summary offences. ↩
-
Equivalently, a Key Stage 4 academic year of 2013/14 and 2014/15; analysis of the attainment data focuses on those cautioned or sentenced for an offence who were at the end of KS4 in the 2013/14 and 2014/15 academic years. Analysis of characteristics such as SEN and FSM are also based on KS4 academic years 2013/14 and 2014/15. ↩
-
The all-pupil population includes both young people who have been cautioned or sentenced for an offence, and those who have not. These figures are a combination of the 2013/14 and 2014/15 statistics. ↩
-
Source: Education, children’s social care and offending: descriptive statistics. ↩
-
Pupils at the end of Key Stage 4 are typically aged 15 and 16. ↩
-
Ethnicity ‘other’ includes Chinese, Japanese, South East Asian and Middle Eastern. ↩
-
Source: Education, children’s social care and offending: Table 1.11.2: Key stage 4 attainment by offending and pupil groups with KS4 academic year of 2013/14. ↩
-
Source: Education, children’s social care and offending: Table 1.11.3: Key stage 4 attainment by offending and pupil groups with KS4 academic year of 2014/15. ↩
-
A young person may be eligible to claim for FSM if they or their family meet certain criteria related to their income and benefits received. ↩
-
From 2014 Education, Health and Care plans were introduced. Under previous legislation pupils could be eligible for Statements of SEN. The period for local authorities to transfer children and young people with Statements of SEN to EHC plans started in September 2014 and ended on 31 March 2018. For the purposes of this analysis, ‘EHC plan’ will be used to describe both Statements of SEN and EHC plans unless stated otherwise in the particular context. ↩
-
Source: Education, children’s social care and offending: Table 1.8.3: Free school meal (FSM) eligibility by offending and pupil groups, with key stage 4 academic year of 2013/14. ↩
-
Source: Education, children’s social care and offending: Table 1.8.4: Free school meal (FSM) eligibility by offending and pupil groups, with key stage 4 academic year of 2014/15 ↩
-
An EHC plan is a document which sets out a child’s SEN and any additional help that the child should receive. A local authority may issue an Education, health and care plan for a pupil who needs more support than is available through SEN support. This will follow a statutory assessment process whereby the local authority considers the pupil’s special educational needs and any relevant health and social care needs; sets out long term outcomes; and specifies provision which will deliver additional support to meet those needs. ↩
-
Source: Education, children’s social care and offending: Table 1.5.3: Special educational needs (SEN) by offending and pupil groups, with key stage 4 academic year of 2013/14 ↩
-
Source: Education, children’s social care and offending: Table 1.5.4: Special educational needs (SEN) by offending and pupil groups, with key stage 4 academic year of 2014/15 ↩
-
SEN support means support that is additional to, or different from, the support generally made for other children of the same age in a school. It is provided for pupils who are identified as having a learning difficulty or a disability that requires extra or different help to that normally provided as part of the school’s usual curriculum offer. A pupil on SEN support will not have an education, health and care plan. ↩
-
Percentages may not sum to 100% due to rounding. ↩
-
Persistent absence is when a pupil enrolment’s overall absence equates to 10 per cent or more of their possible sessions. ↩
-
A permanent exclusion refers to a pupil who is excluded and who will not come back to that school (unless the exclusion is overturned). ↩
-
Suspension refers to a pupil who is excluded from a school for a set period of time. Being suspended can involve a part of the school day and it does not have to be for a continuous period. A pupil may be excluded for one or more suspensions up to a maximum of 45 school days in a single academic year. This total includes exclusions from previous schools covered by the exclusion legislation. ↩
-
Source: Education, children’s social care and offending: Table 1.7.3: Persistent absence by offending and pupil groups, with key stage 4 academic year of 2013/14 ↩
-
Source: Education, children’s social care and offending: Table 1.7.4: Persistent absence by offending and pupil groups, with key stage 4 academic year of 2014/15 ↩
-
Source: Education, children’s social care and offending: Table 1.9.3: School exclusions by offending and pupil groups, with key stage 4 academic year of 2013/14 ↩
-
Source: Education, children’s social care and offending: Table 1.9.4: School exclusions by offending and pupil groups, with key stage 4 academic year of 2014/15 ↩
-
Due to a change in the data collection framework in 2021, practitioners who identify as Chinese are now counted under the “Asian” ethnic group, in line with the 2011 ONS Census classifications. Previously, these practitioners have been counted under the “Chinese or Other ethnic group”. For this reason, comparisons over time for the “Asian” and “Other” ethnic group should be made with caution. This grouping change has been made from 2021 onwards in police, MoJ, magistrates and judiciary data, and for the whole 5-year time series presented in the tables for CPS and HMPPS. ↩
-
In part due to the reclassification of staff who identify as Chinese moving into the Asian ethnic category in 2021. ↩
-
Data are self-declared from HR records, as at 31 March 2022 where ethnicity was known; not including figures from HMPPS. Ethnicity was not stated in 17% of records in 2022. ↩
-
Data is self-declared from HR records, as at 31 December 2022 where ethnicity was stated. These data are based on the ONS headcount specification and may differ from other published figures due to differing specifications. Ethnicity was not stated in 10% of records in 2022. ↩
-
Excludes declarations of ‘prefer not to say’. ↩
-
Data are self-declared from Home Office, as at March 2023 where ethnicity was known, some small discrepancies may result from revisions of data for previous years compared to figures here. Ethnicity was not stated in 3% of records in 2023. ↩
-
Data used in the HMPPS workforce quarterly statistics are self-declared from HR records where ethnicity was known, as at 31 March 2023. Ethnicity was not stated in 16% of records in 2023. ↩
-
Self-declared from HR records reported table ‘3_4_JO_Trends in the Judicial Diversity Statistics, 2023 publication, the quoted figure covers all courts and tribunal judges. ↩
-
Self-declared from HR records reported table ‘3_5_JO_Magistrates’’ in the Judicial Diversity Statistics, 2023 publication; table 3 in Judicial Diversity Statistics 2019. ↩
-
Senior roles are as follows: CPS - Senior Legal Manager and Senior Civil Servant; MoJ – Senior Civil Servant; HMPPS - Senior Civil Servant; Police - Chief Inspector, Superintendent, Chief Superintendent, and Chief Officers; Judiciary – High Court Judges, Heads of Division and Lord Justices of Appeal. ↩
-
Indictable offences include indictable-only and triable-either-way offences. Indictable only offences are the most serious and must be tried at the Crown Court; summary offences are the least serious and must be tried at magistrates’ courts; and triable-either-way offences are of intermediate severity and may be tried at either court based on the circumstances of the case. See accompanying technical guide for further details. ↩
-
Non-custodial sentence outcomes include community sentences, suspended sentences, compensation, fines, absolute discharge, conditional discharge and otherwise dealt with. ↩
-
Throughout this chapter, where the term ‘significantly’ is used in isolation, this should be interpreted as meaning statistically significant. ↩
-
Bhamra, H. S. & Uhrig, N., 2017. Trends in associations between ethnic background and being sentenced to custody for young offenders in England and Wales between 2009 and 2016, Ministry of Justice. Published as part of: Statistics on Race and the Criminal Justice System 2016. ↩
-
Hopkins, K., 2015. Analysis of Ethnicity and Custodial Sentences, Ministry of Justice. Published as part of: Statistics on Race and the Criminal Justice System 2014. ↩
-
Hopkins, K., Uhrig, N. & Colahan, M., 2016. Associations between ethnic background and being sentenced to prison in the Crown Court in England and Wales in 2015, Minstry of Justice. ↩
-
Isaac, A., 2020. Investigating the association between an offender’s sex and ethnicity and the sentence imposed at the Crown Court for drug offences, Sentencing Council for England and Wales. ↩
-
https://www.adruk.org/our-work/browse-all-projects/adr-uk-research-fellows-the-first-users-of-the-data-first-magistrates-and-crown-court-datasets-422/ ↩
-
https://www.gov.uk/guidance/ministry-of-justice-data-first ↩
-
All persons – Companies, public bodies, etc., were excluded. ↩
-
Custody rate when not controlling for any other variables or conditions. ↩
-
A plea value of ‘not applicable’ is for sentence cases at Crown Court, where the plea would have been entered at magistrates’ court, prior to being committed to Crown Court for sentencing. ↩
-
In the aggregated ethnicity models (5+1 classification), the reference category is the white ethnic group. For models using detailed ethnicity (18+1 classification), the reference category is white British. In the results tables, the reference category is provided in parentheses (). ↩
-
Criminal Justice System: Letter of Confirmation as National Statistics – UK Statistics Authority ↩
