Fertiliser usage on farm, England 2022/23 - Statistics Notice
Updated 6 March 2025
Applies to England

© Crown copyright 2025
This publication is licensed under the terms of the Open Government Licence v3.0 except where otherwise stated. To view this licence, visit nationalarchives.gov.uk/doc/open-government-licence/version/3 or write to the Information Policy Team, The National Archives, Kew, London TW9 4DU, or email: psi@nationalarchives.gov.uk.
Where we have identified any third party copyright information you will need to obtain permission from the copyright holders concerned.
This publication is available at https://www.gov.uk/government/statistics/fertiliser-usage-on-farm-england/fertiliser-usage-on-farm-england-202223-statistics-notice
The Farm Business Survey (FBS) has been publishing information on fertiliser application rates since 2015 (with data going back to 2012/13). Throughout this time this publication has gone through several reviews and restructurings; this publication is the first in its current form. Please keep in mind that the British Survey of Fertiliser Practice will continue to be the official source of fertiliser application data. If you have found FBS fertiliser data and this publication useful, we would like to hear from you at fbs.queries@defra.gov.uk
This release presents estimates of fertiliser application rates at farm business level in England, the use of precision farming techniques, soil nutrient software, clover or other legumes in grass swards, green manures, and sources of nutrient planning advice. This release also presents fertiliser application rates by crop economic output of farms.
Results here are presented at the level of the average farm business and can be compared to the financial data published in other Farm Business Survey (FBS) releases. The British Survey of Fertiliser Practice (BSFP) remains the official source of data on fertiliser use in Great Britain, collecting data at field and crop levels and providing detailed breakdowns of the crops that fertilisers are applied too. Section 5.2 has further information on the differences between the BSFP and the fertiliser data collected by FBS. To provide further clarity, this statistical release no longer focuses on the headline application rates, however, this data remains available in the dataset tables.
The full breakdown of results, including machine readable data sets, can be found on the landing page.
These points apply throughout:
- All figures relate to England unless otherwise stated and cover a March to February year with the most recent year shown ending in February 2023. To ensure consistency in harvest/crop year and commonality of subsidies within any one Farm Business Survey year, only farms which have accounting years ending between 31 December and 30 April inclusive are allowed into the survey. Aggregate results are presented in terms of an accounting year ending at end-February, the approximate average of all farms in the Farm Business Survey. Thus the results relate, on average, to March to February years.
- The Farm Business Survey is the source for all data presented in tables and charts unless otherwise stated.
- Due to the small sample sizes and simplification of the datasets dairy, pig, poultry, lowland and Less Favoured Areas (LFA) livestock farms have been combined into one farm type, Livestock.
- The acronym ‘FACTS’ refers to the Fertiliser Advisers Certification and Training Scheme.
- All fertiliser quantities are measured in equivalent kilograms of Nitrogen (N), Phosphate (P2O5) and Potash (K2O), see section 6 for more details.
- The breakdowns shown in each sector were based on the most important predictive variables associated with each measure, as determined by general linear models in the case of fertiliser application rates and recursive partitioning and regression trees in the case of the fertiliser management practices, see section 5.6 for more details.
1 Key results
Fertiliser Practices
- 28% of farm businesses carried out precision farming techniques to guide fertiliser application.
- A third of farms used soil nutrient software packages to help determine fertiliser applications.
- Around a fifth of farms with grass included clover or legumes in their grass swards.
- 18% of farms businesses used green manures in their arable rotations.
- For those farms using either clover or legumes, or green manures, 78% made adjustments to their fertiliser application rates.
- Farmers’ own non-FACTS qualified advice was the main source of nutrient planning advice for 43% of farms, whereas 53% of farms relied on FACTS qualified advice from advisors.
Fertiliser Application Rates
- Farms with higher crop economic output tend to apply higher fertiliser application rates of Nitrogen (N), Phosphate (P2O5) and Potash (K2O).
- Nitrogen application rates were relatively similar between farm types that had similar crop economic outputs per hectare.
2 General Questions
This section details the results of the six questions on fertiliser practices included in the Farm Business Survey.
Farmers were asked:
- If they carry out precision farming techniques.
- If they use soil nutrient software packages to help determine fertiliser applications.
- If they include clover or legumes in grass swards.
- If they use green manures in their arable rotation.
- If they include clover or legumes in grass sward or use green manures, whether they make any adjustment to fertiliser application rates.
- Where they mainly source their nutrient planning advice.
2.1 Precision farming techniques
Precision farming techniques can make processes such as fertiliser application more efficient. Growers must balance the cost of inputs with a demand for higher yields and the pressure of increased environmental awareness and compliance. Precision technology can help to improve the efficiency of farm operations, including cultivation and better targeted fertiliser and agrochemical applications. This can reduce input use (and therefore reduce cost) and improve soil structure.
Figure 2.1: Percentage of farm businesses using precision farming techniques by farm type in England, 2021/22 to 2022/23
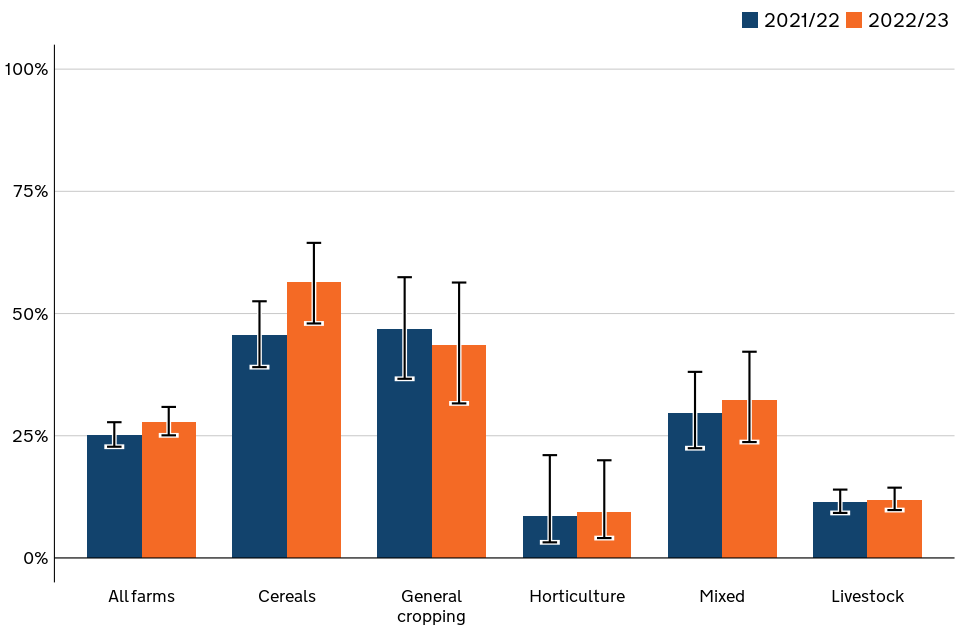
Figure notes:
- This includes farms who do not use any fertilisers and those that do not grow arable crops.
- The legend is presented in the same order as the bars.
- 95% Confidence Intervals have been presented to show the range where the true value is likely to lie and provides an indication of the degree of uncertainty of the estimate; see section 5.7 for more detail.
Figure 2.1 shows that, in 2022/23, 28% of farms used precision farming techniques. This was an increase of 3 percentage points from the previous year.
When broken down by farm type, the main arable farm types - cereal and general cropping farms - were the most frequent users of these techniques in 2022/23 (56% and 44%, respectively). Horticulture and livestock farms had the lowest uptake of precision farming in both 2021/22 and 2022/23. However, general cropping farms were the only farm type where the proportion of farms using precision farming decreased between the two years, falling by 3 percentage points. Conversely, the proportion of cereal farms using precision farming had the highest increase, 11 percentage points.
2.2 Soil nutrient software
Effective nutrient management provides sufficient nutrients to meet the growth requirements of crops and grassland whilst managing environmental impacts. It can help minimise greenhouse gas emissions, reduce the incidence of diffuse water pollution and increase productivity by reducing input costs. There are a variety of tools and sources of advice that farmers can use to assess soil nutrient requirements; bespoke software packages provide one such means.
Figure 2.2: Percentage of farm businesses using soil nutrient software packages to help determine fertiliser applications by farm type in England, 2021/22 to 2022/23
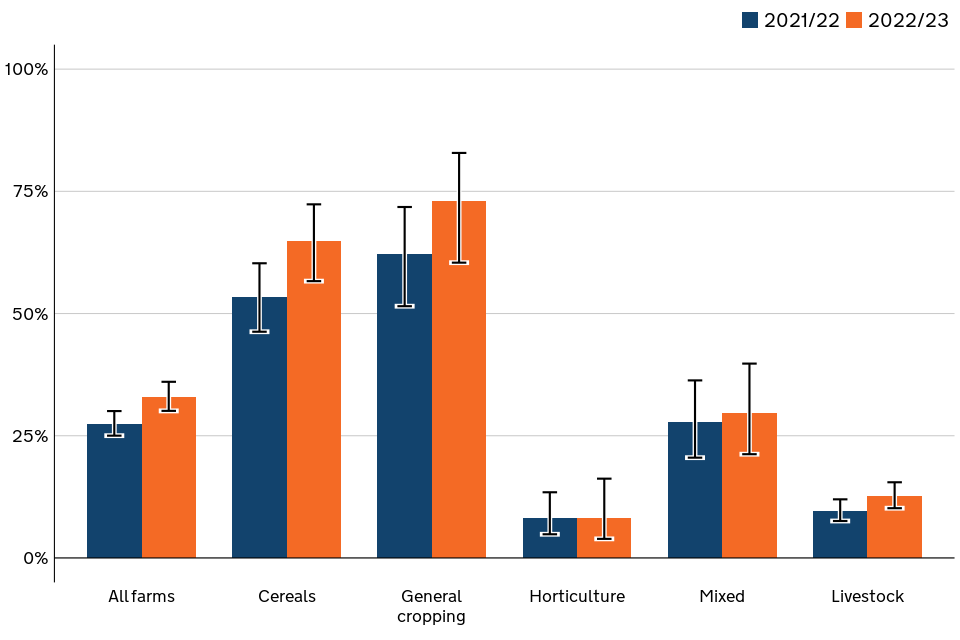
Figure notes:
- This includes farms who do not use any fertilisers and those that do not grow arable crops.
- The legend is presented in the same order as the bars.
- 95% Confidence Intervals have been presented to show the range where the true value is likely to lie and provides an indication of the degree of uncertainty of the estimate; see section 5.7 for more detail.
Figure 2.2 shows that a third (33%) of farms used soil nutrient software packages to help determine fertiliser applications in 2022/23.
Uptake of this practice by farm type showed a similar pattern to that of precision farming techniques. Both cereal and general cropping farms had the highest uptake at 65% and 73% respectively, whilst livestock and horticulture farms had the lowest uptake. Unlike precision farming, soil nutrient software use increased in both cereal and general cropping farms between 2021/22 and 2022/23, increasing by 12 and 11 percentage points respectively. Livestock and mixed farms showed minor increases in usage of the software, while uptake on horticulture farms remained unchanged.
2.3 Clover or other legumes in grass swards
In many situations, sowing grassland with a clover mix or other legumes can be a cost-effective method of increasing production and improving environmental protection. For example, clover’s nitrogen-fixing properties, although not suitable for all soil types, can reduce the amount of nitrogen required and improve grassland yields.
Figure 2.3: Percentage of farm businesses with temporary and/or permanent grass (excluding rough grazing) that include clover or other legumes in grass swards by farm type in England, 2021/22 to 2022/23
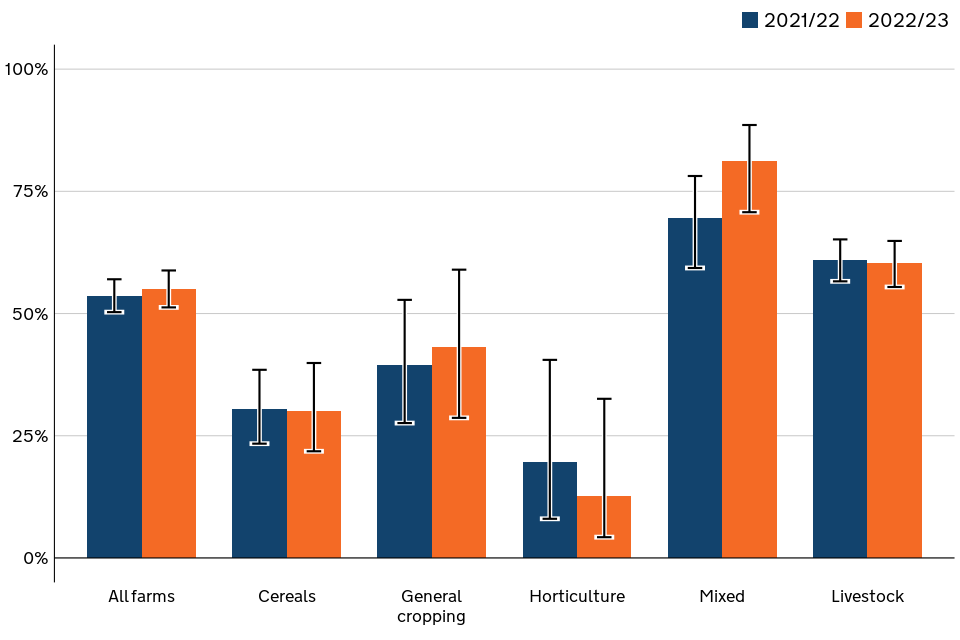
Figure notes:
- This includes farms who do not use any fertilisers and those that do not grow arable crops.
- The legend is presented in the same order as the bars.
- 95% Confidence Intervals have been presented to show the range where the true value is likely to lie and provides an indication of the degree of uncertainty of the estimate; see section 5.7 for more detail.
Figure 2.3 shows that 55% of farms with permanent or temporary grass included clover or other legumes in their grass swards in 2022/23. This management practice occurred most frequently in mixed and livestock farms, at 81% and 60% of these farms respectively. Horticulture farms had the lowest proportion of farms using this practice, at 13%. General cropping, cereals and livestock farms showed little change in their use of clover and legumes in grass swards from 2021/22 to 2022/23, while usage in mixed farms increased by 12 percentage points. Conversely, horticulture farms showed a decrease of 7 percentage points in the same period.
Clover and other legumes being included in grass swards also occurred more frequently in farms whose principal farmer was younger (see section 6 for definition of ‘principal farmer’). Almost three-quarters of farms with a principal farmer under 40 years old used this practice. As principal farmer age increased, use of the practice decreased. The lowest proportion, around half (51%), was seen in farms whose principal farmer was over 65 years old.
2.4 Green manures
Green manures are crops grown specifically for building and maintaining soil fertility and structure, although they may also have other functions such as weed control and preventing leaching of soluble nutrients. They are normally incorporated back into the soil, either directly or after removal and composting.
Figure 2.4: Percentage of farm businesses employing green manures in arable rotation by farm type in England, 2021/22 to 2022/23
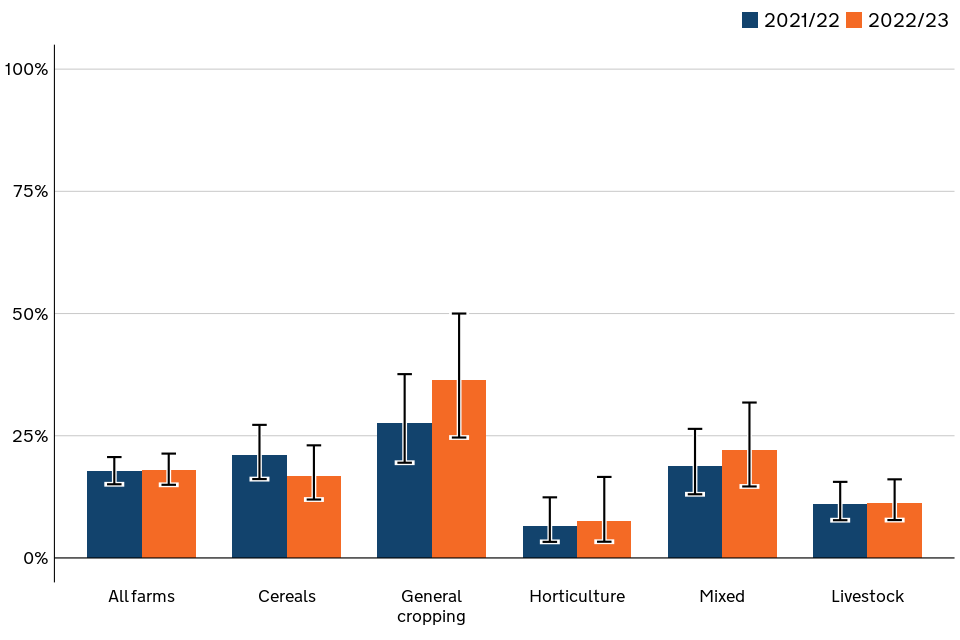
Figure notes:
- This includes farms who do not use any fertilisers and those that do not grow arable crops.
- The legend is presented in the same order as the bars.
- 95% Confidence Intervals have been presented to show the range where the true value is likely to lie and provides an indication of the degree of uncertainty of the estimate; see section 5.7 for more detail.
Figure 2.4 shows that around one in five (18%) farmers used green manures in their arable rotations in 2022/23, indicating no change from the previous year.
In 2022/23, general cropping farms remained the farm type with the highest percentage using green manures, at 36%, an increase of 9 percentage points from 2021/22. Mixed farming also saw an increase in green manure usage, rising by 3 percentage points to 22%. Conversely, usage on cereal farms decreased by 4 percentage points in the same time period. Horticulture farms remained the least frequent users of green manures, at 8%.
2.5 Adjustments to fertiliser applications
Including legumes or clover in grass swards and using green manures are alternative methods to increase the quantities of available nitrogen and reduce the requirement for additional nutrients from fertilisers.
Figure 2.5: Percentage of farm businesses adjusting fertiliser application after using clover/legumes or green manures by farm type in England, 2021/22 to 2022/23
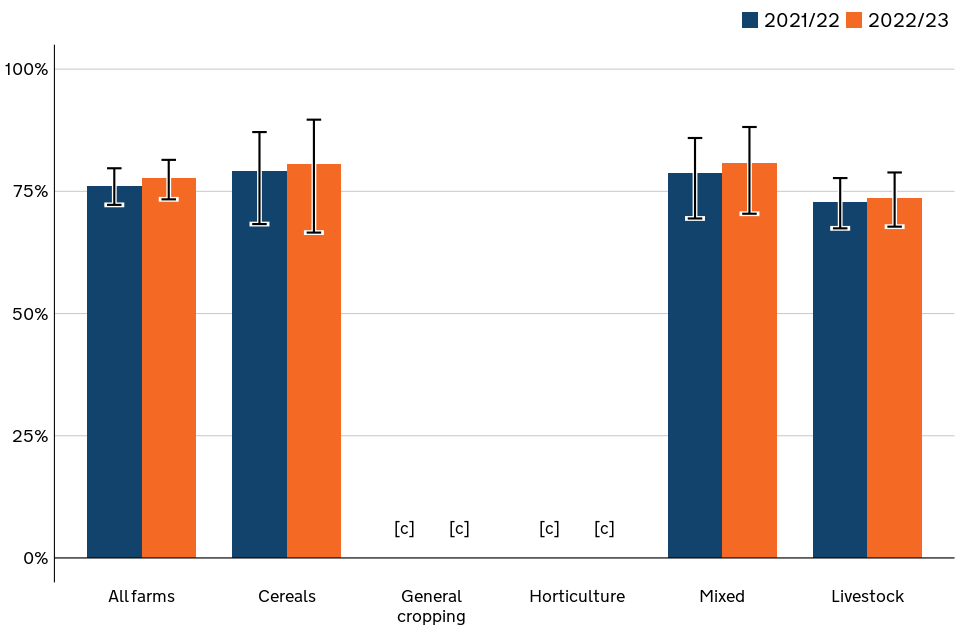
Figure notes:
- This includes farms who do not use any fertilisers and those that do not grow arable crops.
- The legend is presented in the same order as the bars.
- 95% Confidence Intervals have been presented to show the range where the true value is likely to lie and provides an indication of the degree of uncertainty of the estimate; see section 5.7 for more detail.
- The symbol [c] indicates that results have been suppressed due to a small sample size; suppressed values are included in the ‘All farms’ averages.
Figure 2.5 shows that, in 2022/23, 78% of farms adjusted fertiliser application after using clover/legumes or green manures. This rate was similar across cereal, mixed and livestock farms. Additionally, there was little change in this proportion for any of these farm types compared with 2021/22.
2.6 Sources of nutrient planning advice
Some farmers and their advisers may pay greater attention to the calculation of fertiliser application rates, sourcing their advice from qualified individuals so that their application rates match crop requirements. The Fertiliser Advisers Certification and Training Scheme (FACTS) provides training in an evidence-based approach to fertiliser applications.
Figure 2.6: Main source of advice for nutrient planning by farm type in England, 2021/22 to 2022/23
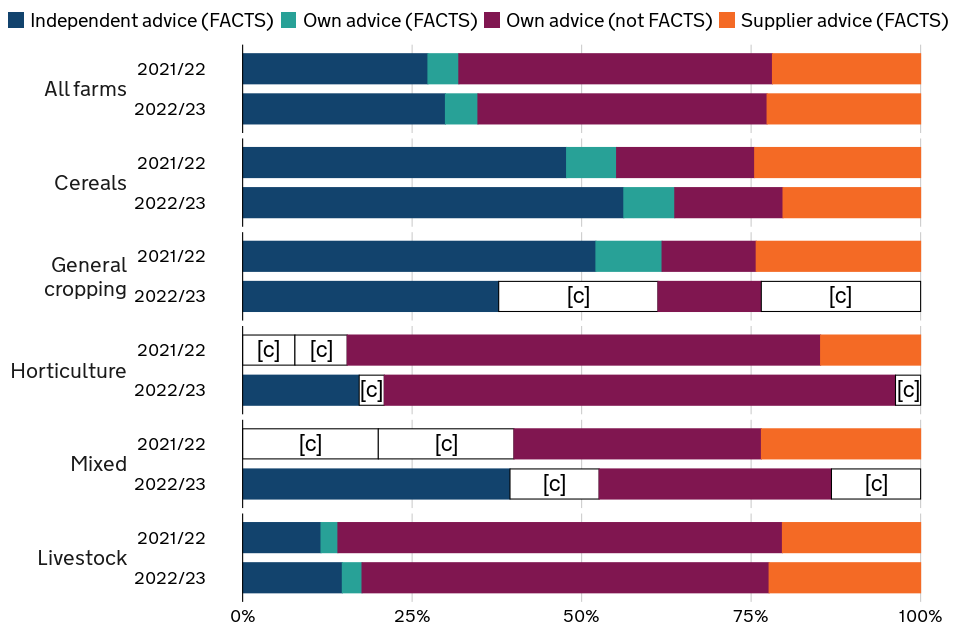
Figure notes:
- This includes farms who do not use any fertilisers and those that do not grow arable crops.
- The legend is presented in the same order as the bars.
- The symbol [c] indicates that results have been suppressed due to a small sample size; the size of the bar does not indicate the suppressed value. Suppressed values are included in the ‘All farms’ averages.
Figure 2.6 shows that there was little change in the main source of nutrient planning advice from the previous year, with the most common being farmers’ own non-FACTS qualified advice, at 46% in 2021/22 and 43% in 2022/23. For nearly half of farm businesses, their main source was FACTS qualified advice from either an independent party or from their fertiliser supplier. The remaining 5% mainly used their own FACTS qualified advice.
The majority of cereal and general cropping farms, at 84% and 85% respectively, sourced their nutrient planning advice from FACTS qualified sources in 2022/23. Conversely, most livestock and horticulture farms relied on their own non-FACTS qualified advice.
3 Fertiliser application rates by crop economic output
This section examines the application rates of Nitrogen (N), Phosphate (P2O5) and Potash (K2O) on farms, split by crop economic output. The quantities of fertiliser were collected for the farm as a whole, rather than at the crop level and are presented per hectare of fertilised area (see section 6 for how fertilised area was calculated).
Organic fertilisers applied to agricultural land may be produced on farm or imported from other sources. Types of organic fertilisers include: livestock products (slurries, farmyard manure (FYM) and poultry manures); treated sewage sludges (also called bio-solids); and some industrial ‘wastes’ such as compost, paper waste or brewery effluent.
Inorganic fertilisers, also referred to as manufactured or chemical fertilisers, have a high concentration of the essential nutrients required for plant growth immediately available for plant use.
The calculation of fertiliser application rates includes those farms which applied no fertiliser in the year but were actively farming. Relatively few horticulture farms apply organic fertilisers, making these estimates subject to a high degree of uncertainty, therefore, they should be treated with caution.
Crop economic output was calculated on a per hectare basis, also using fertilised area and does not included any associated costs (see section 6 for more details on methodology and definition). Crop economic output is presented as banded data. The “Up to £0 per hectare” band represents farms with negative or no crop economic output. Farms in this band either do not grow crops or foraging materials or they have a negative output. Negative output occurs when foraging materials held on farm (such as silage, fodder and grass) loses value.
Weather conditions can influence which crops are grown and the application rates of manufactured fertilisers. For a summary of the 2022/23 weather conditions see Chapter 1: Key Events of the Farm Accounts in England publication. Crop areas on agricultural holdings can be found in the Agricultural land use in England publication.
3.1 Nitrogen (N) by crop economic output
Figure 3.1: Nitrogen (N) application rates per hectare of fertiliser area (kilograms per hectare, kg/ha) and crop economic output (£/ha) by farm type in England, 2022/23
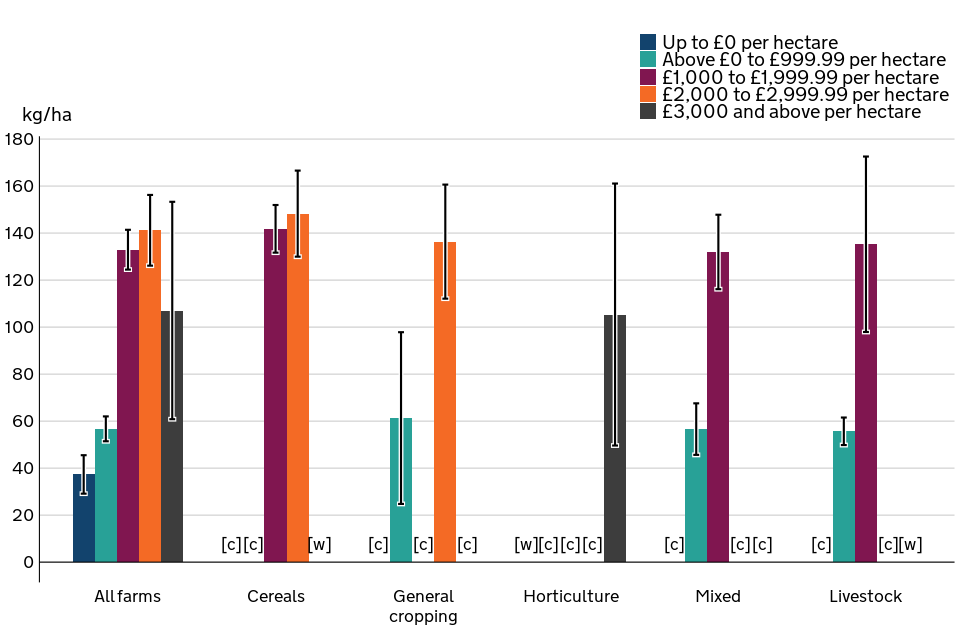
Figure notes:
- This includes farms who do not use any fertilisers and those that do not grow arable crops.
- The legend order, read top to bottom, corresponds with the order of the bars, read left to right.
- 95% Confidence Intervals have been presented to show the range where the true value is likely to lie and provides an indication of the degree of uncertainty of the estimate; see section 5.7 for more detail.
- The symbol [c] indicates that results have been suppressed due to a small sample size; suppressed values are included in the ‘All farms’ averages.
- The symbol [w] indicates that the estimated figure is zero.
In 2022/23, farms with a crop economic output of £2,000 to £2,999.99 per hectare had the highest average nitrogen application rate, at 141 kg/ha. Farms that had negative or no crop economic output had the lowest average nitrogen application rate, at 37 kg/ha. However, it must be emphasised that this is not implying that lower nitrogen application rate is the sole cause of lower economic output. Another explanation could be that lower-value crops, such as forage, generally require less nitrogen to be applied than high-value crops like cereals.
Cereal farms with a crop output of £1,000 to £1,999.99 or £2,000 to £2999.99 per hectare had the highest average nitrogen application rates for both of these output bands, at around 140 and 150 kg/ha respectively. Mixed and livestock farms in the £1,000 to £1,999.99 crop output band both applied nitrogen at similar rates to cereal farms in the same band. Additionally, general cropping farms with crop output of £2,000 to £2,999.99 per hectare had a similar average nitrogen application rate to cereal farms in the same band. This pattern was similarly observed in 2022/23, with the exception being that cereals farms in the £2,000 to £2999.99 per hectare band had a lower nitrogen application rate than cereals farms in the £1,000 to £1,999.99 band.
General cropping, mixed and livestock farms with a positive crop economic output up to £999.99 per hectare all had similar nitrogen application rates, at around 60 kg/ha.
Most horticulture farms had a crop output of at least £3,000 and horticulture farms also made up the bulk of farms within this crop economic output band. They had an average application rate of 105 kg/ha, however, the high confidence interval is a reflection of the high variability of this farm type.
3.2 Phosphate (P2O5) by crop economic output
Figure 3.2: Phosphate (P2O5) application rates per hectare of fertiliser area (kilograms per hectare, kg/ha) and crop economic output band by farm type in England, 2022/23
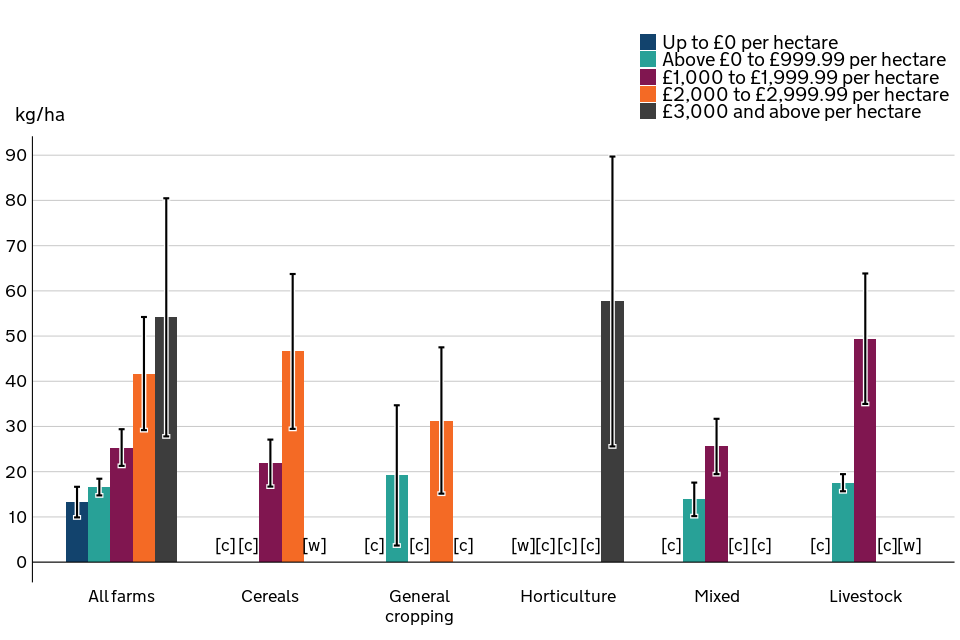
Figure notes:
- This includes farms who do not use any fertilisers and those that do not grow arable crops.
- The legend order, read top to bottom, corresponds with the order of the bars, read left to right.
- 95% Confidence Intervals have been presented to show the range where the true value is likely to lie and provides an indication of the degree of uncertainty of the estimate; see section 5.7 for more detail.
- The symbol [c] indicates that results have been suppressed due to a small sample size; suppressed values are included in the ‘All farms’ averages.
- The symbol [w] indicates that the estimated figure is zero.
Figure 3.2 shows that, in 2022/23, higher crop economic output was associated with higher application rates of phosphate. Farms in the lowest economic output band applied on average 13 kg/ha, while farms with the highest economic output had an average application rate of 54 kg/ha (although variability is high in the top two output bands). As with nitrogen application, it must be emphasised that this is not implying that economic output is solely reliant upon phosphate application rate; lower-value crops may require less phosphate than high-value crops.
In contrast to the similarity in application rates seen in nitrogen, cereal farms saw a stark difference in economic output for farms using different phosphate application rates. Cereal farms with a crop economic output between £1,000 to £1,999.99 per hectare had an average phosphate application of 22 kg/ha, whereas farms in the £2,000 to £2,999.99 band applied 47 kg/ha on average. This differs from 2021/22, where cereals farms with a crop economic output between £1,000 to £1,999.99 per hectare had a higher average phosphate application rate than cereals farms in the £2,000 to £2,999.99 band. General cropping farms in the £2,000 to £2,999.99 band applied phosphate at a lower rate on average, 31 kg/ha, than their cereal farm counterparts.
Livestock farms with a crop output of £1,000 to £1,999.99 per hectare had a much higher application rate on average than mixed and cereal farms in the same band, applying 49 kg/ha. Conversely, general cropping, mixed and livestock farms with a positive crop economic output up to £999.99 had similar phosphate application rates of around 15 to 20 kg/ha.
The highest average application rate, 58 kg/ha, was seen in horticulture farms, which mostly had a crop output of at least £3,000 per hectare. The high confidence interval reflects the high variability of this farm type.
3.3 Potash (K2O) by crop economic output
Figure 3.3: Potash (K2O) application rates per hectare of fertiliser area (kilograms per hectare, kg/ha) and crop economic output band by farm type in England, 2022/23
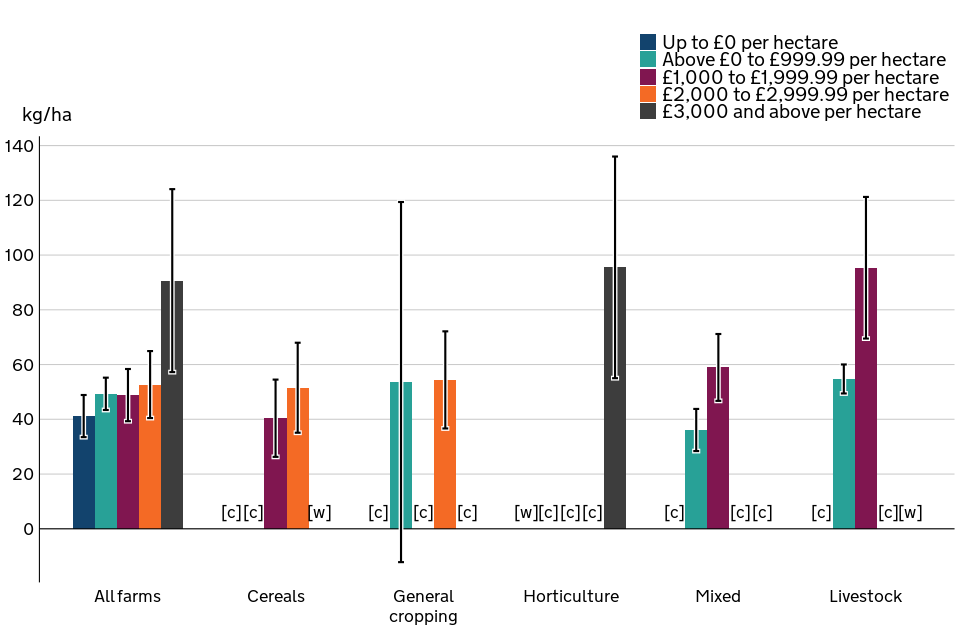
Figure notes:
- This includes farms who do not use any fertilisers and those that do not grow arable crops.
- The legend order, read top to bottom, corresponds with the order of the bars, read left to right.
- 95% Confidence Intervals have been presented to show the range where the true value is likely to lie and provides an indication of the degree of uncertainty of the estimate; see section 5.7 for more detail.
- The symbol [c] indicates that results have been suppressed due to a small sample size; suppressed values are included in the ‘All farms’ averages.
- The symbol [w] indicates that the estimated figure is zero.
Figure 3.3 shows that farms with a crop output of at least £3,000 per hectare had the highest average potash application rate of 91 kg/ha in 2022/23. However, farms across the lower crop economic bands all had similar application rates at the all farm level, averaging between 40 and 55 kg/ha. However, there were differences across farm types, therefore, crop output was likely the result of the inherent value of the crop being grown, rather than being reliant on potash application.
For farms with a crop output of £1,000 to £1,999.99 per hectare, cereal farms applied the least potash on average (40 kg/ha), followed by mixed farms (59 kg/ha), and livestock farms applied the most (95 kg/ha).
Both cereal and general cropping farms with a crop economic output of £2,000 to £2,999.99 per hectare applied around 50 kg/ha of potash on average. For cereal farms, this was 11 kg/ha more than the average applied by farms with a crop output of £1,000 to £1,999.99 per hectare. For general cropping farms, the average application rate of farms with an output of £2,000 to £2,999.99 per hectare was similar to farms which had a positive crop output up to £999.99. However, the lower output band has a relatively high confidence interval due to a combination of high variability and a small sample size.
Horticulture farms mostly had a crop output of at least £3,000 per hectare. However, their average potash application rate, 96 kg/ha, was almost the same as the average applied by the livestock farms which had a crop output of £1,000 to £1,999.99 per hectare.
4 What you need to know about this release
4.1 Contact details
Responsible statistician: Filipe de Jesus Colwell
Public enquiries: fbs.queries@defra.gov.uk
For media queries between 9am and 6pm on weekdays:
Telephone: 0330 041 6560
Email: newsdesk@defra.gov.uk
4.2 National Statistics Status
Accredited official statistics are called National Statistics in the Statistics and Registration Service Act 2007. An explanation can be found on the Office for Statistics Regulation website. Our statistical practice is regulated by the Office for Statistics Regulation (OSR). OSR sets the standards of trustworthiness, quality and value in the Code of Practice for Statistics that all producers of official statistics should adhere to.
These accredited official statistics were independently reviewed by the Office for Statistics Regulation in January 2014. They comply with the standards of trustworthiness, quality and value in the Code of Practice for Statistics and should be labelled ‘accredited official statistics’.
You are welcome to contact us directly with any comments about how we meet these standards (see contact details above). Alternatively, you can contact OSR by emailing regulation@statistics.gov.uk or via the OSR website.
Since the latest review by the Office for Statistics Regulation, we have continued to comply with the Code of Practice for Statistics, and have made the following improvements:
-
Reviewed and improved data presentation to better meet accessibility guidelines
-
Automated production of the statistics using Reproducible Analytical Pipelines (RAP)
-
Reviewed and improved accompanying commentary.
5 Survey details
5.1 Background
Historically, the Farm Business Survey (FBS) has focused on the collection of financial rather than physical data for agricultural inputs. Over recent years attention has turned to agriculture’s environmental footprint and the need to develop a more sustainable industry. Nutrients, particularly nitrogen, are the biggest determinant of yield and have a major impact on crop/sward structure and the quality of the end product.
Nutrient losses to ground and surface waters can cause pollution, affecting biodiversity (e.g. through eutrophication, increased turbidity, fish kills) and the quality of drinking water. Gaseous losses such as ammonia and oxides of nitrogen also cause air pollution and can contribute to the eutrophication of sensitive habitats and to climate change. Any measures taken to reduce nutrient losses should also result in better financial returns to the farmer.
In order to better measure a farm’s environmental footprint one of the most important data gaps to address is the quantity of Nitrogen (N), Phosphate (P2O5) and Potash (K2O) applied as fertiliser. In 2012/13 these quantities were collected for the first time within the FBS. The data collected:
- Provides important data needed to estimate the environmental footprint of farming.
- Enables farms to benchmark their environmental as well as their financial performance.
Data from the Farm Business Survey is widely used by the industry for benchmarking and informing wider research into the economic performance of the agricultural industry, as well as for evaluating and monitoring current policies.
5.2 Differences between the BSFP and FBS fertiliser data
While the British Survey of Fertiliser Practice (BSFP) is Defra’s official source of fertiliser data, fertiliser data are also collected as part of the FBS. It is important to note the differences between the FBS fertiliser estimates presented here with the BSFP, as both surveys are useful for different purposes. Table 5.1 provides a summary of some of the key differences between the two surveys along with when each set of figures should be used.
One of the most important differences comes from their data collection strategies. The BSFP collects data at field level and provides detailed information on fertiliser application rates for individual crops. The FBS collects fertiliser quantities for the farm as a whole, which can be linked to the detailed financial information provided by the FBS.
More recently, the FBS release includes breakdowns of organic fertiliser applications. While the BSFP also publish data on organic fertilisers, it is primarily designed to detail the application of manufactured fertiliser.
Table 5.1 Key differences between the FBS and BSFP
| FBS | BSFP | |
|---|---|---|
| Survey Coverage | England | Great Britain |
| Sample Strategy | Stratified random sampling by combined farm type and farm size groups. Sample size 1,311. | Stratified random sampling by combined farm type, region and crop/grass area groups. Sample size 1,317. |
| Sample Exclusion | Excludes farms with < 25,000 Euros of standard output. | Excludes farms with < 20 hectares of crops/grass. |
| Sampling Units | Farm Business | Farm Holding |
| Fertiliser application rate calculation | Fertiliser application rate is first calculated at the farm business level, by dividing the total fertiliser used by the farm over the year, by the amount of land considered to have been fertilised (fertilised area). The farm business application rate is used to calculate the average application rate across farms in England | The main measure of fertiliser application rate is: Overall application rate = fertiliser nutrient application rate over the sown area of all fields, irrespective of whether they received dressing of that nutrient or not (kg/ha). Also used is Average field rate = fertiliser nutrient application rate over the sown area that received some dressing of that nutrient (kg/ha). Both quantity and area are calculated at a farm level and then raised up individually using a raising factor, so all values are weighted across total area, rather than being the unweighted average of farm level rates. |
| What is collected | Inorganic and organic fertiliser quantities at the farm business level. | Manufactured fertiliser quantities at the field/crop level. |
| What is currently published | Fertiliser applications broken down by high level factors including: farm type, size, region, farm tenancy, farm economic performance, performance by farm type, answer to question in farm practices survey section, by crop economic output and by crop plus livestock economic output per hectare. | Fertiliser application rates broken down by major crop groups, grassland, product types, farm types and region. |
| When to use | Analysing fertiliser quantities by high level factors and linking to financial data in England. | Analysing fertiliser quantities applied to individual crops and for overall figures across Great Britain. |
5.3 Survey content
The Farm Business Survey is an annual survey providing information on the financial position and physical and economic performance of commercial farm businesses in England. It covers all types of farming in all regions of the country with the data being collected by face-to face-interviews with the farmer.
Since 2012/13, the FBS has included an additional module to collect information on fertiliser usage. Completion of the fertiliser module was voluntary until 2017/18 when it became compulsory following a planned, phased introduction.
The information collected within the fertiliser module covered:
- Use of precision farming techniques.
- Use of soil nutrient software packages.
- Inclusion of clover or legumes in grass swards.
- Use of green manures.
- Adjustments to fertiliser application rates.
- Sources of nutrient planning advice (since 2016/17).
- Volumes of nitrogen (N), Phosphate (P2O5) and Potash (K2O) used.
Where information on fertiliser quantities is not directly available from the farmer, estimates have been made based on available information. These estimates are based on further information available from the farmer or calculated based on their expenditure and known usage on other, similar farms. For both inorganic and organic fertiliser, estimates of usage have been made for 21% farms in the sample used in the publication. See the Table 2 in the main dataset on the landing page for a full breakdown by survey year.
The organic fertiliser section of the module was first published in 2020. This section was not published previously due to methodological changes in data collection on poultry farms and a small sample size for pig farms. The methodology has remained the same since 2016/17 and there has been an increase in sample size.
In the case of horticulture farms, application rates describe total levels of nutrients being applied to what might be more than one crop being grown during the year on the same parcel of land, even more so for nurseries and greenhouse farms.
The method for calculating fertiliser application rates has changed for this publication. Previously, fertiliser application rates were calculated using farmed area minus rough grazing area. The fertiliser application rate is now calculated using farmed area minus the areas of rough grazing and uncropped areas; this new definition is called fertilised area. This methodology has been applied to all survey years in this release. Additional methodological changes are described in section 5.4. Due to these methodological changes, application rates will differ compared to previous publications.
The 2022/23 publication also includes two new economic parameters: crop economic output per hectare and crop and livestock output per hectare. These are used to categorise farms into bands based on their output per hectare, therefore providing insight on fertiliser application rates and fertiliser managements practices across farms with different economic outputs. The crop economic output per hectare is calculated using the previously mentioned fertilised area. For crop and livestock output per hectare, another new area classification – production area – is used.
Full details of the information collected on fertiliser usage and other technical notes can be found on the FBS GOV.UK webpage.
5.4 Coherence with previous statistics
Previous publications calculated the fertiliser application rate by determining the total fertiliser applied across all of England and dividing this by the total farmed area, minus rough grazing area, in England. This is effectively equivalent to fertiliser application per hectare of farmland in England.
The current publication first calculates the fertiliser application rate at the farm business level; the total fertiliser used by the farm over the year is divided by fertilised area (farmed area minus the areas of rough grazing uncropped areas). The farm business application rate is then used to calculate the average application rate across farms in England.
The current publication no longer includes a breakdown by organic farming status due to small sample sizes. This publication also no longer includes a breakdown by Nitrogen Vulnerable Zone, as this falls under the purview of the British Survey of Fertiliser Practice (BSFP).
5.5 Weighting
The Farm Business Survey only includes farm businesses with a Standard Output of at least 25 thousand Euros, based on activity recorded in the previous June Survey of Agriculture and Horticulture. In 2022/23 the sample of 1,359 farms represented approximately, 52,500 farm businesses in England.
Initial weights are applied to the FBS records based on the inverse sampling fraction for each design stratum (farm type by farm size). These weights are then adjusted (calibration weighting) so that they can produce unbiased estimators of a number of different target variables.
Initial weights are applied to the Farm Business Survey records based on the inverse sampling fraction for each design stratum (farm type and farm size). Dataset Table 17 within the Farm Accounts in England Dataset shows the distribution of the sample compared with the distribution of businesses from the 2022 June Census of Agriculture and Horticulture. These initial weights are then adjusted, using calibration weighting, so that they can produce unbiased estimates of a number of different target variables. More detailed information about the Farm Business Survey can be found on the technical notes and guidance page. This includes information on the data collected, information on calibration weighting and definitions used within the Farm Business Survey.
Due to the nature of this publication, additional steps were necessary. Where surveyed farms did not take part of the fertiliser module (before 2017/18), they were removed from the sample. Any farms that indicated that fertiliser had been used for non-agricultural activities, as the current method of gathering fertiliser volumes utilised by the farm does not allow us to separate the amount of fertiliser used for agricultural activity and non-agricultural activity, were also removed from the sample. Farms were also excluded in the rare instances where the farm reported that none of its farmland was being used for agricultural activities by the farm itself, e.g. when all land was rented out, or where the total farm area was all categorised as uncropped land, e.g. land that is not being used for agricultural activities. The weights of the farms that remained in were recalculated to maintain the original survey design.
Therefore, this publication is based on the data of 1,311 of the 1,359 farms surveyed in 2022/23. Dataset Table 2 contains a detailed breakdown of the sampling characteristics of the fertiliser publication from 2013/14 to 2022/23.
5.6 Data modelling
Different statistical models were used to help determine the main factors associated with each measure, the results of this models were used to help determine what factors would be discussed in the publication itself, but data from all factors are present in the accompanying datasheets (in all cases where sufficient data was available).
For fertiliser application rates and economic output per hectare, general linear models were used, with the following factors being considered - farm type, farm size, farm tenure, farmer’s age, region, farm economic performance, farm economic performance by farm type and answers to the questions in the fertiliser practice questionnaire. Two general linear models were created for each measure, differing in the method used for model simplification. One was created using a forward stepwise approach and another using backwards stepwise approach. Both were then scrutinised to help determine which factors tend to be common across the different models created for each survey year.
For the responses to the fertiliser practices questions, recursive partitioning and regression trees were used to with the predicted measure being the response to the questions and the determining factors being - farm type, farm size, farm tenure, farmer’s age, region, farm economic performance and farm economic performance by farm type. From each decision tree, the most relevant determining factors were determined.
Results from the models and the decision trees indicate that performance by farm type and farm type were the most common factors that help determine the quantities of fertiliser used and farm fertiliser management practices. Due to limitations in sample size, and objective of maintaining this publication concise only farm type results are presented in the publication itself. All factors can be found in the datasheets at the landing page.
5.7 Accuracy and reliability of the results
It is not logistically feasible to survey the entire population of farms, therefore, the published figures from the Farm Business Survey are subject to sampling error. This is a fundamental premise of conducting statistical surveys, which by design aim to capture a representative sample of the underlying population through various sampling techniques.
The representation of data in this publication attempts to account for this sampling error by providing 95% confidence intervals as a measure of uncertainty for the estimated mean. This is provided as an interval in the tables and through error bars in the bar plots.
Narrower confidence intervals generally reflect larger sample sizes and greater homogeneity within the group and are thus ‘more precise’ of an indicator for where the true population mean may reside. Conversely, wider confidence intervals are generally characterised by smaller sample sizes and greater sample standard deviations, which are thus ‘less precise’. These estimates should be treated with caution.
A confidence interval is therefore a plausible range of values wherein the true underlying population mean lies within, based on the sample data it draws from. A 95% confidence interval hence refers to the interval in which there is a 95% probability that our true population mean resides.
For the Farm Business Survey, the confidence intervals shown are appropriate for comparing groups within the same year only; they should not be used for comparing with previous years, since they do not allow for the fact that many of the same farms will have contributed to the Farm Business Survey in multiple years. Confidence intervals only give an indication of the sampling error; they do not reflect any other sources of survey errors, such as non-response bias.
Percentage changes may not necessarily agree with the difference of their components due to rounding.
5.8 Availability of results
This release contains headline results for each section. The full breakdown of results, by farm type, farm size, region, farm tenure, farmer age, farm economic performance, crop economic output per hectare, crop and livestock economic output per hectare and fertiliser management practices can be found here.
All Defra statistical notices can be viewed on the Statistics at Defra page.
More publications and results from the Farm Business Survey are available on the Farm Business Survey Collection page.
6 Definitions
Crop and livestock economic output per hectare
The ratio of total crop and livestock economic output per hectare of production area.
For the purposes of grouping farms, six economic bands were created:
- Up to £499.99 per hectare
- £500 to £1,499.99 per hectare
- £1,500 to £2,999.99 per hectare
- £3,000 to £4,999.99 per hectare
- £5,000 to £7,499.99 per hectare
- £7,500 and above per hectare
Crop economic output
This corresponds to the total output of the main crops of the current survey year in addition to the total output of forage crops (fodder, silage and grass), and does not consider costs associated to these crops. While the output of main crops can only have a positive output, it is possible for the output of forage crops to have a negative output, this occurs in cases where there have been losses to the value of forage crops.
Crop economic output per hectare
The ratio of total crop economic output, per hectare of fertilised area.
For the purposes of grouping farms, five economic bands were created:
- Up to £0 per hectare
- Above £0 to 999.99 per hectare
- £1,000 to £1,999.99 per hectare
- £2,000 to £2,999.99 per hectare
- £3,000 and above per hectare
Farm economic performance
Economic performance for each farm is measured as the ratio between economic output (mainly sales revenue) and inputs (costs). The inputs for this calculation include an adjustment for unpaid manual labour. The higher the ratio, the higher the economic efficiency and performance. The farms are then ranked and allocated to performance bands based on economic performance percentiles:
- Low performance band - farms who took part in the fertiliser survey and were in the bottom 25% of economic performers.
- Medium performance band - farms who took part in the fertiliser survey and were in the middle 50% of performers.
- High performance band - farms who took part in the fertiliser survey and were in the top 25% of performers.
Farm sizes
Farm sizes are based on the estimated labour requirements for the business, rather than its land area. The farm size bands used within the detailed results tables which accompany this publication are shown in the table below. Standard Labour Requirement (SLR) is defined as the theoretical number of workers required each year to run a business, based on its cropping and livestock activities.
Table 6.1 Standard Labour Requirement (SLR) of each farm size category
| Farm size | Definition |
|---|---|
| Spare & Part time | Less than 1 SLR |
| Small | 1 to less than 2 SLR |
| Medium | 2 to less than 3 SLR |
| Large | 3 to less than 5 SLR |
| Very Large | 5 or more SLR |
Farm type
Where reference is made to the type of farm in this document, this refers to the ‘robust type’, which is a standardised farm classification system.
More information on the classifications of farms in the United Kingdom can be found here.
In this publication, dairy, pig, poultry, lowland and Less Favoured Areas (LFA) livestock farms have been combined into one farm type, Livestock.
Farmed area
Where utilised agricultural area is the area of the farm used for agriculture, farmed area is the area used for agriculture by the farm business. Therefore, it does not include land rented out and does include land rented in. Due to the calculation not including buildings, indoor farms, such as some pig, poultry and dairy farms, will have no farmed area.
Fertilised area
This is a new area classification, designed to measure the extent of farmed area where fertiliser is likely to have been applied. It is the same as farmed area, except it does not include any areas solely used for rough grazing or any uncropped areas. As with farmed area, indoor farms will have no fertilised area. Additionally, farms that only have rough grazing, such as some grazing livestock farms, will also have no fertilised area.
Fertiliser application rates
Fertiliser application rate is first calculated at the farm business level: the total fertiliser used by the farm over the year is divided by the fertilised area of the farm business. Population-level estimates are then generated based on the farm-level application rates. Fertiliser application rates are shown as kilograms per hectare (kg/ha) of fertilised area.
There are some instances where it is not possible to get accurate fertiliser volumes of a farm, in such instances the research officer provides an estimate.
There are many potential chemical forms of fertiliser, therefore, fertiliser quantities are measured in equivalent kilograms of Nitrogen (N), Phosphate (P2O5) and Potash (K2O).
To convert fertiliser quantities reported in this publication into their equivalent elemental form:
Nitrogen: no conversion necessary
Phosphorus: multiply the Phosphate value by 0.436 (for example, 50 kg/ha of Phosphate is equivalent to 21.8 kg/ha of Phosphorus)
Potassium: multiply the Potash value by 0.83 (for example, 50 kg/ha of Potash is equivalent to 41.5 kg/ha of Potassium)
Grass swards
Grass swards are land or soil used to grow grasses or other herbaceous forage.
Inorganic fertilisers
This refers to manufactured fertilisers (also sometimes called chemical fertilisers), that have high concentration of essential nutrients required for plant growth immediately available for plant use.
Livestock economic output
Corresponds to the total output of any livestock related enterprise activity of the current survey year. This does not include any associated costs, but output can be positive or negative, with negative outputs occurring in cases where there has been a loss in the evaluation of the livestock.
Organic fertilisers
Organic fertilisers are distinguished from inorganic fertilisers by having undergone minimal processing, having remained in their natural form and being generally less concentrated than manufactured fertilisers. Types of organic fertilisers include: livestock products (slurries, farmyard manure (FYM) and poultry manures), treated sewage sludges (also called bio-solids) and some industrial ‘wastes’ such as compost, paper waste or brewery effluent.
Principal farmer
The principal farmer refers to the farmer who is primarily responsible for the management and operation of the farm. In cases where two or more farmers share these responsibilities equally, the principal farmer is the one who was interviewed for the survey.
Production area
This is a new area classification, designed to determine the area of a farm that could contribute to the production of crops and/or livestock in a farm business. This differs from farmed area by including building area, therefore indoor farms will have a production area. It also excludes any uncropped areas, as these areas are not used for crop or livestock production.
Utilised Agricultural Area (UAA)
Utilised Agricultural Area (UAA) is the crop area, including fodder, set-aside land, temporary and permanent grass and rough grazing in sole occupation (but not shared rough grazing) i.e. the agricultural area of the farm. It includes bare land and forage let out for less than one year.