Firearm and shotgun certificates in England and Wales: financial year ending March 2017
Published 6 July 2017
Applies to England and Wales
1. Introduction
This release presents statistics on firearm and shotgun certificates issued by police forces in England and Wales under the Firearms Acts 1968-1997. It covers certificates on issue as at 31 March 2017, as well as historical trend data and police force comparisons. The release also provides information on certificates granted and refused for new and renewal applications, certificates revoked, registered firearm dealers, visitors’ permits, European firearm passes (EFP) and Article 7 Authorities issued.
Following user feedback and a number of recent data requests last year, this release contains ‘experimental statistics’. These statistics, found in section 8 of this publication, are still in the testing phase and have not been fully developed as yet.
These experimental statistics should be treated with caution as they are still being developed and have not been subjected to the same levels of quality assurance checks as the other figures in this publication. As the Home Office continues to report on these figures in future years, it will aim to develop its quality assurance procedures further, with a view to increasing confidence in the quality of the data and being able to publish them as Official or National Statistics.
The statistics in this release were extracted from the National Firearms Licensing Management System (NFLMS) which is a register of all people who have applied for, or have been granted, a certificate to possess or acquire a firearm or shotgun. The system is continually updated as a live operational database so these statistics are a snapshot of a point in time.
The user guide provides additional information on this release. It includes the coverage of the data, a glossary of terms and information on the conventions used in the statistics, legislation and regulations.
No force made revisions to any of their data for previous years. The data for the latest year (and for previous years) may be revised in due course. It is standard practice across all Home Office statistical releases to incorporate revisions for previous years’ data in the latest release. Corrections and revisions follow the Home Office corporate revisions policy.
2. Headline figures
Data extracted from the NFLMS on firearm and shotgun certificates issued by police forces in England and Wales show that:
2.1 Firearm certificates
- there were 154,958 firearm certificates as at 31 March 2017; an increase of 1% (1,554) compared with the previous year
- there were 559,302 firearms (covered by firearm certificates) as at 31 March 2017; an increase of 4% (20,108) compared with the previous year
- there were 9,825 new applications for firearm certificates in the year to 31 March 2017, of which 98% (9,620) were granted and 2% (205) were refused
- a total of 358 firearms certificates were revoked in the year to 31 March 2017; a decrease of 10% (-38) compared with the previous year
2.2 Shotgun certificates
- there were 561,413 shotgun certificates as at 31 March 2017; a decrease of 1% (-5,602) compared with the previous year
- there were 1,349,099 shotguns (covered by shotgun certificates) as at 31 March 2017; an increase of 1% (17,536) compared with the previous year
- there were 23,718 new applications for shotgun certificates in the year to 31 March 2017, 98% (23,128) were granted and 2% (590) were refused
- a total of 1,216 shotgun certificates were revoked in the year to 31 March 2017; a decrease of 10% (-133) compared with the previous year
2.3 Experimental statistics (as at 31 March 2017)
- 580,658 people held a firearm certificate and or a shotgun certificate; a decrease of 1% (-7,023) compared with the previous year
- 154,767 people held a firearm certificate; an increase of 1% (1,599) compared with the previous year
- 559,849 people held a shotgun certificate; a decrease of 1% (-6,236) compared with the previous year
- of the 559,302 firearms covered by firearm certificates, 30% (166,638) were sound moderators [footnote 1]
3. Firearm certificates
3.1 Number of firearm certificates and firearms covered by such certificates
There were 154,958 firearm certificates as at 31 March 2017, an increase of 1% (1,554) compared with the previous year (153,404) and the highest number of firearm certificates since 1988 (155,400).
Police forces with the highest number of firearm certificates as at 31 March 2017 were Devon and Cornwall (11,144), Sussex (6,934) and North Yorkshire (6,734). Police forces with the lowest number were City of London (3), Merseyside (1,029) and Cleveland (1,125).
There were 559,302 firearms (covered by firearm certificates) as at 31 March 2017 representing an increase of 4% (20,108) compared with the previous year.
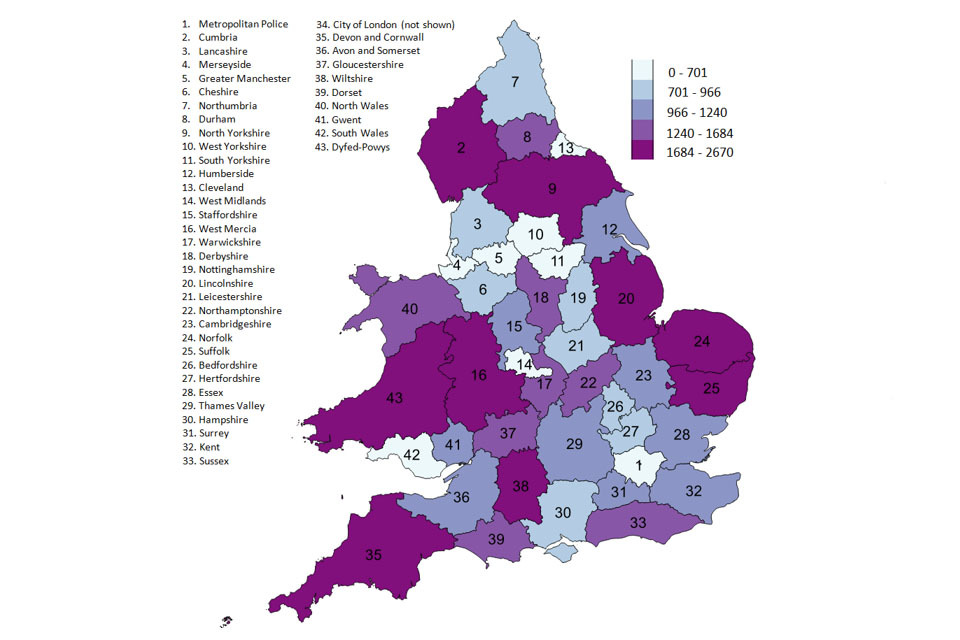
The number of firearms per 100,000 people [footnote 2] as at 31 March 2017 (excluding City of London as its mid-2015 population estimate is less than 100,000) was highest in North Yorkshire (2,670), Dyfed-Powys (2,434) and Cumbria (2,344). This corresponds with police forces with the highest number of firearms/shotguns per 100,000 people tending to be in more rural areas, where the population is often lower and firearms/shotguns are more frequently used for employment (for example gamekeeping and farming) and leisure activities (for example target shooting and game shooting). Police forces with the lowest number of firearms per 100,000 people (excluding City of London) were The Metropolitan Police Service (207), West Midlands (314) and Merseyside (331).
The average number of firearms per certificate as at 31 March 2017 was 3.6; an increase of 0.1 compared with the previous year.
Figure 1: Firearms per 100,000 people by police force area as at 31 March 2017, England and Wales

The chart shows the number of firearms per 100,000 people in a heat map as at 31 March 2017, England and Wales. The data are available in Table 2.
Chart notes
- City of London is not included as its mid-2015 population estimate is less than 100,000. Source: Home Office, Firearm and shotgun certificates in England and Wales, financial year ending 31 March 2017, table 2.
Figure 2: Firearm certificates as at 31 March 2008 to 2017, England and Wales

The chart shows the number of firearm certificates as at 31 March 2008 to 2017, England and Wales. The data are available in Table 1.
Chart notes
Source: Home Office, Firearm and shotgun certificates in England and Wales, financial year ending 31 March 2017, table 1.
3.2 New applications, renewals and revocations
There were 9,825 new applications for firearm certificates in the year to 31 March 2017, of which 2% (205) were refused. This compares with 2% (221) which were refused in the previous year.
Of the 9,825 new applications, 9,620 new firearm certificates were granted in the year to 31 March 2017 representing an increase of 0.9% (86) compared with the previous year.
There were 32,023 firearm certificate renewal applications in the year to 31 March 2017, of which almost all (31,960), were granted and just 0.2% (63) were refused.
Firearm certificates can be revoked if, for example, the chief police officer for the force concerned is satisfied that the holder can no longer be entrusted with firearms in accordance with the Firearms Act 1968. In the year to 31 March 2017, 358 firearm certificates were revoked, a decrease of 10% (-38) from 396 in the previous year.
4. Shotgun certificates
4.1 Number of shotgun certificates and shotguns covered by such certificates
There were 561,413 shotgun certificates as at 31 March 2017, a decrease of 1% (-5,602) compared with the previous year (567,015). The most recent peak as at 31 March 2014 (582,923) was the highest number of shotgun certificates since 31 December 2000 (602,500).
Police forces with the highest number of shotgun certificates as at 31 March 2017 were Devon and Cornwall (30,824), Thames Valley (26,291) and The Metropolitan Police Service (26,050). Police forces with the lowest number were City of London (29), Cleveland (2,749) and Merseyside (3,516).
There were 1,349,099 shotguns (covered by shotgun certificates) as at 31 March 2017 representing an increase of 1% (17,536) compared with the previous year.
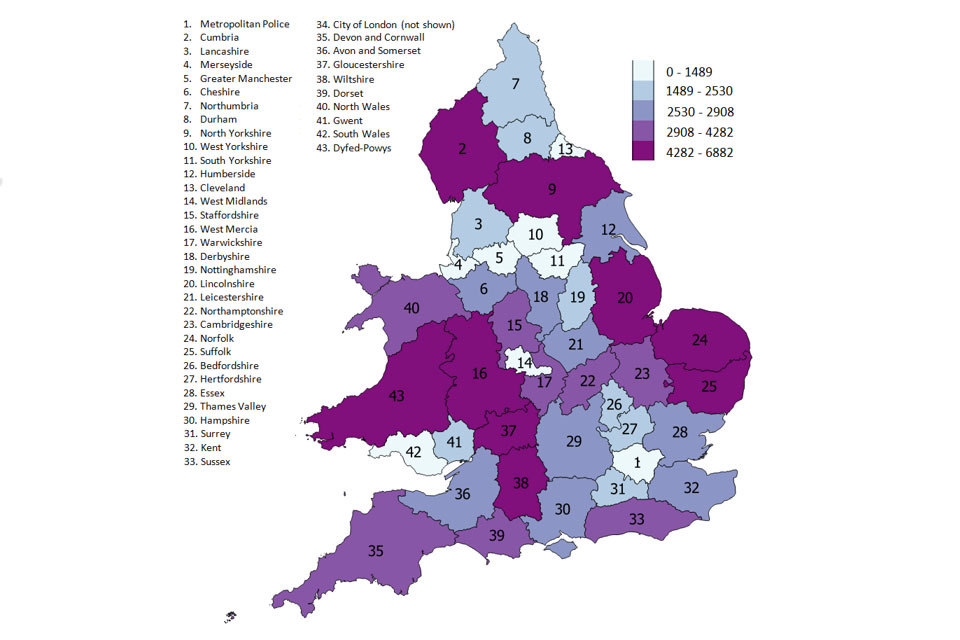
The number of shotguns per 100,000 people [footnote 2] as at 31 March 2017 (excluding City of London as its population estimate is less than 100,000) was highest in Dyfed-Powys (6,882), Norfolk (6,511) and Suffolk (5,826). This corresponds with police forces with the highest number of firearms/shotguns per 100,000 people tending to be in the more rural areas, where the population is often lower and firearms/shotguns are more frequently used for employment (for example game keeping and farming) and leisure activities (for example clay shooting and game shooting). Police forces with the lowest number of shotguns per 100,000 people (excluding City of London) were Merseyside (557), The Metropolitan Police Service (570), and Greater Manchester (643).
The average number of shotguns per certificate as at 31 March 2017 was 2.4; an increase of 0.1 compared with the previous year.
Figure 3: Shotguns per 100,000 people by police force area as at 31 March 2017, England and Wales

The chart shows the number of shotguns per 100,000 people in a heat map as at 31 March 2017, England and Wales. The data are available in Table 4.
Chart notes
- City of London is not included as its mid-2015 population estimate is less than 100,000. Source: Home Office, Firearm and shotgun certificates in England and Wales, financial year ending 31 March 2017, table 4.
Figure 4: Shotgun certificates, as at 31 March 2008 to 2017, England and Wales

The chart shows the number of shotgun certificates as at 31 March 2008 to 2017, England and Wales. The data are available in Table 3.
Chart notes
Source: Home Office, Firearm and shotgun certificates in England and Wales, financial year ending 31 March 2017, table 3.
4.2 New applications, renewals and revocations
There were 23,718 new applications for shotgun certificates in the year to 31 March 2017, of which 2% (590) were refused. This compares with 3% (712) which were refused in the previous year.
Of the 23,718 new applications, 23,128 new shotgun certificates were granted in the year to 31 March 2017 representing an increase of 6% (1,244) compared with the previous year.
There were 99,403 shotgun certificate renewal applications in the year to 31 March 2017, of which almost all (99,205), were granted and 0.2% (198) were refused.
Shotgun certificates can be revoked if, for example the chief police officer for the force concerned is satisfied that the holder can no longer be entrusted with shotguns, in accordance with the Firearms Act 1968. In the year to 31 March 2017, 1,216 shotgun certificates were revoked, a decrease of 10% (-133) from 1,349 in the previous year.
5. Firearm dealers
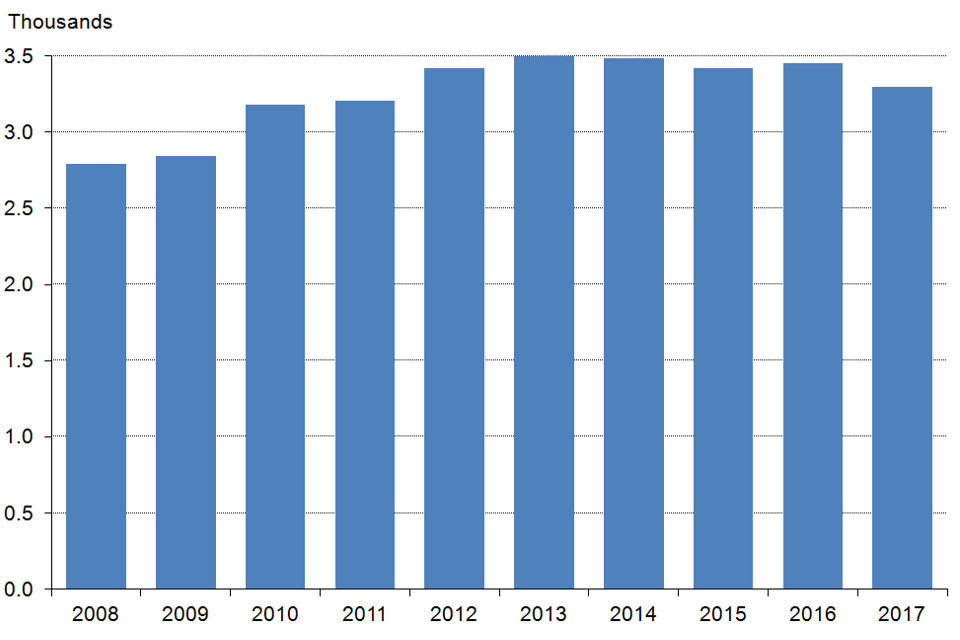
There were 3,299 registered firearm dealers in England and Wales as at 31 March 2017. This represents a decrease of 4% (-153) compared with the previous year.
5.1 Figure 5: Registered firearm dealers as at 31 March 2008 to 2017, England and Wales

The chart shows the number of registered firearm dealers as at 31 March 2008 to 2017, England and Wales. The data are available in Table 6.
5.2 Chart notes
Source: Home Office, Firearm and shotgun certificates in England and Wales, financial year ending 31 March 2017, table 6.
6. Visitors’ permits
Visitors’ permits allow visitors to England and Wales to possess a firearm, shotgun or ammunition without holding a firearm or shotgun certificate. Permits are in force for a period not exceeding 12 months.
In the year to 31 March 2017, 1,860 people were covered by individual or group visitors’ permits for firearms representing an increase of 8% (142) compared with the previous year. There were 7,193 people covered by individual or group visitors’ permits for shotguns representing an increase of 1% (102) compared with the previous year. However, the number of people covered by individual or group visitors’ permits for firearms and shotguns fell back after the 2012 London Olympic and Paralympic games and has since remained stable at similar levels to 2009 and 2010.
6.1 Figure 6: Visitors’ permits, year to 31 March 2008 to 2017, England and Wales

The chart shows the number of visitors’ permits, year to 31 March 2008 to 2017, England and Wales. The data are available in Table 8.
6.2 Chart notes
Source: Home Office, Firearm and shotgun certificates in England and Wales, financial year ending 31 March 2017, table 8.
7. European firearms passes and Article 7 Authorities
The European Firearms Pass (EFP) is a firearms passport for European Union (EU) residents intending to take their firearm or shotgun to another EU state. Article 7 of the Weapons Directive requires any EU resident wanting to purchase certain types of firearms, or ammunition for such firearms, outside their state of residence to have the prior authority of their own state.
As at 31 March 2017, 15,519 EFPs were on issue in England and Wales representing a decrease of 1% (-158) compared with the previous year.
There were no applications by firearm and shotgun certificate holders for Article 7 Authorities in the year to 31 March 2017, compared with 8 in the previous year.
8. Experimental statistics
8.1 Introduction
Following user feedback and a number of data requests last year, this section provides ‘experimental statistics’ that are in the testing phase and which have not been fully developed as yet.
The section includes experimental statistics on:
The number of people who hold a firearm certificate and or shotgun certificate broken down by age and gender. These figures were extracted from the NFLMS on 31 March 2017. The figures provide information on the actual number of firearm and or shotgun certificate holders.
The breakdown of firearm and shotgun types. Firearms can be categorised as rifles [footnote 3], handguns [footnote 4], muzzle-loading handguns [footnote 5], Section 1 shotguns [footnote 6], and other firearm types. Shotguns can be categorised as Section 2 shotguns [footnote 7] and other shotgun types.
Sound moderators [footnote 1]. This is to add greater context to the statistics and to highlight that not all firearms classified as such discharge ammunition. The firearm and shotgun type breakdown and sound moderator figures were also extracted from the NFLMS on 31 March 2017
These statistics should be treated with caution as they are still being developed and have not been subjected to the same levels of quality assurance checks as the other figures in this publication. As the Home Office continues to report on these new figures in future years, it will aim to develop its quality assurance procedures, with a view to increasing confidence in the quality of the data.
8.2 People who held a firearm and or shotgun certificate
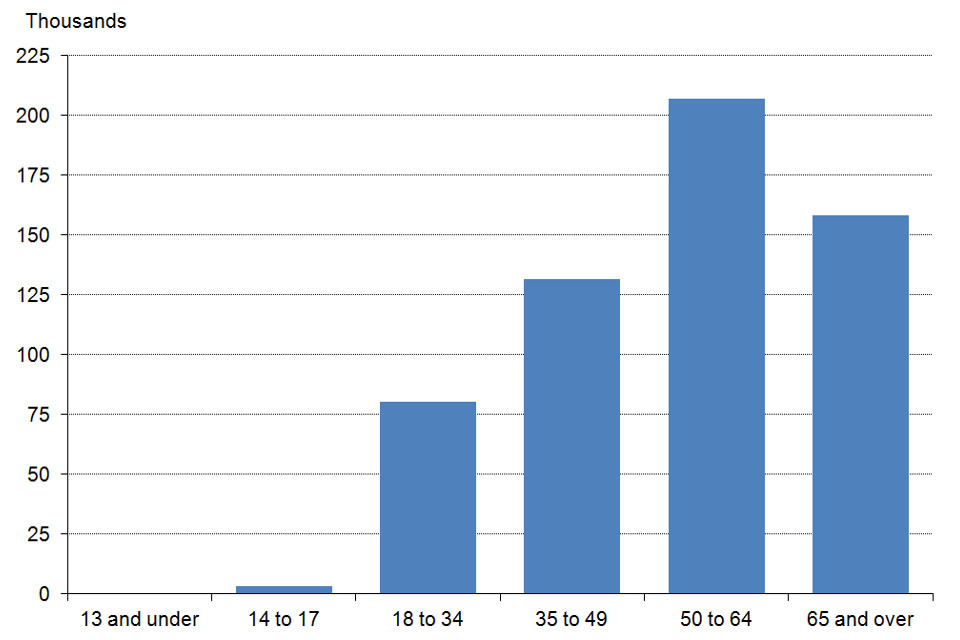
As at 31 March 2017, 580,658 people held a firearm and or shotgun certificate, a decrease of 1% (-7,023) compared with the previous year.
Of those people who held a firearm and or shotgun certificate:
- 94% (546,470) were male
- 0.6% (3,602) were aged 17 years and under
- 72% (418,873) were aged 18 to 64 years
- 27% (158,183) were aged 65 years and over
Figure 7: Firearm and or shotgun certificate holders as at 31 March 2017, by age, England and Wales

The chart shows the number of firearm and or shotgun certificate holders as at 31 March 2017, England and Wales. The data are available in Table E2.
Chart notes
- Whilst the number of people aged 13 and under appears to be 0, there were in fact 327 people.
Source: Home Office, Firearm and shotgun certificates in England and Wales, financial year ending 31 March 2017, table E2.
8.3 People who held a firearm certificate
As at 31 March 2017, 154,767 people held a firearm certificate, an increase of 1% (1,599) compared with the previous year.
Of those people who held a firearm certificate:
- 97% (149,496) were male
- 0.2% (355) were aged 14 to 17 years
- 75% (116,099) were aged 18 to 64 years
- 25% (38,313) were aged 65 years and over
8.4 People who held a shotgun certificate
As at 31 March 2017, 559,849 people held a shotgun certificate, a decrease of 1% (-6,236) compared with the previous year.
Of those people who held a shotgun certificate:
- 94% (527,591) were male
- 0.6% (3,541) were aged 17 years and under
- 72% (405,038) were aged 18 to 64 years
- 27% (151,270) were aged 65 years and over
8.5 Weapons breakdown for firearm certificates
Of the 559,302 firearms (covered by firearm certificates) as at 31 March 2017:
- rifles accounted for 58% (325,564) compared with 58% (315,308) in the previous year
- other firearm types accounted for 33% (182,130) compared with 32% (173,732) in the previous year
- Section 1 shotguns, handguns and muzzle-loading handguns accounted for 8% (44,377) compared with 8% (43,053) in the previous year
- firearms for which no type was recorded on the NFLMS accounted for the remaining 1% (7,231) compared with 1% (7,101) in the previous year
8.6 Weapons breakdown for shotgun certificates
Of the 1,349,099 shotguns (covered by shotgun certificates) as at 31 March 2017:
- Section 2 shotguns accounted for over 99% (1,344,058) compared with over 99% (1,326,534) in the previous year
- other shotgun types accounted for 0.3% (3,976) compared with 0.3% (3,921) in the previous year
- shotguns for which no type was recorded on the NFLMS accounted for the remaining 0.1% (1,065) compared with 0.1% (1,108) in the previous year
8.7 Sound moderators
Sound moderators accounted for 30% (166,638) of the 559,302 firearms (covered by firearm certificates) as at 31 March 2017.
-
Sound moderators are mainly separate accessories which diminish the noise caused by a firing weapon. ↩ ↩2
-
Calculated using the Office for National Statistics’ mid-2015 population estimates for England and Wales. ↩ ↩2
-
Rifles have spiral grooves in the barrel and bullets are used as ammunition. ↩
-
Handgun refers to the length of the firearm. Any firearm which either has a barrel less than 30cm in length or is less than 60cm in length overall is generally prohibited. The intention is to prohibit particularly dangerous firearms which are easy to conceal. However, the police may issue firearm certificates enabling the possession of certain handguns of historic interest, muzzle-loading handguns (see footnote 5), or handguns for the humane killing of animals. ↩
-
With a muzzle-loading handgun the ammunition is loaded via the muzzle of the firearm, that is, from the open end of the gun’s barrel. Muzzle-loading handguns are not quick to load and therefore do not pose the same threat as some other types of guns. ↩
-
Shotguns have a smooth surface inside the barrel and shotgun pellets are used as ammunition. Section 1 shotguns contain magazines holding more than 2 rounds. ↩
-
Shotguns have a smooth surface inside the barrel and shotgun pellets are used as ammunition. Section 2 shotguns may have a magazine restricted to no more than 2 rounds. ↩
