Spark Inside report (HTML version)
Published 28 April 2022
This analysis looked at the reoffending behaviour of 71 men who participated in Hero’s Journey, a Spark Inside intervention. The overall results do not show that the programme had a statistically significant effect on a person’s reoffending behaviour. They suggest more people need to be available for analysis to determine the way in which the programme affects the one-year proven reoffending rate, the frequency of proven reoffences, and the time taken to reoffend.
Spark Inside provides self-referred life coaching to give prisoners skills to help them unlock their potential and find solutions to their own problems. This helps them with personal responsibility, future outlook and well-being.
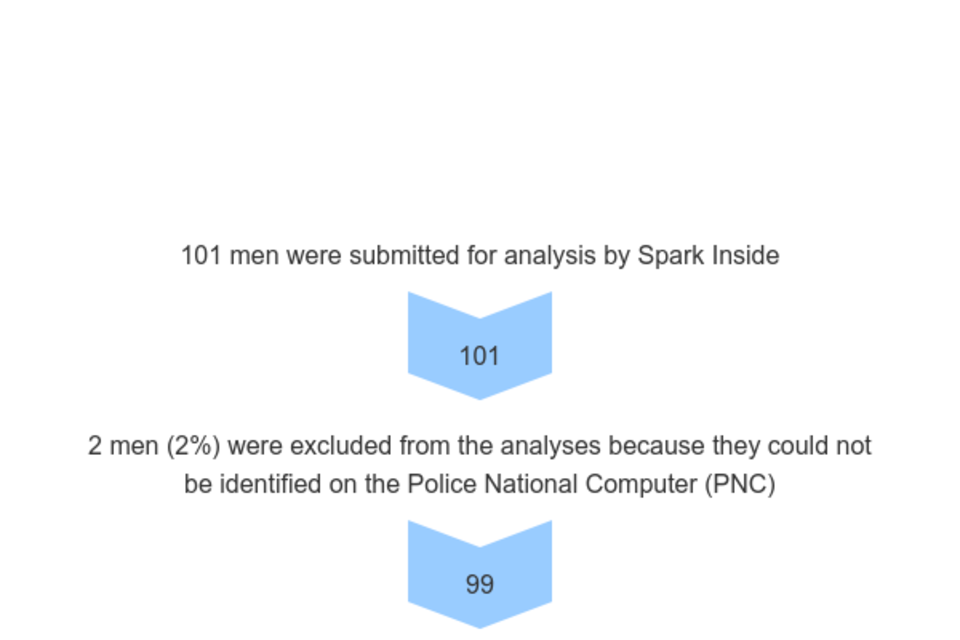
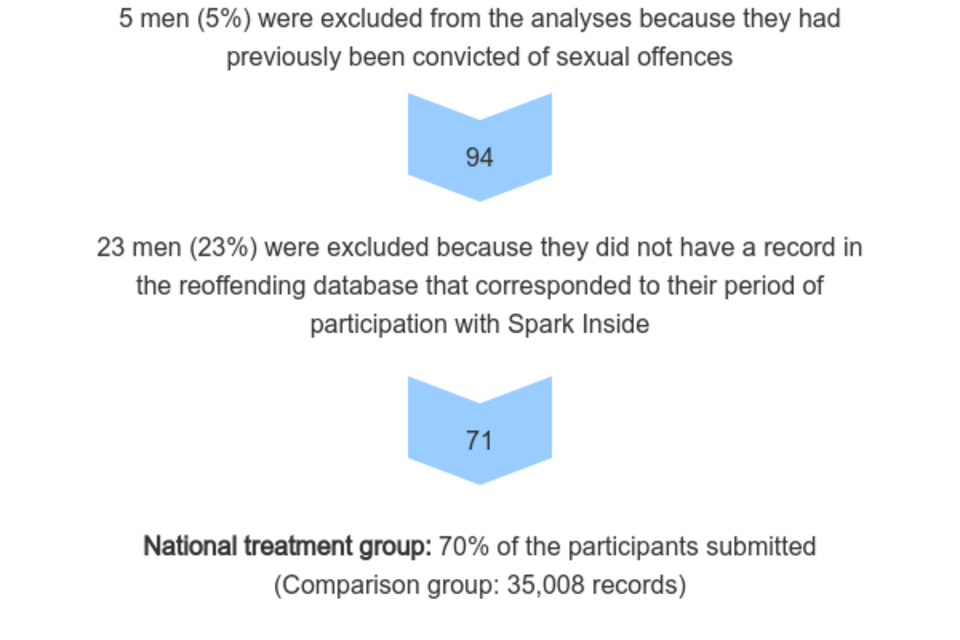
The headline analysis in this report measured proven reoffences in a one-year period for a ‘treatment group’ of 71 offenders who received support some time between 2016 and 2018, and for a much larger ‘comparison group’ of similar offenders who did not receive it. The analysis estimates the impact of the support from Spark Inside on the reoffending behaviour of people who are similar to those in the treatment group. The support may have had a different impact on 30 other participants whose details were submitted but who did not meet the minimum criteria for analysis.
1. Overall measurements of the treatment and comparison groups
| For 100 typical men in the treatment group, the equivalent of: | For 100 typical men in the comparison group, the equivalent of: |
|---|---|
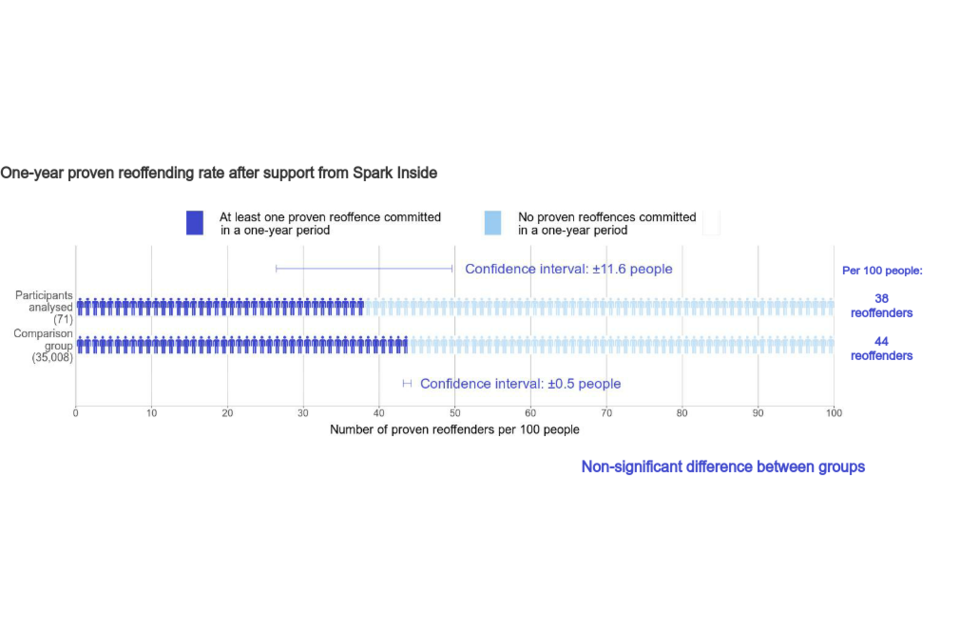
| 38 of the 100 men committed a proven reoffence within a one-year period (a rate of 38%), 6 men fewer than in the comparison group. | 44 of the 100 men committed a proven reoffence within a one-year period (a rate of 44%). |
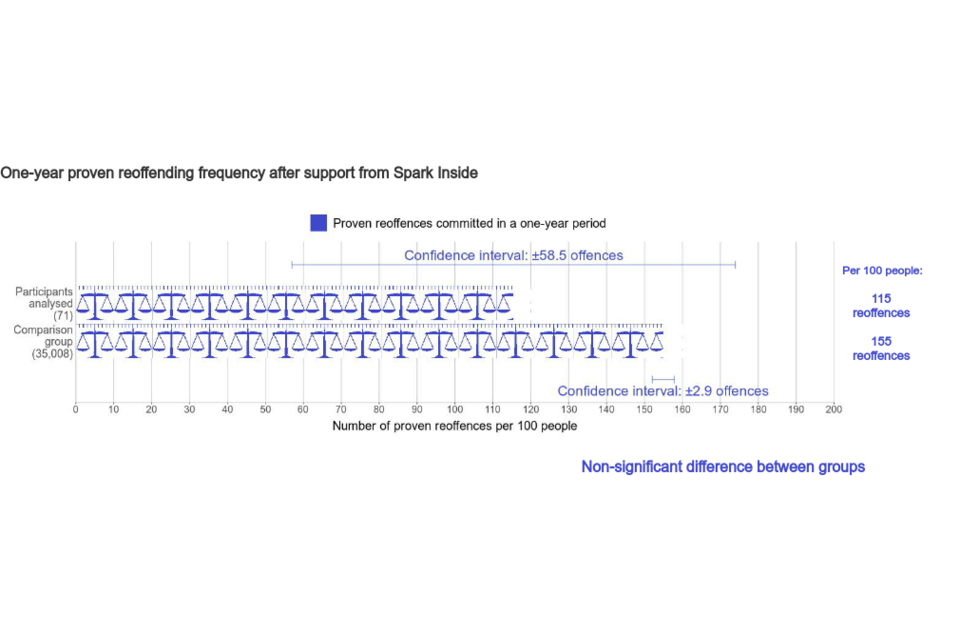
| 115 proven reoffences were committed by these 100 men during the year (a frequency of 1.2 offences offences per person), 39 offences fewer than in the comparison group. | 155 proven reoffences were committed by these 100 men during the year (a frequency of 1.5 offences per person). |
Time to first reoffence has not been included as a headline result due to low numbers of reoffenders, which could give misleading results.
2. Overall estimates of the impact of the intervention
For 100 typical men who receive support, compared with 100 similar men who do not receive it:
The number of men who commit a proven reoffence within one year after release could be lower by as many as 17 men, or higher by as many as 6 men. More men would need to be available for analysis in order to determine the direction of this difference.
The number of proven reoffences committed during the year could be lower by as many as 98 offences, or higher by as many as 19 offences. More men would need to be available for analysis in order to determine the direction of this difference.
Please note totals may not appear to equal the sum of the component parts due to rounding.
3. What you can and cannot say
What you can say about the one-year reoffending rate:
“This analysis does not provide clear evidence on whether support from Spark Inside increases or decreases the number of participants who commit a proven reoffence in a one-year period. There may be a number of reasons for this and it is possible that an analysis of more participants would provide such evidence.”
What you cannot say about the one-year reoffending rate:
“This analysis provides evidence that support from Spark Inside increases/decreases/has no effect on the reoffending rate of its participants.”
What you can say about the one-year reoffending frequency:
“This analysis does not provide clear evidence on whether support from Spark Inside increases or decreases the number of proven reoffences during a one-year period. There may be a number of reasons for this and it is possible that an analysis of more participants would provide such evidence.”
What you cannot say about the one-year reoffending frequency:
“This analysis provides evidence that support from Spark Inside increases/decreases/has no effect on the number of proven reoffences committed during a one-year period by its participants.”
4. Figure 1: One-year proven reoffending rate after support from Spark Inside

5. Figure 2: One-year proven reoffending frequency after support from Spark Inside

6. Spark Inside in their own words
The Hero’s Journey life coaching programme is for 15 to 25 year old boys and men in prison. It builds motivation to create a positive future-self, away from crime, aiming to reduce reoffending post-release. It is a structured programme consisting of group workshops for up to 8 young people, followed by one-to-one coaching sessions, with professional, qualified life coaches. These start in prison and can continue into the community, on the participant’s release through the gates. Using the steps on the Hero’s Journey model, young men in prison navigate their personal cycle of change and create a pro-social identity away from crime. It has been proven to improve vital life skills such as confidence, decision-making, problem-solving, resilience and empathy, as well as future outlook and wellbeing. Life coaches don’t tell the young people what to do, instead the young people are empowered to make different choices for themselves. The individualised nature of life coaching allows each person to receive tailored sessions, giving them access to the tools they need to change their life. On finishing the programme, the young people have developed a skillset and motivation to create a crime free future.
7. Response from Spark Inside to the Justice Data Lab analysis
Spark Inside is grateful to the Justice Data Lab team for completing these analyses, especially given the constraints imposed during 2020 by the Covid-19 lockdown. However, we were disappointed to note that 25 of our beneficiaries (25% of our sample) were excluded from the analysis mainly as they could not be identified on the PNC (Police National Computer) or because they did not have a matching record in the reoffending database, despite Spark Inside meeting these young people in custody.
However, there is learning here for Spark Inside. The most recent reoffending data in the UK shows that the proven reoffending rate for adult offenders released from custody is 40.3% (Ministry of Justice, 2022). The matched comparison group within this report has a proven reoffending rate of 44%. As such, we note that Spark Inside engages a cohort of young adults (average age 22) with a higher-than-average risk of reoffending.
We already know that the Hero’s Journey has a positive impact on young people in prison. Analysis of data collected from participants between 2016-2019, using validated scales wherever possible (including the Short Warwick-Edinburgh Mental Well-being Scale, the Brief Resilience Scale, and the Journey to Employment Framework) found statistically significant improvements in young people’s wellbeing, future outlook, decision-making and problem-solving skills, empathy and emotional intelligence, resilience and confidence (Chiu, 2019). Given that this analysis identifies that of our beneficiaries with an OASys record 81% had some or significant problems with problem solving skills, 79% had some or significant problems with consequence awareness, and 64% had some or significant problems with understanding people’s views, the importance of the Hero’s Journey impact on decision-making, problem-solving skills, empathy and emotional intelligence cannot be underestimated.
Furthermore, whilst the difference seen is not a statistically significant result, we were pleased to see that, on an absolute level, fewer young people reoffended, and fewer proven offences were committed, in the treatment group compared to the control group. On this basis, we believe life coaching in the criminal justice system is worth further investment to work with more young people in custody in order to reach a statistically significant result. Therefore, going forward, we intend to grow our sample size, to hopefully secure clear evidence of Spark Inside’s impact on the number of participants who commit a proven reoffence in a one-year period. However, we envision this will take some time, given that we are a small charity with limited resources, and the high percentage of beneficiaries likely to be excluded from any future analysis. In the meantime, we are continuing to enhance our programmes, with particular focus on gathering richer information about the changes our participants experience while taking part in the Hero’s Journey (using client centred evaluation methods, such as the Youth Outcomes Star). We are also developing ways to understand the longer-term impact of our work, on the lives and the life chances of young people who engage in the Hero’s Journey life coaching programme.
8. Results in detail
One analysis was conducted, controlling for offender demographics and criminal history and the following risks and needs: employment, education, relationships, drug use, alcohol use and thinking skills.
- National analysis: treatment group matched to offenders across England and Wales using demographics, criminal history and individual risks and needs.
The sizes of the treatment and comparison groups for reoffending rate and frequency analyses are provided below. To create a comparison group that is as similar as possible to the treatment group, each person within the comparison group is given a weighting proportionate to how closely they match the characteristics of individuals in the treatment group. The calculated reoffending rate uses the weighted values for each person and therefore does not necessarily correspond to the unweighted figures.
| Treatment Group Size | Comparison Group Size | Reoffenders in treatment group | Reoffenders in comparison group |
|---|---|---|---|
| 71 | 35,008 | 27 | 15,075 |
Two headline measures of one-year reoffending were analysed (see results in Tables 1-2):
- Rate of reoffending
- Frequency of reoffending
Tables 1-2 show the overall measures of reoffending. Rates are expressed as percentages and frequencies expressed per person.
8.1 Table 1: Proportion of men who committed a proven reoffence in a one-year period after support from Spark Inside compared with matched comparison groups
| Number in treatment group | Number in comparison group | Treatment group rate (%) | Comparison group rate (%) | Estimated difference (% points) | Significant difference? | p-value |
|---|---|---|---|---|---|---|
| 71 | 35,008 | 38 | 44 | -17 to 6 | No | 0.33 |
8.2 Table 2: Number of proven reoffences committed in a one-year period by men who received support from Spark Inside compared with matched comparison groups
| Number in treatment group | Number in comparison group | Treatment group frequency | Comparison group frequency | Estimated difference | Significant difference? | p-value |
|---|---|---|---|---|---|---|
| 71 | 35,008 | 1.15 | 1.55 | -0.98 to 0.19 | No | 0.18 |
9. Profile of the treatment group
Spark Inside’s ‘Hero’s Journey’ programme was available to young men, aged between 15 and 25, who were within 6 months of the end of their custodial sentence. As part of the coaching approach, the individuals self-referred, and had to be motivated to make their own choices and decisions. Information on those who were included in the treatment group is below, compared with the characteristics of those who could not be included in the analysis.
| Participants included in analysis (71 offenders) | Participants not included in analysis (27 offenders with available data) | |
|---|---|---|
| Sex | ||
| Male | 100% | 100% |
| Ethnicity | ||
| White | 25% | 26% |
| Black | 65% | 56% |
| Asian | 6% | 11% |
| Other | 1% | 4% |
| Unknown | 3% | 4% |
| UK national | ||
| UK nationality | 87% | 74% |
| Foreign nationality | 11% | 26% |
| Unknown nationality | 1% | 0% |
| Prison sentence length | ||
| Less than 6 months | 24% | |
| More than 6 months to less than 1 year |
15% | |
| 1 year to less than 4 years | 48% | |
| 4 to 10 years | 11% | |
| More than 10 years | 1% |
Information on index offences for the 27 participants not included in the analysis is not available, as they could not be linked to a suitable sentence.
For 3 people without any records in the reoffending database, no personal information is available.
Please note totals may not appear to equal the sum of the component parts due to rounding.
Information on individual risks and needs was available for 42 people in the overall reoffending analysis treatment group (59%), recorded near to the time of their original conviction. Of those for whom information is available
- 81% had some or significant problems with problem solving skills
- 79% had some or significant problems with consequence awareness
- 64% had some or significant problems with understanding people’s views
10. Matching the treatment and comparison groups
The analysis matched a comparison group to the treatment group. A summary of the matching quality is as follows:
- All variables in the model were well matched.
Further details of group characteristics and matching quality, including risks and needs recorded by the Offender Assessment System (OASys), can be found in the Excel annex accompanying this report.
This report is also supplemented by a general annex, which answers frequently asked questions about Justice Data Lab analyses and explains the caveats associated with them.
11. Numbers of people in the treatment and comparison groups


12. Contact Points
Press enquiries should be directed to the Ministry of Justice press office. Other enquiries about the analysis should be directed to:
Annie Sorbie
Justice Data Lab team
Analytical Priority Projects
Ministry of Justice
7th Floor
102 Petty France
London
SW1H 9AJ
Tel: 07967 592178
E-mail: justice.datalab@justice.gov.uk
General enquiries about the statistical work of the Ministry of Justice can be e-mailed to: ESD@justice.gov.uk
General information about the official statistics system of the United Kingdom is available from https://gss.civilservice.gov.uk/policy-store/code-of-practice-for-statistics/
© Crown copyright 2022
This document is released under the Open Government Licence
Produced by the Ministry of Justice
Alternative formats are available on request from justice.datalab@justice.gov.uk
