Public Health Outcomes Framework: commentary, August 2022
Published 2 August 2022
Applies to England
Background
The Public Health Outcomes Framework (PHOF) sets out a high-level overview of public health outcomes, at national and local level, supported by a broad set of indicators. An interactive web tool makes the PHOF data available publicly. This allows local authorities to assess progress in comparison to national averages and their peers, and develop their work plans accordingly.
New in this update
The latest update includes data for 17 indicators. This summary provides the main messages from indicators updated on inequality in healthy life expectancy, employment rates and flu vaccination coverage. For a complete list of indicators that have been updated please see Public Health Outcomes Framework: indicator updates, 2 August 2022.
Summary of selected updated indicators
A02b: inequality in healthy life expectancy at birth for England
Inequality in healthy life expectancy, by deprivation level, in the PHOF is estimated using a summary measure called the slope index of inequality (SII). The higher the value of the SII, the greater the inequality within an area.
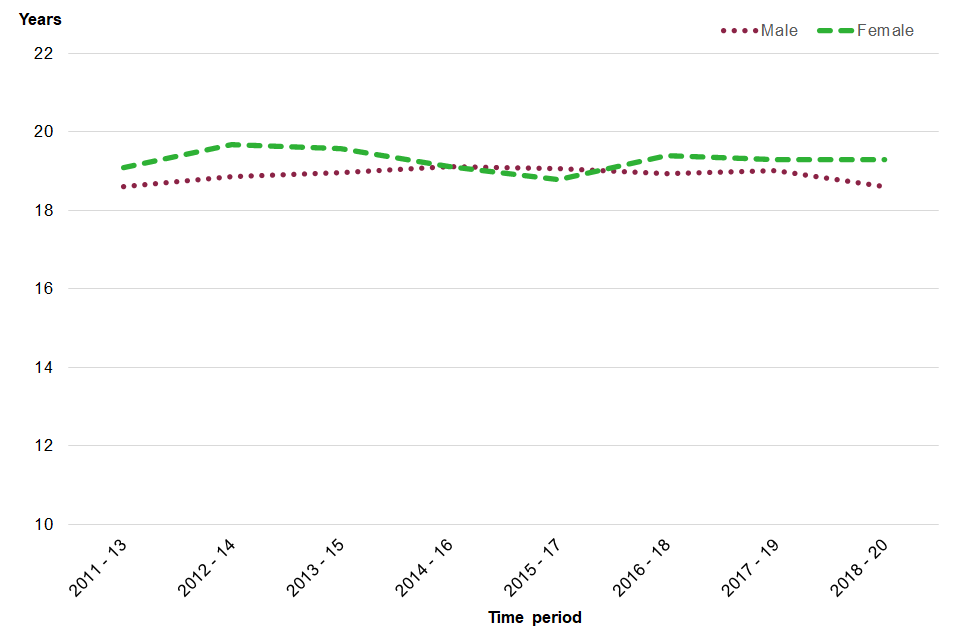
The difference in healthy life expectancy at birth between the most and least deprived areas in England was 18.6 years for males and 19.3 years for females in 2018 to 2020 (see Figure 1). There was no significant change in inequality for either sex compared with the previous period, and the inequality in healthy life expectancy at birth for England remained stable between 2011 to 2013 and 2018 to 2020.
Figure 1: trends in inequality in healthy life expectancy at birth in males and females, England, 2011 to 2013 to 2018 to 2020

Please note that for Figure 1 the y axis does not start at 0.
Employment indicators (indicators B08a, B08b and B08c, 2020 to 2021 data)
New indicators showing employment rates have been added alongside the 3 existing ‘gap in employment’ indicators. The gap indicators mask the underlying employment rate in an area, so these contextual indicators provide the necessary information to establish whether the employment rate of the relevant subgroup is high or low when compared to other areas.
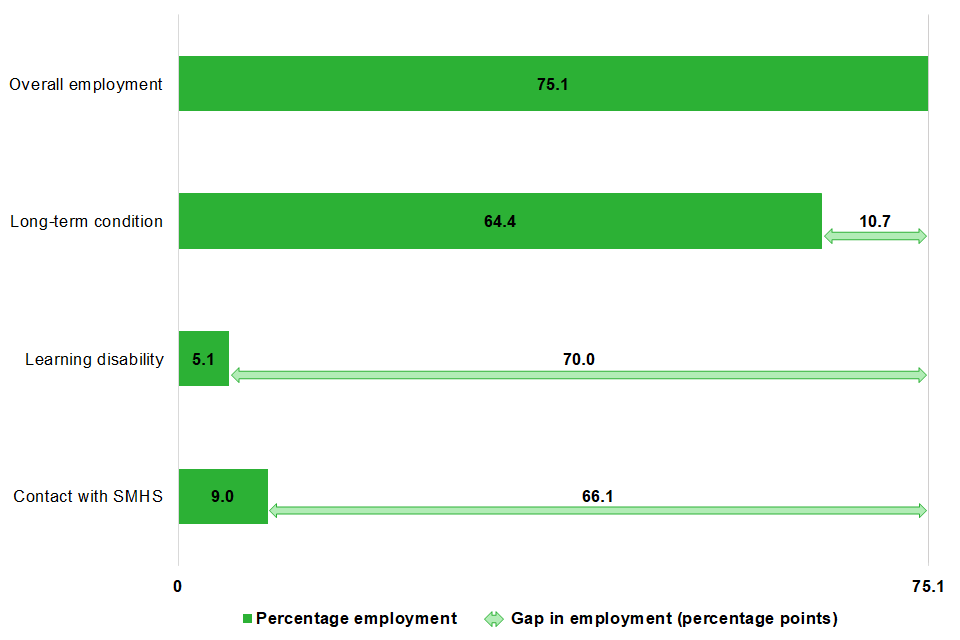
People in England with a physical or mental long-term health condition have a higher estimated employment rate at 64.4% than people with long-term support for a learning disability (5.1%), and people in contact with secondary mental health services under the Care Plan Approach (9.0%).
To calculate the gap, these employment rates are compared against the overall employment rate of 75.1% (see PHOF indicator B08d). The percentage point gap in employment is 10.7 for people with a long-term health condition, 70.0 for people with long-term support for a learning disability and 66.1 for people in contact with secondary mental health services (see Figure 2).
Figure 2: employment in England overall and of various sub-groups, 2020 to 2021

B08a: employment indicators for those with a physical or mental long-term health condition
B08a includes 2 indicators:
-
gap in the employment rate between those with a physical or mental long-term health condition (aged 16 to 64) and the overall employment rate
-
percentage of the population with a physical or mental long-term health condition in employment (aged 16 to 64)
The data for these indicators is from the Office for National Statistics Annual Population Survey (APS) and is based on the question “Do you have any physical or mental health conditions or illnesses lasting or expected to last 12 months or more?”.
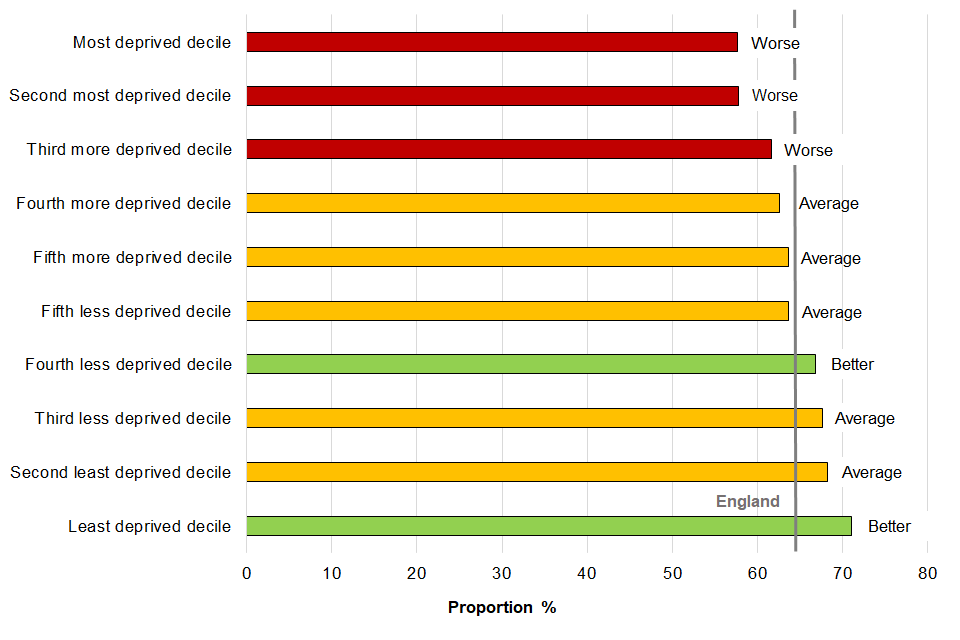
For people with long-term conditions there is a strong inequality gradient with 71.1% of people with long-term conditions being in employment in the least deprived decile of counties and unitary authorities, compared with 57.7% in the most deprived decile (see Figure 3).
Figure 3: employment rate of those with a long-term health condition by deprivation decile, England, 2020 to 2021

B08b: employment indicators for those who are in receipt of long-term support for a learning disability
B08b includes 2 indicators:
-
gap in the employment rate between those who are in receipt of long-term support for a learning disability (aged 18 to 64) and the overall employment rate
-
percentage of the population in receipt of long-term support for a learning disability that are in paid employment (aged 18 to 64)
The data for these indicators is from the APS for the overall employment rate, and an associated indicator on employment rates in people with a learning disability from the NHS Digital Adult Social Care Outcomes Framework (ASCOF). The indicator relates to a subgroup of people receiving support for learning disabilities as opposed to all people with learning disabilities. It is not known what proportion of the population with a learning disability these data capture. There is caution advised around the reliability of these figures because of the complex definition.
Males with long-term support for a learning disability had higher employment rates of 5.7% than females (4.4%).
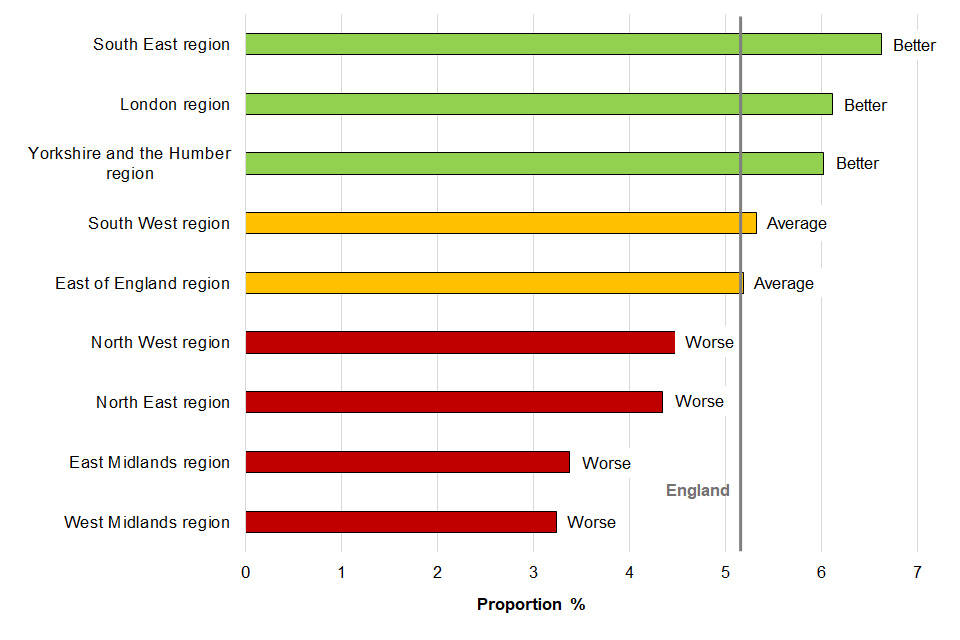
For people with long-term support for a learning disability (B08b), the employment rate varies significantly by region and is lowest in the Midlands regions, the North West and the North East (see Figure 4).
Figure 4: employment rate of those with support for a learning disability by region, 2020 to 2021

B08c: employment indicators for those who are in contact with secondary mental health services
B08c includes 2 indicators:
-
gap in the employment rate for those who are in contact with secondary mental health services (aged 18 to 69) and on the Care Plan Approach, and the overall employment rate
-
percentage of the population who are in contact with secondary mental health services and on the Care Plan Approach, that are in paid employment (aged 18 to 69)
The data for these indicators is from the APS for the overall employment rate, and an associated indicator on mental health employment rates from ASCOF. ‘Adults in contact with secondary mental health services’ is defined as those aged 18 to 69 who are receiving secondary mental health services and who are on the Care Programme Approach (CPA). Inconsistency in the use of the CPA means that in some areas very few people are included in the denominator, so caution is advised around the reliability of the estimates.
Males in contact with secondary mental health services had lower employment rates at 7.0% than females (10%).
Population vaccination coverage against flu (D03l, D04d, D05, D06a)
Influenza (also known as flu) is a highly infectious viral illness spread by droplet infection. It is possible for someone to develop serious complications if they catch flu. Immunisation is one of the most effective healthcare interventions available and flu vaccines can prevent illness and hospital admissions among high-risk groups of people.
Flu vaccination data is provided by the UK Health Security Agency (UKHSA), who are responsible for the Influenza Vaccine Uptake Monitoring Programme.
Vaccine uptake in England in:
-
children aged 2 and 3 years was 50.1% in 2021 to 2022, compared with 56.7% in 2020 to 2021,
-
primary school children (Reception to Year 6) was 57.4% in the 2021 to 2022 flu season, compared with 62.5% during the 2020 to 2021 season
-
at-risk individuals aged 6 months to under 65 years remained stable at 52.9% in 2021 to 2022, compared with 53.0% in 2020 to 2021
-
adults aged 65 and over was 82.3% in 2021 to 2022, compared with 80.9% in 2020 to 2021. This is the highest vaccine uptake ever achieved for this group and exceeds the World Health Organization ambition of 75%
View the Public Health Outcomes Framework.
Responsible statistician and product lead: Kathryn Morgan.
For queries relating to this publication contact pha-ohid@dhsc.gov.uk.
The next planned update is November 2022.
