UK statistics on waste
Updated 23 September 2026

© Crown copyright 2026
This publication is licensed under the terms of the Open Government Licence v3.0 except where otherwise stated. To view this licence, visit nationalarchives.gov.uk/doc/open-government-licence/version/3 or write to the Information Policy Team, The National Archives, Kew, London TW9 4DU, or email: psi@nationalarchives.gov.uk.
Where we have identified any third party copyright information you will need to obtain permission from the copyright holders concerned.
This publication is available at https://www.gov.uk/government/statistics/uk-waste-data/uk-statistics-on-waste
The purpose of this release is to announce UK waste estimates which provide an overview of the waste sector. It includes data on:
- the recycling rate from waste from households (WfH), with new 2024 data
- the amount of biodegradable municipal waste (BMW) sent to landfill, with new 2024 data
- packaging waste, with new provisional 2025 data
- the recovery rate from construction and demolition (C&D), with new 2023 and provisional 2024 England data
- commercial and industrial (C&I) waste, with new 2024 England data
- the total waste generation and final treatment of all waste, with new provisional 2024 England data
- waste infrastructure, with new 2024 England data
There is a detailed separate UK statistics on waste dataset.
1. Key points
- The UK recycling rate for waste from households (WfH), including Incinerator Bottom Ash metal (IBAm), was 44.5% in 2024, down 0.1 percentage points from 44.6% in 2023.
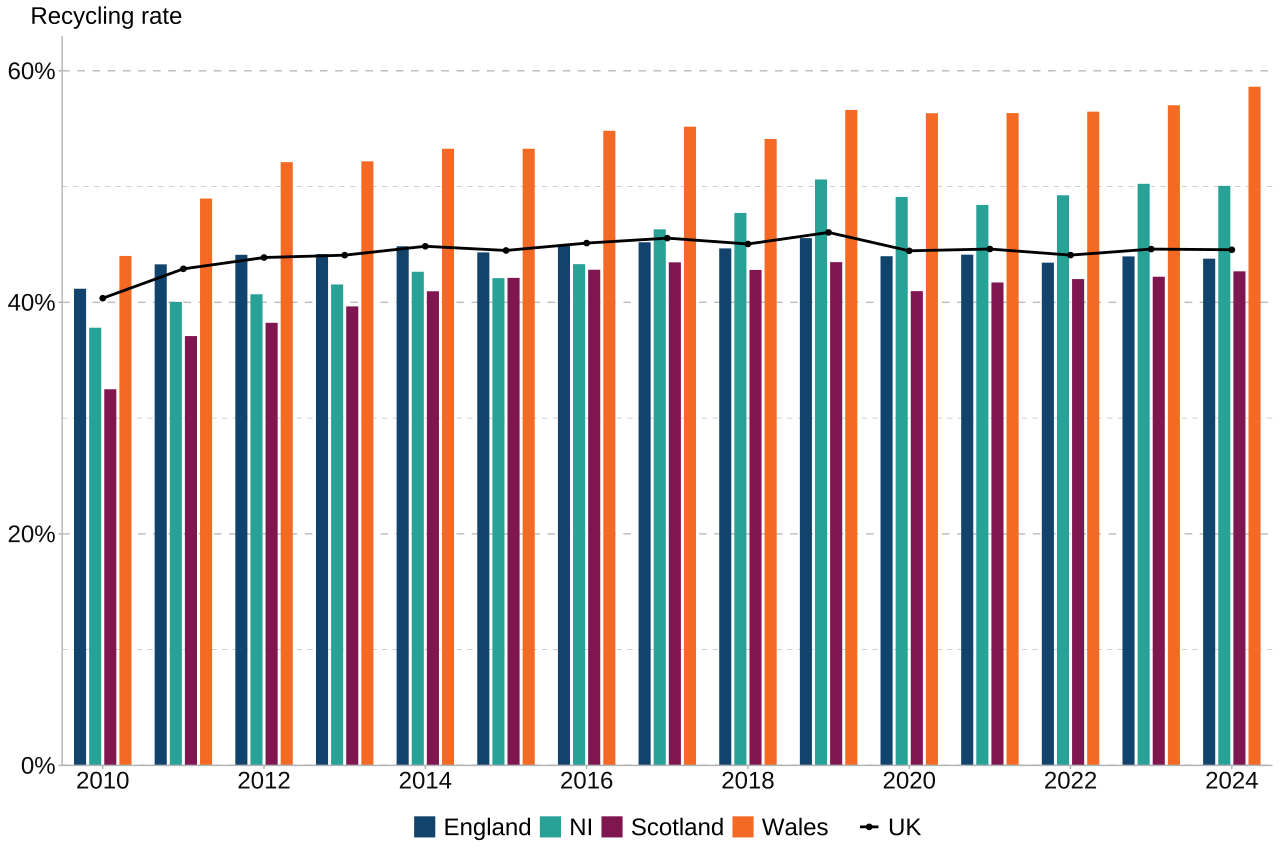
- The recycling rate for waste from households increased in Wales and Scotland in 2024. The recycling rate for England was 43.8%, it was 50.1% in Northern Ireland, 42.7% in Scotland, and 58.6% in Wales.
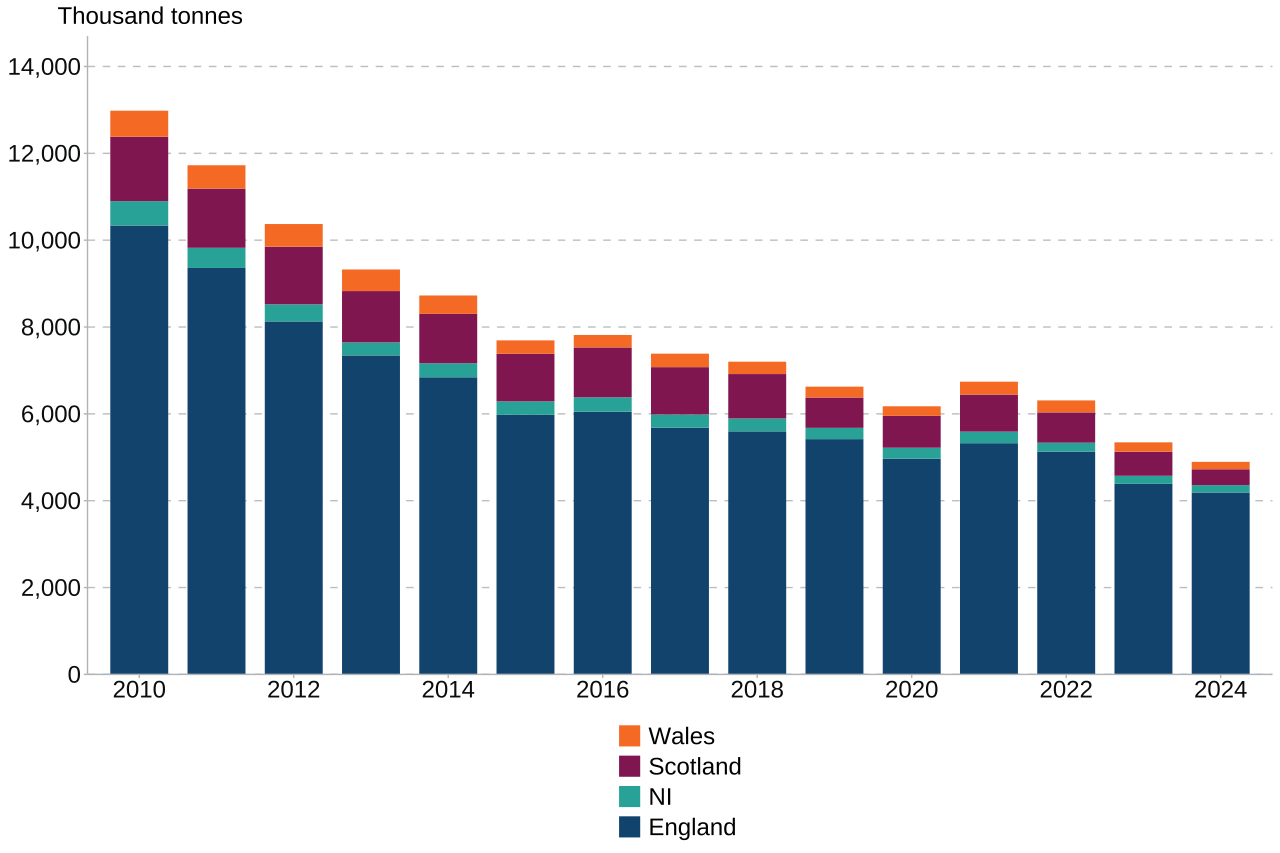
- UK biodegradable municipal waste (BMW) sent to landfill decreased to 4.9 million tonnes in 2024 from 5.3 million tonnes in 2023.
- Provisional figures for 2025 show that 70.5% of UK packaging waste overall was recycled.
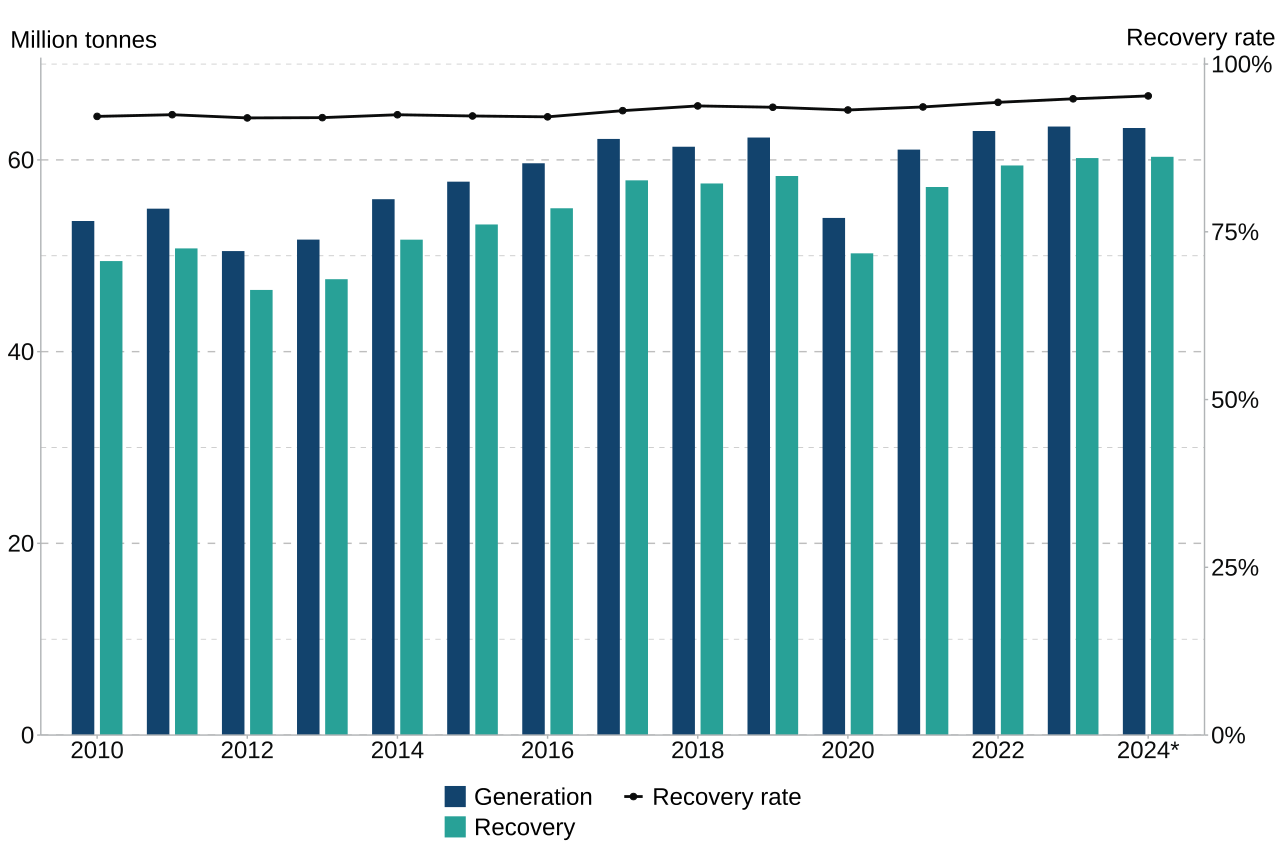
- Provisional estimates for 2024 show that England generated 63.3 million tonnes of non-hazardous construction and demolition (C&D) waste, of which 60.3 million tonnes was recovered.
- It is estimated that England generated 32 million tonnes of commercial and industrial (C&I) waste in 2024.
- Provisional estimates for 2024 show that England generated 178.1 million tonnes of total waste.
2. Data revisions in this update
This release contains several data updates.
Waste from household figures: there have been revisions made to the 2023 England figures to include final reported data for one local authority and minor updates to another local authority. Revisions have been made to the Scotland figures for 2023 due to a methodological change which has improved the capture of metal outputs from incineration processes. The result is a small decrease in other diversion of waste from landfill and an increase in recycling of waste for some local authorities.
Packaging: there have been very minor revisions made to the 2024 National Packaging Waste Database figures. There have also been revisions made to the 2024 Reported Packaging Data.
Commercial and industrial waste: there have been revisions made to the 2021, 2022 and 2023 England figures to take account of updated data and to correct an error in the calculations for 2023.
Total waste generated and treated: there have been revisions made to the 2020 total waste generated and treated figures for England and the UK to correct an error in the mining waste calculations. There have also been revisions to the 2022 England total waste generated and treated figures to incorporate revised 2022 commercial and industrial waste arising figures and to correct an error in the mining waste calculations.
3. Waste from households (WfH)
Updated, with figures for 2024
Waste from households (WfH) is the agreed harmonised UK measure used to report household recycling. The UK currently defines ‘household waste’ using the waste from households measure.
Updated UK figures for 2024 are available as summarised in Table 1 and Figure 1.
The recycling figures all include metal recovered and recycled after incineration (incinerator bottom ash metal; IBAm). This methodological change was introduced in the February 2018 release for 2016 data. At an overall UK level this change in methodology raised the recycling rate for 2024 by around 0.9 percentage points (equivalent to 250,000 tonnes; see UK statistics on waste dataset). For more details on this change refer to the methodology section.
Table 1: Waste from households, UK and country split, 2019 to 2024 (thousand tonnes and percentage rate)
| Year | Measure | UK | England | Northern Ireland | Scotland | Wales |
|---|---|---|---|---|---|---|
| 2019 | Arisings | 26,441 | 22,074 | 842 | 2,303 | 1,223 |
| Of which recycled | 12,173 | 10,054 | 426 | 1,001 | 692 | |
| Recycling rate | 46.0% | 45.5% | 50.6% | 43.5% | 56.6% | |
| 2020 | Arisings | 27,009 | 22,586 | 860 | 2,335 | 1,228 |
| Of which recycled | 12,005 | 9,935 | 422 | 956 | 692 | |
| Recycling rate | 44.5% | 44.0% | 49.1% | 41.0% | 56.3% | |
| 2021 | Arisings | 27,650 | 23,120 | 891 | 2,381 | 1,257 |
| Of which recycled | 12,333 | 10,200 | 432 | 993 | 709 | |
| Recycling rate | 44.6% | 44.1% | 48.4% | 41.7% | 56.4% | |
| 2022 | Arisings | 25,687 | 21,466 | 812 | 2,238 | 1,170 |
| Of which recycled | 11,323 | 9,322 | 400 | 940 | 661 | |
| Recycling rate | 44.1% | 43.4% | 49.2% | 42.0% | 56.5% | |
| 2023 | Arisings | 25,913 | 21,718 | 833 | 2,212 | 1,150 |
| Of which recycled | 11,558 | 9,549 | 419 | 934 | 656 | |
| Recycling rate | 44.6% | 44.0% | 50.2% | 42.2% | 57.0% | |
| 2024 | Arisings | 26,154 | 21,936 | 842 | 2,217 | 1,160 |
| Of which recycled | 11,650 | 9,602 | 421 | 946 | 680 | |
| Recycling rate | 44.5% | 43.8% | 50.1% | 42.7% | 58.6% |
Source: WasteDataFlow, Defra Statistics
Notes on Table 1:
- Figures include IBA metal but in Northern Ireland, only since mid-2023
- Equivalent figures for 2015 to 2018 can be seen in the accompanying UK statistics on waste dataset
- Percentages calculated from unrounded figures; breakdowns for individual countries may not exactly sum to UK totals due to rounding
- Revisions have been made to the 2023 England figures to include final reported data for one local authority and minor updates to another local authority.
- Revisions have been made to the Scotland figures for 2023 due to a methodological change which has improved the capture of metal outputs from incineration processes. The result is a small decrease in other diversion of waste from landfill and an increase in recycling of waste for some local authorities
Total UK waste from households generation was 26.2 million tonnes in 2024, an increase of 1% from 2023. England is responsible for the vast majority of UK waste from households, generating 21.9 million tonnes (84% of the UK total) in 2024 (Table 1).
Figure 1: Recycling rate from waste from households, UK and country split, 2010 to 2024
Source: WasteDataFlow, Defra Statistics
Notes on Figure 1:
- From 2015, these figures include IBA metal (this typically adds up to 0.9 percentage points to the overall UK recycling rate)
- Figures include IBA metal but in Northern Ireland, only since mid-2023
- Revisions have been made to the 2023 England figures to include final reported data for one local authority and minor updates to another local authority.
- Revisions have been made to the Scotland figures for 2023 due to a methodological change which has improved the capture of metal outputs from incineration processes. The result is a small decrease in other diversion of waste from landfill and an increase in recycling of waste for some local authorities
Download the data for Figure 1
Figure 1 shows that the UK Waste from households recycling rate (including IBA metal) was 44.5% in 2024, similar to 2023 when it was 44.6%.
The recycling rate for waste from households increased in Wales and Scotland in 2024. The recycling rate for England was 43.8%, it was 50.1% in Northern Ireland, 42.7% in Scotland, and 58.6% in Wales.
Total waste from households generation in England increased by 218,000 tonnes (1.0%) in 2024. Residual waste increased by 175,000 tonnes (1.4%) from 2023, while recycling increased by 53,000 tonnes (0.6%). Within this total, dry recycling increased by 103,000 tonnes (1.9%), and organics decreased by 50,000 tonnes (1.2%). See our local authority collected and managed waste statistical notice for more information.
4. Biodegradable municipal waste (BMW) sent to landfill
Updated, with new figures for 2024
UK estimates for biodegradable municipal waste (BMW) to landfill have been calculated using a UK wide approach in accordance with relevant legislation. Biodegradable municipal waste is the fraction of municipal waste that will decompose. Amongst other materials it will include food waste, green waste, cardboard and paper.
The UK countries have agreed a set of European Waste Catalogue (EWC) classification codes to represent ‘municipal waste’. Countries use broadly similar, but non-identical sets of factors, for the proportion of each EWC code that is biodegradable, based upon composition studies of landfill waste. See methodology section for more details.
Figure 2: Biodegradable municipal waste to landfill UK and country split, 2010 to 2024
Source: Waste Data Interrogator, Defra Statistics
Download the data for Figure 2
Figure 2 and Table 2 show that UK biodegradable municipal waste sent to landfill decreased to 4.9 million tonnes in 2024 from 5.3 million tonnes in 2023. England is responsible for 86% of UK biodegradable municipal waste to landfill, generating 4.2 million tonnes of the 4.9 million tonnes UK total in 2024.
Around 48% of UK municipal waste sent to landfill was biodegradable in 2024. This proportion has remained unchanged over the past six years.
Table 2: Biodegradable municipal waste to landfill, UK and country split, 2019 to 2024 (thousand tonnes)
| Year | Measure | UK | England | Northern Ireland | Scotland | Wales |
|---|---|---|---|---|---|---|
| 2019 | Municipal Waste to Landfill | 13,781 | 11,492 | 445 | 1,338 | 507 |
| of which biodegradable | 6,626 | 5,418 | 260 | 699 | 250 | |
| 2020 | Municipal Waste to Landfill | 12,765 | 10,521 | 430 | 1,363 | 452 |
| of which biodegradable | 6,175 | 4,968 | 252 | 734 | 221 | |
| 2021 | Municipal Waste to Landfill | 13,973 | 11,394 | 436 | 1,544 | 599 |
| of which biodegradable | 6,741 | 5,325 | 266 | 855 | 296 | |
| 2022 | Municipal Waste to Landfill | 13,146 | 10,967 | 339 | 1,269 | 571 |
| of which biodegradable | 6,310 | 5,132 | 204 | 699 | 276 | |
| 2023 | Municipal Waste to Landfill | 11,184 | 9,332 | 314 | 1,083 | 455 |
| of which biodegradable | 5,344 | 4,388 | 186 | 554 | 216 | |
| 2024 | Municipal Waste to Landfill | 10,135 | 8,790 | 276 | 706 | 362 |
| of which biodegradable | 4,895 | 4,190 | 169 | 366 | 170 |
Source: Waste Data Interrogator, Defra Statistics
Notes on Table 2:
- Individual countries may not exactly sum to UK total due to rounding
- Equivalent figures for 2010 to 2018 can be seen in the accompanying UK statistics on waste dataset
The vast majority of municipal waste received at landfill is classified as ‘mixed’ waste categories, from which it is not possible to routinely identify individual material streams, for example, food waste, without commissioning specific research on waste composition. The Waste and Resources Action Programme (WRAP) have published the results of a study to quantify the composition of municipal waste at the point of collection, but this does not directly relate to data on waste received at treatment sites.
Table 3: Municipal waste to landfill, by main waste types, UK and country split, 2024 (thousand tonnes)
| Waste Type (EWC code) | UK | England | Northern Ireland | Scotland | Wales |
|---|---|---|---|---|---|
| Wastes from mechanical treatment of waste (19 12 12) | 6,958 | 6,277 | 111 | 278 | 293 |
| Mixed municipal waste (20 03 01) | 1,863 | 1,406 | 146 | 265 | 46 |
| Other (all other EWC codes) | 1,313 | 1,107 | 19 | 164 | 23 |
| Total | 10,135 | 8,790 | 276 | 706 | 362 |
Source: Waste Data Interrogator, Defra Statistics
Notes on Table 3:
Individual countries may not exactly sum to UK total due to rounding
Table 3 shows the amount of municipal waste to landfill by main waste types for 2024. The two main municipal waste categories at landfill are ‘wastes from mechanical treatment of waste’ (EWC code 19 12 12) and ‘mixed municipal waste’ (EWC code 20 03 01), which together make up around 87% of all municipal waste received at landfill.
In 2024, 7 million tonnes of municipal waste sent to landfill in the UK was categorised as ‘wastes from mechanical treatment of waste’, and 1.9 million tonnes was categorised as ‘mixed municipal waste’ (Table 3). Since 2010, the tonnage of ‘mixed municipal waste’ at landfill has fallen by 86% while ‘wastes from mechanical treatment of waste’ has only fallen by 28%. This means that the proportions of these municipal waste categories have nearly reversed, with the proportion of ‘wastes from mechanical treatment of waste’ increasing almost every year (from 38% in 2010 to 69% in 2024) and ‘mixed municipal waste’ decreasing almost every year (54% in 2010 to 18% in 2024). Data on the biodegradable portions of these waste codes can be found in the underlying UK statistics on waste dataset.
For England in 2024, EWC codes 19 12 12 and 20 03 01 together accounted for 87% of municipal waste received at landfill. Of the remaining 12.6%, 7.9% was accounted for by four EWC codes with tonnages between 100,000 and 280,000 tonnes (20 02 02, 20 03 07, 20 03 03, 20 02 01), 2.8% by nine EWC codes with tonnages between 10,000 and 100,000 tonnes and the final 0.5% by small tonnages of a further 32 EWC codes.
5. Packaging waste
Updated with new provisional figures for 2025
The Producer Responsibility Obligations (Packaging Waste) Regulations set material specific recycling targets and require businesses obligated under the regulations to ensure the recycling of a proportion of the packaging they generate and place on the market.
UK recycling rates for packaging materials for 2024 and 2025 are calculated based on the amount of packaging reported as being recycled under the regulations and the total amount of packaging materials estimated to be placed on the UK market in each year.
Packaging Extended Producer Responsibility (pEPR) came into force on 1 January 2025, and with the data regulations, Producer Responsibility Obligations (Packaging and Packaging Waste) 2024, provides new data on total packaging supplied and placed on the UK market by obligated producers.
The recycling rates presented in Tables 4 and 5 are based on actual recycling data from the National Packaging Waste Database (NPWD) and use the total reported packaging supplied tonnages by large and small producers from the Reported Packaging Data system. Unlike annual producer recycling targets, annual recycling rates use packaging and recycling data from the same year to provide the most accurate reporting of recycling rates.
Table 4: Packaging waste and recycling, split by material, UK, 2024 (thousand tonnes and percentage rate)
| Material | Packaging waste arising | Total recycled | Achieved recycling rate |
|---|---|---|---|
| Metal | 682 | 536 | 78.7% |
| — of which: Aluminium | 238 | 157 | 65.9% |
| — of which: Steel | 444 | 379 | 85.5% |
| Paper and cardboard | 4,838 | 4,069 | 84.1% |
| Glass | 2,223 | 1,759 | 79.1% |
| Plastic | 2,156 | 1,154 | 53.5% |
| Wood | 1,228 | 634 | 51.7% |
| Other* materials | 18 | 0 | 0.0% |
| Total (for recycling) | 11,145 | 8,154 | 73.2% |
Source: National Packaging Waste Database and Reported Packaging Data
Notes on Table 4:
- * Other includes materials such as cloth, corks, gel, glue, hessian sacks and wax used as packaging
- Percentages calculated using unrounded figures. Numbers may not add to exact totals. This is due to rounding
- There have been very minor revisions made to the 2024 National Packaging Waste Database figures
- Arisings data is sourced from the Reported Packaging Data system for H1 and H2 of 2024 (as submitted in October 2024 and April 2025). Data as of 7 July 2026
Table 4 shows the amount of packaging waste and the amount recycled broken down by material type for 2024. In 2024, 73.2% of UK packaging waste was recycled.
The highest recycling rate achieved in 2024 was 85.5% for steel, followed by 84.1% for paper and cardboard and 79.1% for glass.
Table 5: Provisional packaging waste and recycling, split by material, UK, 2025 (thousand tonnes and percentage rate).
| Material | Packaging waste arising | Total recycled | Achieved recycling rate |
|---|---|---|---|
| Metal | 665 | 521 | 78.4% |
| — of which: Aluminium | 247 | 151 | 61.1% |
| — of which: Steel | 419 | 371 | 88.5% |
| Paper and cardboard | 4,852 | 3,895 | 80.3% |
| Glass | 2,171 | 1,631 | 75.1% |
| Plastic | 2,108 | 1,207 | 57.3% |
| Wood | 1,239 | 541 | 43.7% |
| Other* materials | 25 | 0 | 0.0% |
| Total (for recycling) | 11,059 | 7,796 | 70.5% |
Source: National Packaging Waste Database and Reported Packaging Data
Notes on Table 5:
- * Other includes materials such as cloth, corks, gel, glue, hessian sacks and wax used as packaging
- Percentages calculated using unrounded figures. Numbers may not add to exact totals. This is due to rounding
- Arisings data is sourced from the Reported Packaging Data system for H1 and H2 of 2025 (as submitted in October 2025 and April 2026). Data as of 9 September 2026
Table 5 shows the amount of packaging waste, and the amount recycled broken down by material type for 2025. Provisional figures for 2025 show that 70.5% of UK packaging waste was recycled.
The highest recycling rate achieved in 2025 was 88.5% for steel, followed by 80.3% for paper and cardboard and 75.1% for glass.
The packaging waste arising data for 2025 is sourced from the Reported Packaging data system and the extract was taken on the 9 September 2026. This data is subject to change due to late submission and re submissions of data. These changes will result in changes to the recycling rates presented in Table 5 and the accompanying dataset, as was the case for revised 2024 recycling rates.
6. Recovery rate from non-hazardous construction and demolition (C&D) waste
Updated, with new 2023 England figures and provisional 2024 figures
Accurately quantifying construction and demolition (C&D) waste is challenging and whilst the absolute tonnage figures are subject to a relatively high level of uncertainty, there is not a significant impact on the final recovery rate.
The latest available figures for the UK are for 2020, and these can be found in the accompanying UK statistics on waste dataset. The latest figures for England are for 2024, and these figures are provisional due to the simple registrations and the volume of aggregate production data (provided by the Mineral Products Association) for 2024 not being available at the time of production of these figures; the 2023 data has therefore been used to calculate the figures.
Figure 3 shows the amount of non-hazardous construction and demolition waste generated and recovered for England.
Figure 3: Recovery rate from non-hazardous construction and demolition waste, England, 2010 to 2024 (million tonnes and percentage rate)
Source: Defra Statistics
Notes on Figure 3:
- *Estimates for 2024 are provisional due to the simple registrations and the volume of aggregate production data (provided by the Mineral Products Association) for 2024 not being available at the time of production of these figures. The 2023 data has therefore been used to calculate these figures
- Excludes excavation waste
- Percentages calculated using unrounded figures
- The Environment Agency permit data for England for 2019 onwards includes data on extra sites which is now being captured within the methodology
- For England, recovery is calculated as generation minus landfill
Download the data for Figure 3
Provisional figures for 2024 show that England generated 63.3 million tonnes of non-hazardous C&D waste, of which 60.3 million tonnes was recovered. This represents a recovery rate of 95.3% (Figure 3). The amount of non-hazardous C&D waste has remained similar over the past three years whilst the recovery rate has improved, continuing the general increase from 92% in 2016 to 95% by 2024.
7. Waste from commercial and industrial (C&I) activities
Updated, with new England figures for 2024
Defra previously worked closely with industry experts to improve the commercial and industrial (C&I) methodology for England (for details see Commercial and Industrial waste arisings methodology revisions for England). Nonetheless, C&I waste generation remains extremely difficult to estimate owing to data limitations and data gaps. As a result, C&I estimates for England have a much higher level of uncertainty than Waste from Households (or other Local Authority Collected Waste) and users should exercise caution in application of the figures and interpreting trends over time.
The methodology relies largely on known tonnages of waste processed at permitted sites and recycling facilities. It makes no attempt to estimate waste that may be processed at exempt sites that is not captured in the available recycling data. The term ‘commercial and industrial’ spans a range of economic activities including manufacturing, industrial processes and service-based enterprises, but excluding sewage sludge.
Estimates presented below are ‘as received’ tonnages and do not include an additional adjustment from wet weight to dry weight for sludges.
The latest available figures for the UK are for 2020, and these can be found in the accompanying UK statistics on waste dataset. The latest figures for England are for 2024.
Table 6 shows the amount of commercial and industrial waste generated in England.
Table 6: Total waste generated by the commercial and industrial sectors, England, 2019 to 2024 (million tonnes)
| Year | Commercial | Industrial | Total C&I |
|---|---|---|---|
| 2019 | 26.6 | 10.6 | 37.2 |
| 2020 | 24.3 | 9.4 | 33.7 |
| 2021 | 24.6 | 9.2 | 33.8 |
| 2022 | 24.1 | 9.5 | 33.6 |
| 2023 | 23.7 | 9.2 | 32.9 |
| 2024 | 22.7 | 9.3 | 32.0 |
Source: Defra statistics
Note on Table 6:
Revisions have been made to the 2021, 2022 and 2023 figures to take account of updated data and to correct an error in the calculations for 2023
England C&I sectors generated around 32 million tonnes of waste in 2024, a decrease of 3% from 2023 (Table 6). Over two-thirds of C&I waste is generated by the commercial sector. The amount of waste generated by C&I sectors decreased sharply between 2019 and 2020, but has continued to fall more gradually since then. Caution should generally be exercised in interpreting apparent year-on-year changes in the C&I data, owing to inherent uncertainties in the underlying data and methodology.
8. Total waste generation and final treatment of all waste
Updated, with provisional England figures for 2024
There are some differences between the C&I figures presented here, and those shown in the C&I section of this release (Section 7). For the purposes of the calculated total waste figures, sewage sludge is included in the C&I estimates. For the total waste generated and treated figures sludges are converted from wet to dry weight. The England 2024 figure for C&I that is incorporated in Table 7 is 30.8 million tonnes whilst the figure published in Table 6 on an ‘as received’ basis but excluding sewage sludge is 32 million tonnes. For more information please see the methodology section.
Total waste generation is split by material and the Nomenclature of Economic Activities (NACE) economic activity responsible for generating it. Users should be aware that ‘total waste’ includes all waste produced by the economy and is therefore much broader than frequently analysed subsets such as ‘municipal waste’ or ‘waste from households’. Users should also consider the varying natures and impacts of different waste materials included within total waste.
For the waste generation figures for England, the co-mingled recyclates collected exclusively from households have been separated into the individual materials using proportions derived from composition waste studies carried out by WRAP.
The latest available figures for the UK are for 2020, and these can be found in the accompanying UK statistics on waste dataset. The latest figures for England are for 2024, and these figures are provisional due to the non-hazardous construction and demolition estimates being provisional for 2024.
8.1 Waste generation
Provisional total waste generated figures are presented below for England for 2024.
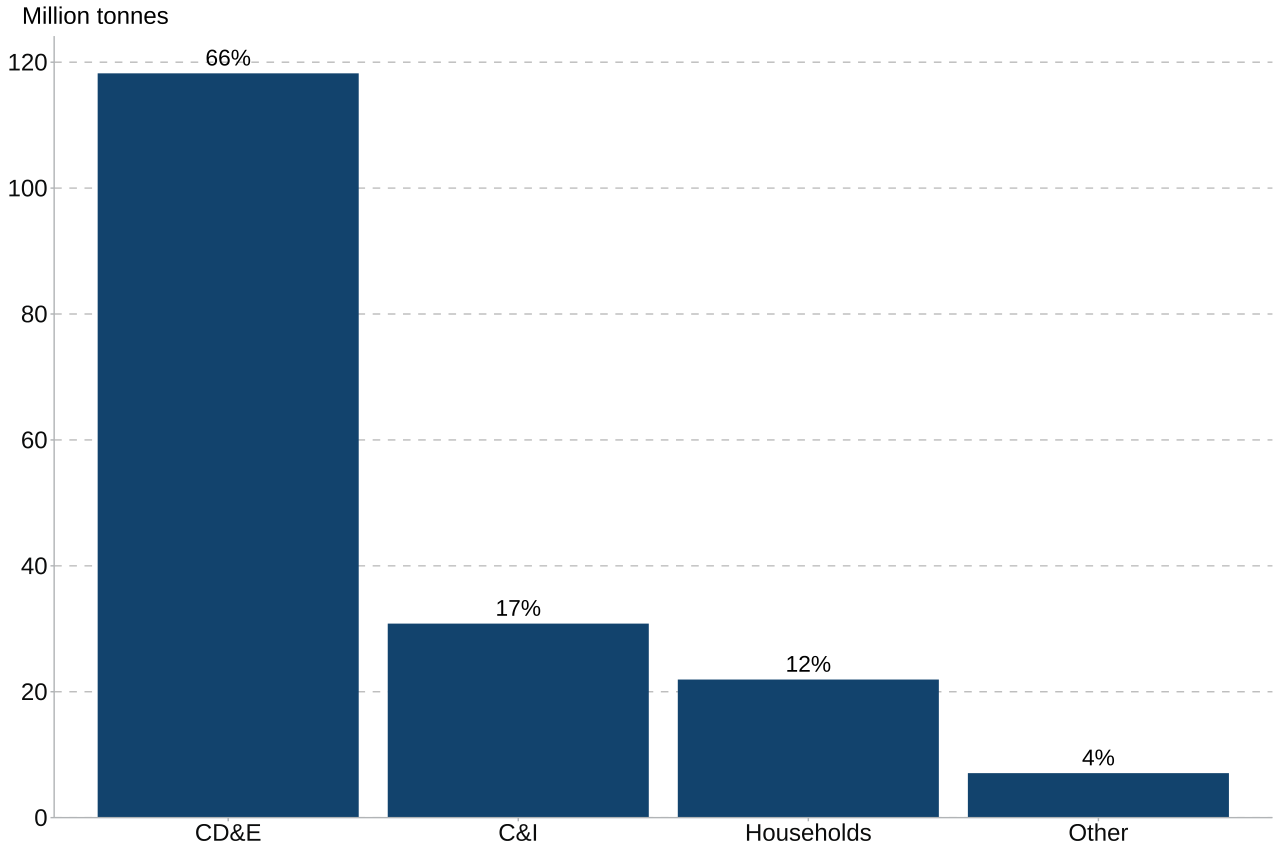
Figure 4 and Table 7 show that England provisionally generated 178.1 million tonnes of total waste in 2024, a decrease of 7% from the 191.5 million tonnes generated in 2022.
Figure 4: Waste generation split by source, England, 2024 (provisional)
Source: Defra Statistics
Notes on Figure 4:
- * Estimates for 2024 are provisional
- Percentages may not sum to exactly 100% due to rounding
- ‘Other’ consists of waste from mining, agriculture, forestry and fishing
- C&I figures presented here differ from those in the C&I section in that they include sewage sludge. However, for these figures, sludges are converted to dry weight, the C&I figures do not differ greatly from those presented in the C&I section
- CD&E figures include excavation waste and dredging
- Household figures are based on the waste from households measure
Download the data for Figure 4
Figure 4 shows the amount of waste generated split by source. Construction, demolition and excavation (CD&E; including dredging) generated 66% of total England waste in 2024. Commercial and Industrial (C&I) waste accounted for 17% of total waste generation and the remaining 16% was split between ‘Households’ (12%) and ‘Other’ activities (4%).
Note: The ‘Households’ measure quoted here is the waste from households measure, with mapping between the WasteDataFlow and EWC-STAT material categories.
Table 7: Waste generation split by responsible economic activity, England, 2022 to 2024 (million tonnes)
| Year | Commercial & industrial | Construction, demolition & excavation (includes dredging) | Households | Other | Total |
|---|---|---|---|---|---|
| 2022 | 32.6 | 132.1 | 21.5 | 5.3 | 191.5 |
| 2024* | 30.8 | 118.2 | 21.9 | 7.1 | 178.1 |
| Change (2022 to 2024*) | -5.4% | -10.5% | 2.2% | 32.5% | -7.0% |
Source: Defra Statistics
Notes on Table 7:
- Estimates for 2024 are provisional
- Includes waste that may go for export, but excludes waste imported from outside the UK
- ‘Other’ consists of waste from mining, agriculture, forestry and fishing
- Percentages calculated from unrounded figures; breakdowns may not exactly sum to totals due to rounding
The CD&E (including dredging) sector generated 118.2 million tonnes of waste in 2024, a decrease of 10.5% from the 132.1 million tonnes generated in 2022. The C&I sector also generated less waste in 2024, while households and other sectors generated more waste.
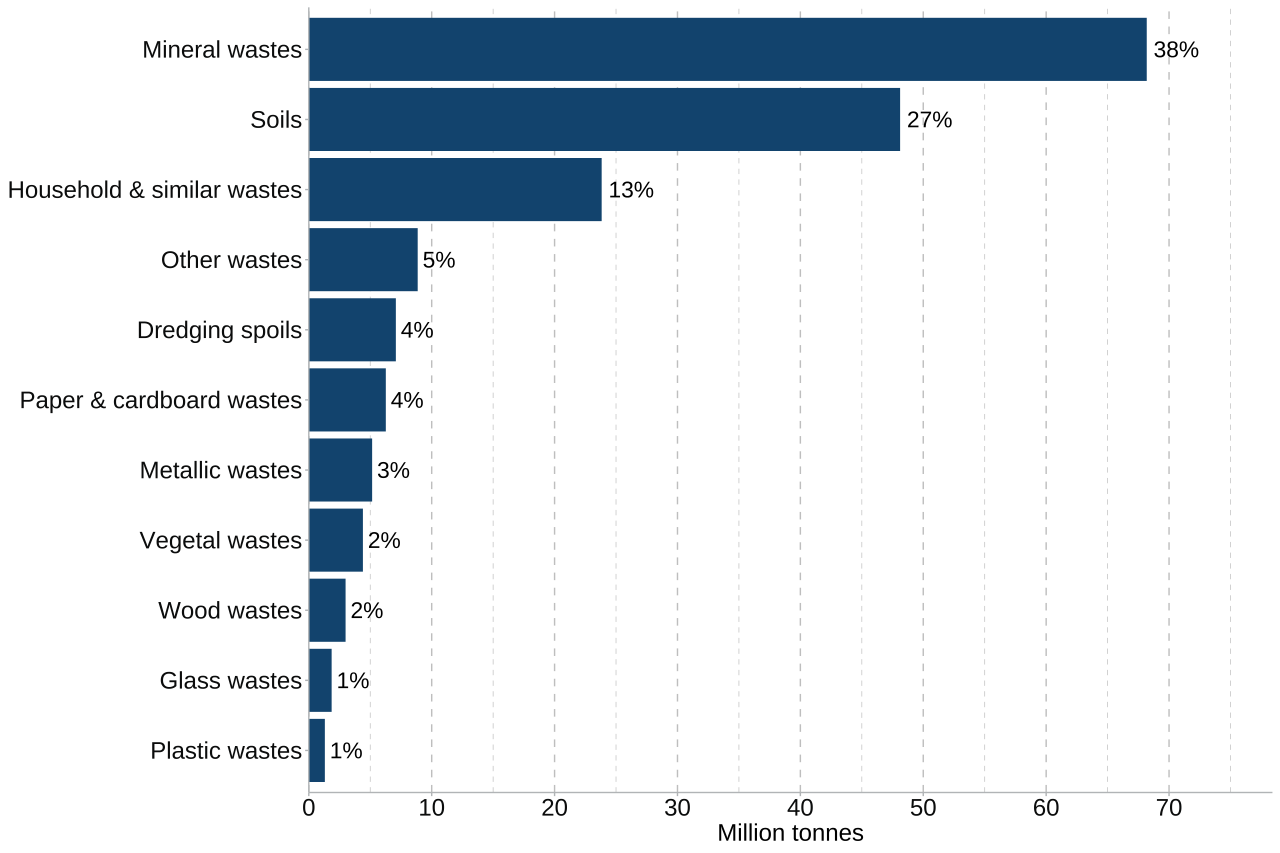
Note: Figure 5 splits all waste generated in England by waste materials, which are categorised by European Waste Catalogue (EWC) codes. Care should be taken when interpreting this information as some categories, for example, ‘Household & similar wastes’ will include mixtures of waste. As a result, an individual material stream such as ‘Plastic wastes’ will not represent total tonnages of plastic waste, because there will also be some in mixed waste streams (for example, black bag waste) that are categorised as ‘Household and similar wastes’.
Figure 5: Waste generation by waste material, England, 2024 (provisional)
Source: Defra Statistics
Notes on Figure 5:
- Estimates for 2024 are provisional
- Includes waste that may go on to be exported, but excludes waste imported from outside the UK
- Any type of waste can be generated by any economic activity. For example, ‘Household & similar wastes’ are not solely generated by ‘Households’
- Percentages may not sum to exactly 100% due to rounding
- A more detailed material split is available in the accompanying UK statistics on waste dataset
Download the data for Figure 5
Figure 5 shows the amount of waste generated split by material type. The largest waste material categories generated in England in 2024 were ‘Mineral wastes’ (68 million tonnes), and ‘Soils’ (48 million tonnes). Together, these make up 65% of total England waste.
8.2 Waste treatment
Provisional total waste treated figures are presented below for England for 2024.
Table 8 shows the total amount of waste at final treatment for England split by method. The total amount of waste treated in England was provisionally 178 million tonnes in 2024, a decrease of 8% from the 193.3 million tonnes in 2022.
Table 8: All waste at final treatment, split by method, England, 2022 to 2024 (million tonnes and percentage change)
| Method | 2022 | 2024* | Change (2022 to 2024*) |
|---|---|---|---|
| Recycling and other recovery | 98.8 | 98.4 | -0.3% |
| Incineration with energy recovery (R1)** | 8.4 | 8.9 | 4.9% |
| Incineration (excluding R1) | 8.7 | 9.4 | 7.6% |
| Backfilling | 11.2 | 10.0 | -10.8% |
| Landfill | 41.3 | 37.5 | -9.0% |
| Land treatment and release into water bodies | 25.0 | 13.9 | -44.5% |
| Total | 193.3 | 178.0 | -7.9% |
Source: Defra Statistics
Notes on Table 8:
- * Estimates for 2024 are provisional
- ** where formal R1 accreditation has been awarded
- Includes waste that may have been imported, but excludes waste exported for treatment outside the UK
- See methodology section for more details on the treatment categories
- Percentages calculated from unrounded figures; breakdowns may not exactly sum to totals due to rounding
Table 8 shows that ‘Recycling and other recovery’ was the most common final waste treatment type in England, accounting for 98.4 million tonnes (55.3%) in 2024. Around 70% of ‘Recycling and other recovery’ is recovery of mineral wastes and soils from the construction, demolition and excavation sector. The remainder is predominantly recycling (for example, glass, plastic, metal, wood, composting) but also includes some non-recycling activities that are not captured elsewhere, for example, wood used for biomass. Landfill is the second most used waste treatment in England, with 21.1% (37.5 million tonnes) of waste disposed of at landfill in 2024.
Energy recovery at facilities with R1 accreditation, in England, increased to 8.9 million tonnes in 2024 from 8.4 million tonnes in 2022.
Table 9: Material breakdown for each final treatment method, England, 2024 (proportion of tonnages)
| Material | Recycling and other recovery | Incineration with energy recovery (R1)* | Incineration (excluding R1) | Backfilling | Landfill | Land treatment and release into water bodies |
|---|---|---|---|---|---|---|
| Dredging spoils | 0% | 0% | 0% | 0% | 0% | 51% |
| Glass wastes | 1% | 0% | 0% | 0% | 0% | 0% |
| Household & similar wastes | 0% | 66% | 34% | 0% | 5% | 0% |
| Metallic wastes | 14% | 0% | 0% | 0% | 0% | 0% |
| Mineral wastes | 59% | 0% | 0% | 4% | 6% | 49% |
| Other wastes | 3% | 33% | 48% | 8% | 24% | 0% |
| Paper & cardboard wastes | 4% | 0% | 0% | 0% | 0% | 0% |
| Plastic wastes | 1% | 0% | 0% | 0% | 0% | 0% |
| Soils | 13% | 0% | 0% | 86% | 65% | 0% |
| Vegetal wastes | 3% | 0% | 0% | 0% | 0% | 0% |
| Wood wastes | 2% | 1% | 18% | 1% | 0% | 0% |
| Total | 100% | 100% | 100% | 100% | 100% | 100% |
Source: Defra Statistics
Notes on Table 9:
- Estimates for 2024 are provisional
- * where formal R1 accreditation has been awarded
- Includes waste that may have been imported, but excludes waste exported for treatment outside the UK
- ‘Recycling and other recovery’ is predominantly recycling (for example, glass, plastic, metal, wood, composting) but also includes some non-recycling activities that are not captured elsewhere, for example, wood used for biomass
- ‘Other wastes’ include residues following physical treatment and incineration of waste, residues from industrial processes and sewage. It also includes sorting residues and health care and biological wastes
Table 9 shows the material breakdown for each final treatment method in England in 2024. More than half (59%) of waste recorded as ‘recycling and other recovery’ is ‘mineral wastes’, while a further (13%) is ‘soils’. The ‘mineral wastes’ category is typically construction wastes such as bricks, stone and road planings that are converted into usable aggregates. ‘Metallic wastes’ is the second biggest material group at 14%, partially a reflection of their high value. The remaining tonnage going to ‘recycling and other recovery’ consists of a variety of material types that each make a small contribution.
‘Household & similar wastes’ make up 66% of waste treated at energy recovery facilities in 2024. Incineration without energy recovery has a different profile with only 48% of the waste accepted being ‘other wastes’ and 34% being classed as ‘household & similar wastes’.
The vast majority (86%) of ‘Backfilling’ is ‘soils’, with ‘other wastes’ being the next biggest contributor at 8%.
‘Soils’ make up 65% and ‘mineral wastes’ 6% of the tonnage received by landfills, demonstrating that it is not just residual waste using this outlet. The two other main components of landfilled waste are ‘other wastes’ (24% of the total) and ‘household & similar wastes’ (5%). The ‘other wastes’ category includes ‘sorting residues’ which will typically be mixed wastes following processing to remove recyclates.
A more detailed material split along with 2010, 2012, 2014, 2016, 2018, 2020 and 2022 (England only) are available in the accompanying UK statistics on waste dataset.
Note: Generation and final treatment are at opposite ends of what can be a complex and multiple staged treatment process. Different methodology is used to estimate generation and final treatment figures. Furthermore, final treatment excludes some treatment processes identified as predominantly intermediate, which nevertheless may effectively be the final treatment for some waste. As a result, there is no direct reconciliation between generation and final treatment of total waste. Users should also be aware that in most cases it is not possible to estimate the final treatment of waste generated by specific economic activities. Users should take care to understand the material and economic activity categories. Further information is available in the methodology section and the useful links section.
9. Waste infrastructure
Updated, with new England figures for 2024
Defra collates summaries from the environment agencies of all four UK countries on facilities authorised by mandatory permit or license. Capacity is based on the level authorised by permit or license with the exception of some small-scale incinerators where the permit did not feature capacity. In these cases, operational capacity is used. See the methodology section for more detail.
The latest available figures for the UK are for 2020, and these can be found in the accompanying UK statistics on waste dataset. The latest figures for England are for 2024.
Table 10 shows the number and capacity of permitted final treatment facilities in England for 2022 and 2024. From 2022 to 2024, energy recovery facilities with R1 accreditation in England increased in number from 28 to 38, with capacity increasing from 9 million tonnes to 10.1 million tonnes per year.
Table 10: Number and capacity of permitted final treatment facilities, England, 2022 to 2024
| Facility type | Measure | 2022 | 2024 |
|---|---|---|---|
| Recovery other than energy recovery (includes backfilling) | Number of facilities | 1,640 | 1,525 |
| Energy recovery (R1) | Number of facilities | 28 | 38 |
| Capacity (thousand tonnes per year) | 8,968 | 10,065 | |
| Incineration (excluding R1) | Number of facilities | 75 | 66 |
| Capacity (thousand tonnes per year) | 12,490 | 12,270 | |
| Deposit onto or into land (landfill) | Number of facilities | 533 | 541 |
| Rest (remaining) capacity (thousand m3) | 345,742 | 300,298 |
Source: Defra Statistics
Notes on Table 10:
- Energy recovery refers to facilities where the main purpose is generation of energy and formal R1 accreditation has been awarded
- Excludes: Recovery facilities operating solely under a waste exemption; facilities permitted only for intermediate treatment (including most anaerobic digesters); facilities that were formally closed throughout 2024 (except landfills)
Download the data for Table 10
10. What you need to know about this release
10.1 Contact details
Responsible statisticians: Katherine Merrett and Adele Storr
Email: WasteStatistics@Defra.gov.uk
Media enquiries: 0330 041 6560 (Defra Press Office) or refer to Defra’s media enquiries page.
10.2 Official Statistics
This is an Official Statistics publication. Our statistical practice is regulated by the Office for Statistics Regulation (OSR). OSR sets the standards of trustworthiness, quality and value in the Code of Practice for Statistics that all producers of official statistics should adhere to. You can read about how Official Statistics in Defra comply with these standards on the Defra Statistics website.
You are welcome to contact us directly with any comments about how we meet these standards using the contact details above. Alternatively, you can contact OSR by emailing regulation@statistics.gov.uk or via the OSR website.
11. About these statistics
11.1 User statement
Data on waste generation and management is collected to monitor policy effectiveness and to support policy development. The data are used extensively by local and central government, the waste industry, academia and the public.
11.2 Feedback
We welcome feedback on the data from all users including how and why the data is used. This helps us to understand the value of the statistics to external users. Please see our contact details section of this notice.
11.3 Methodology
Waste from Households (WfH)
Waste from households is the agreed harmonised UK measure used to report household recycling. Waste management and recycling is a devolved matter and different countries have used their own data to adopt the definition.
Waste from households includes waste from:
- Regular household collection
- Civic amenity sites
- ‘Bulky waste’
- ‘Other household waste’
Waste from households excludes waste from:
- Street cleaning and/or sweeping
- Gully emptying
- Separately collected healthcare waste
- Soil, Rubble, Plasterboard and Asbestos waste
All UK countries base the waste from households measure on output from the WasteDataFlow database, which records Local Authority Collected Waste. Whilst the general approach and principles of the calculation is consistent across UK countries, there may be some differences in the specifics of the calculations as there are some differences in the structure and wording of some of the questions.
Users should be aware that individual UK countries other than England publish their own independent national household recycling estimates other than the waste from households recycling rate. Local authorities in England may also use an alternative measure.
A change was introduced from the February 2018 release to include metal recovered and recycled after incineration as recycling, instead of being reported as ‘recovery’. The amount this contributes to recycling depends on the amount of the residual waste being incinerated and the metal content of the residual waste.
Inclusion of IBA metal has been facilitated through the new Q100 reporting structure for waste treatment which all local authorities have been using since April 2015. This has provided the opportunity for more complete recording of waste treatment, including outputs from incineration. The majority of local authorities are reporting more fully, but not in all cases. While reporting and associated quality assurance are developing and being refined, the figures need to be regarded as more indicative until it becomes fully established and embedded.
This methodological change for IBA metal has been applied to all UK countries from 2015. England data only includes IBA metal from April 2015, when Q100 came into full use by all local authorities. For Wales, Q100 was introduced in 2012 and IBA metals have been included from 2015 in line with the other UK countries. Northern Ireland did not have any incinerators that burnt local authority collected municipal waste in these years and so their figures are unaffected by the change.
At an overall UK level this change in methodology raised the recycling rate for 2024 by around 0.9 percentage points (equivalent to 250,000 tonnes).
In this September 2026 release, revisions have been made to the 2023 England figures to include final reported data for one local authority and minor updates to another local authority. Revisions have been made to the Scotland figures for 2023 due to a methodological change which has improved the capture of metal outputs from incineration processes. The result is a small decrease in other diversion of waste from landfill and an increase in recycling of waste for some local authorities.
Biodegradable municipal waste (BMW) to landfill
UK estimates for biodegradable municipal waste (BMW) to landfill have been calculated using a UK wide approach in accordance with relevant legislation. Biodegradable municipal waste is the fraction of municipal waste that will degrade within a landfill site. Amongst other materials it will include food waste, green waste, cardboard and paper.
Tonnage data is collated from mandatory returns made for landfills to the Environment Agencies of each of the four UK countries. Tonnages are split by European Waste Catalogue (EWC) categorisation codes, as determined by landfill operators. For this reporting obligation, the UK countries have agreed a set of EWC codes to represent ‘municipal waste’. Scotland applies a factor to EWC code 19 12 12 on the basis that only a proportion is ‘municipal’, however other countries do not do this. Scotland include some additional EWC codes.
Factors on the proportion of waste that is biodegradable are applied to each code. Countries use broadly similar, but non-identical sets of factors.
The factors are multiplied by the tonnages and then summed to give final country level estimates for BMW to landfill. New factors were adopted by England in 2014 for the two EWC codes that dominate Municipal Waste, based upon a commissioned study of landfill waste composition. All England figures published here have been produced using these new factors. Wales adopted these new factors from 2013 and backdated their estimates for 2010 to 2012.
Details of the waste codes considered to be municipal and the associated biodegradability factors can be found in the biodegradable municipal waste to landfill methodology note.
Packaging waste
UK calculations for recycling of packaging waste are made at a UK level.
UK recycling rates for packaging materials are calculated based on the amount of packaging reported as being recycled under the regulations and the total amount of packaging materials estimated to be placed on the UK market in each year.
Estimates of tonnages recycled in each year are based on Packaging Recovery Notes (PRNs) and Packaging Export Recovery Notes (PERNs) reported to the Environment Agency relevant regulator and held in the National Packaging Waste Database (NPWD). Obligated producers, or compliance schemes on their behalf, acquire PRNs and PERNs from accredited reprocessors and exporters. All packaging producers that have a turnover of at least £2 million and handle at least 50 tonnes of packaging per year are required to obtain sufficient PRNs and/or PERNs to evidence that they meet their individual recycling obligations. The recycling / recovery targets on producers are set by government and prior to the UK leaving the European Union are set to ensure that Northern Ireland continues to comply with the aggregated obligation for all producers was sufficient to ensure the UK met the Packaging and Packaging Waste Directive targets as required by the Windsor Framework.
Packaging Extended Producer Responsibility (pEPR) came into force on 1 January 2025, and with the data regulations, provides new data on total packaging supplied and placed on the UK market by obligated producers. This new data source is used as the packaging waste arising figures presented in this release and the accompanying UK statistics on waste dataset from 2024 onwards. The arising data is the total reported tonnages by large and small producers into Reported Packaging Data (RPD) system for H1 and H2 (submitted October 2025 and April 2026 for the 2025 reporting period).
The pEPR regulations have moved to a single point of obligation (from the previous shared system) and also includes a ‘Distributor’ category. Due to this and the small producer requirement to report data, it is now assumed that nearly all packaging is in scope and should be reported by producers. This means that the full RPD provides an alternative for the total packaging supplied.
The total packaging supplied (arisings) figures for all years exclude exports but include filled and unfilled imports. Because these estimates are recorded at point of manufacture, materials are all separately identifiable and therefore may appear large in comparison to material type estimates based on collected waste, where a substantial proportion of packaging waste will be captured under mixed waste categories.
The historic time series (2012 to 2024) presented in the accompanying UK statistics on waste dataset use a different data source for the packaging waste arising figures. Estimates of total packaging supplied (placed on the market) were based on data from the latest iteration of the PackFlow report. PackFlow was a report commissioned by Defra to provide information on the total flows of packaging in the UK and has historically been used to estimate the total amount of material placed on the market.
In this September 2026 release, there have been minor revisions made to the 2024 National Packaging Waste Database figures. There have also been revisions made to the 2024 Reported Packaging Data.
Recovery rate from non-hazardous construction and demolition (C&D) waste
Accurately quantifying construction and demolition (C&D) waste is challenging and whilst the absolute tonnage figures are subject to a relatively high level of uncertainty, sensitivity analysis suggests there is not a significant impact on the final recovery rate. Whilst efforts were made to synchronise approaches across UK countries, methodologies are not identical. The England methodology was originally devised in conjunction with industry. Estimates are dependent on several key assumptions relating to the role of permitted sites, simple registrations and the volume of aggregate production (this data is provided by the Mineral Products Association). Within the UK, some C&D waste is transferred across borders for treatment, primarily into England. This may slightly inflate the England recovery rate and deflate rates for Devolved Administrations.
Due to a cyber-attack, C&D estimates for Scotland are not available for 2019 and 2020. To calculate a UK figure for 2019 and 2020, the 2018 data for Scotland has been used for 2019 and the 2021 Scotland figure has been used for 2020.
Waste from commercial and industrial (C&I) activities
Data sources and detailed approaches may differ slightly between UK countries, but overarching principles will be consistent.
For the purpose of this statistics release, C&I is defined as a specific collection of economic activities described by NACE (‘statistical classification of economic activities in the European Community’). Those considered to be C&I here are (for details see the Europa List of NACE Codes):
- C-Manufacturing
- D-Electricity, gas, steam and air conditioning supply
- E36, E37 and E39-Water collection, treatment and supply, sewerage, remediation activities and other waste management services (excluding sewage sludge)
- G-U excluding G4677-Services (except wholesale of waste and scrap)
While considerable effort has been spent reviewing the methodology for England, this remains a very challenging area. Data revisions published in December 2016 identified outstanding issues with the original ‘Reconcile’ methodology. Defra took this opportunity to develop a further modified version alongside industry experts, which was felt to improve the transparency of the methodology and better reflect current waste management processes. The latest methodology has been developed with considerable input from industry experts and sense-checked against alternative data sources. As the historical data has been revised using the same methodology, some conclusions can be drawn from changes between years; however caution should still be exercised. Full details of the current methodology are available in the Commercial and Industrial waste arisings methodology revisions for England report.
Due to a cyber-attack, C&I estimates for Scotland are not available for 2020. To calculate a UK figure for 2020, the 2018 data for Scotland has been used for 2020.
In this September 2026 release, revisions have been made to the 2021, 2022 and 2023 England figures to take account of updated data and to correct an error in the calculations for 2023.
Total waste generation and final treatment of total waste
Total waste generated and treated figures were originally calculated in accordance with the EC Waste Statistics Regulation.
The UK estimates for generation and final treatment of total waste are built up from a large number of estimation processes and draw upon data from WasteDataFlow, Environment Agency permitted site returns and many other sources. Whilst efforts are made to synchronise approaches across UK countries, methodological differences do exist for construction, demolition and excavation (CD&E) and C&I waste. All sludges and dredging spoils have been reported dry weight (requiring conversion in some cases). The estimates are primarily designed for reporting at a UK level rather than comparison between UK countries.
The CD&E figures include excavation waste and dredging spoils that are out of scope for the recovery rate shown in Section 6 of this release. ‘Household’ figures are based on the same waste from households measure shown in Section 3, with slight adjustments made to map to the EWC-STAT material categories. Where specific materials (such as glass and plastic) are reported, they represent separately identifiable materials. Residual waste categories will also include some of these materials in a less usable form. Estimates for tonnages received by landfill here are based on Environment Agency permitted site returns and differ from estimates published in HMRC Landfill Tax Bulletins which are sourced from landfill tax receipts.
Treatment categories[footnote 1] are:
- Recovery means ‘any operation the principal result of which is waste serving a useful purpose by replacing other materials which would otherwise have been used to fulfil a particular function’
- Recycling is a subset of recovery and means ‘any recovery operation by which waste materials are reprocessed into products, materials or substances whether for the original or other purposes’. It includes the reprocessing of organic material (for example, composting and anaerobic digestion) but excludes the use as fuels and the use for backfilling operations
- Energy recovery refers to facilities where the main purpose is generation of energy, and formal R1 accreditation has been awarded. Only a subset of these are dedicated to the processing of ‘municipal waste’. Facilities without formal R1 accreditation are reported as ‘Incineration’ rather than ‘Energy Recovery’ even if they produce some energy
- Backfilling means ‘a recovery operation where waste is used in excavated areas (such as underground mines, gravel pits) for the purpose of slope reclamation or safety or for engineering purposes in landscaping and where the waste is substituting other non-waste materials which would have had to be used for the purpose’
- Disposal means ‘any operation which is not recovery even where the operation has as a secondary consequence the reclamation of substances or energy’ (for example, landfill, incineration)
Waste generation and treatment are estimated by separate processes and use multiple different data sources which are based largely on administrative data sources. Elements of the calculations will use assumptions where there are data gaps so the figures for generation and treatment will not exactly correlate.
Both generation and final treatment of waste can also be split into hazardous and non-hazardous wastes. The full data covering 2010 to 2024 for England and 2010 to 2020 for the UK, can be found in the accompanying UK statistics on waste dataset.
Due to a cyber-attack, not all data is available for 2020 for Scotland. The 2018 total waste generated and treated for Scotland has been used for 2020 in most cases. Data for 2020 has been used for the following:
- Waste generation: waste from households, dredging, mining and sewage
- Waste treatment: amount of waste incinerated, amount of waste landfilled, and the amount of dredging and mining waste treated
For 2020, no updated C&I waste survey data was available for Wales. Wales did not re-gross their C&I survey estimates for 2020 given the uncertainty of the COVID-19 pandemic on waste arisings. Therefore the 2018 waste generated data for C&I has been used for 2020 for Wales.
In this September 2026 release, revisions have been made to the 2020 total waste generated and treated figures for England and the UK to correct an error in the mining waste calculations. There have also been revisions to the 2022 England total waste generated and treated figures to incorporate revised 2022 commercial and industrial waste arising figures and to correct an error in the mining waste calculations.
Waste infrastructure
The waste infrastructure figures were originally calculated in accordance with the EC Waste Statistics Regulation. Information on infrastructure is based on mandatory reporting of permitted and licensed sites for waste treatment which is collated by the environment agencies in each of the countries in the UK. Categories are defined according to EC guidance. The ‘Energy Recovery’ category only includes facilities where the primary function is generating energy (for example, cement kilns) and Municipal Waste Incinerators that have applied for and been granted formal R1 accreditation (an EC standard on efficiency factors) by the relevant Environment Agency. Small scale ‘LAPPC’ (Local Authority Pollution Prevention and Control) incinerators in England have not been included as sufficiently detailed data is not available.
The data excludes facilities that were formally closed throughout 2024 (except landfills) but may include facilities which despite being permitted were non-operational in 2024. Facilities permitted only for treatment operations that are identified as intermediate (which includes most anaerobic digesters) are excluded.
Recovery operations covered by simple exemptions or simple registrations are not included. These operations are classed as low risk or low volume and operators do not have to report activity to Environment Agencies. The permitted capacity of Energy Recovery and Incineration facilities includes municipal and C&I waste and will be higher than the actual volume of waste treated.
11.4 Revisions policy
Defra will provide information about any revisions made to published information in this statistics release and the associated datasets. Revisions could occur for various reasons, including when data from third parties is unavailable or provisional at the time of publishing or if there are subsequent methodological improvements or refinements.
12. Useful links
- Scottish Government statistics
- Welsh Government statistics
- Northern Ireland Department of Agriculture, Environment and Rural Affairs statistics
- Environment Agency home page
- Waste Data Interrogator
- WasteDataFlow portal
- Estimates of Commercial and Industrial Waste Generation in England (‘Reconcile’ project)
- England C&I Methodology paper
- Analysis of biodegradability of residual waste project (WA0214)
- WRAP study quantifying composition of municipal waste at point of collection for 2017
- Manual on Waste Statistics
- EWC-STAT (used for Waste Statistics Regulation waste types)
- List of NACE codes (used for Waste Statistics Regulation economic activities)
- List of Waste (European Waste Catalogue codes)
- National Packaging Waste Database
-
Further detail on treatment categories can be found in the Manual on Waste Statistics ↩