Universal Credit and Child Tax Credit claimants: statistics related to the policy to provide support for a maximum of two children, April 2024
Published 11 July 2024

© Crown copyright 2024
This publication is licensed under the terms of the Open Government Licence v3.0 except where otherwise stated. To view this licence, visit nationalarchives.gov.uk/doc/open-government-licence/version/3 or write to the Information Policy Team, The National Archives, Kew, London TW9 4DU, or email: psi@nationalarchives.gov.uk.
Where we have identified any third party copyright information you will need to obtain permission from the copyright holders concerned.
This publication is available at https://www.gov.uk/government/statistics/universal-credit-and-child-tax-credit-claimants-statistics-related-to-the-policy-to-provide-support-for-a-maximum-of-2-children-april-2024/universal-credit-and-child-tax-credit-claimants-statistics-related-to-the-policy-to-provide-support-for-a-maximum-of-two-children-april-2024
Coverage: United Kingdom.
Main Stories
The statistics show:
- in April 2024, there were 380,000 Universal Credit households that had a third or subsequent child born on or after 6 April 2017, and 71,000 Child Tax Credits households, a total of 450,000
- 370,000 Universal Credit households and 69,000 Child Tax Credit households (a total of 440,000 households) were not receiving the child element or amount for at least one child because of the policy to provide support for a maximum of two children
- there was a total of 1.3 million children living in a Universal Credit household and 270,000 children living in a Child Tax Credit household (a total of 1.6 million children) that was not receiving a child element or amount for at least one child due to being affected by the policy
- 24,000 households that had a third or subsequent child born on or after 6 April 2017 were in receipt of an exception
- the most common reason for an exception was for multiple births (16,000 or 69% of those with an exception)
- the number of households affected by the policy has increased since the first statistics were published in 2018, as more children have been born since 6 April 2017 into families with at least two children
What you should know
Since 6 April 2017, families on Universal Credit or Child Tax Credit have been able to claim support for up to two children. There is further entitlement for third or subsequent children if they were born before 6 April 2017 or if an exception applies.
There are four categories of exception:
- additional children in a multiple birth where an extra amount will be payable for all children in a multiple birth other than the first child
- likely to have been born as a result of non-consensual conception, which for this purpose includes rape or where the claimant was in a controlling or coercive relationship with the child’s other biological parent at the time of conception
An exception also applies for any children in a household who are:
- adopted when they would otherwise be in local authority care
- in non-parental caring arrangements when they would otherwise be at risk of entering the care system, including where a child (under 16) has a child
Further information and guidance on these statistics is available in the background information and methodology document.
Overall numbers of households affected by the policy to provide support for a maximum of two children
In April 2024, there were 720,000 households with three or more children claiming either Universal Credit (570,000) or Child Tax Credit (150,000).
Of these, 450,000 households across UC and CTC were affected by the policy to provide support for a maximum of two children (see Table 1). 440,000 households (97%) were not receiving a child element or amount for at least one child in their household, and 24,000 households (5%) were receiving an exception to the policy. Please note that there are households both not receiving a child element/amount for one child and in receipt of an exception for another child.
A household is affected by the policy if they are on Universal Credit (UC) or Child Tax Credit (CTC) and have at least 3 children, and at least one child was born on or after 6th April 2017.
Most households affected were in receipt of UC (84%). The proportion of affected households that are on CTC is expected to fall as CTC households move over to UC throughout 2024/25.
The 450,000 households affected by the policy represents 63% of all households with a third or subsequent child claiming UC or CTC. This proportion will grow over time as more households with three or more children will include a child born on or after 6 April 2017.
Table 1: Total number of households in receipt of Universal Credit or Child Tax Credit affected by the policy to provide support for a maximum of two children, April 2024
| Total | Universal Credit | Child Tax Credit | |
|---|---|---|---|
| All households in receipt of UC or CTC with three or more children | 720,000 | 570,000 | 150,000 |
| Affected households (reporting a third or subsequent child on or after 6 April 2017) | 450,000 | 380,000 | 71,000 |
| Households not receiving a child element/amount for at least one child | 440,000 | 370,000 | 69,000 |
| Households in receipt of an exception | 24,000 | 21,000 | 3,100 |
Note: UC figures are for GB only; CTC figures are for the UK; Affected households figures do not equal the sum of the two components below as there are households both not receiving a child element/amount for one child and in receipt of an exception for another child.
Overall numbers of households with an exception
In April 2024, 21,000 households claiming Universal Credit and 3,100 households claiming Child Tax Credit were in receipt of at least one exception (see Table 2).
Across both UC and CTC, 16,000 households (69% of households with an exception) received a multiple birth exception, 3,200 households (13% of households with an exception) received a non-parental care exception, 3,100 households (13% of households with an exception) received a non-consensual conception exception, 1,200 households (5% of households with an exception) received an adoption exception.
Table 2: Number of households in receipt of Universal Credit or Child Tax Credit with an exception to the policy to provide support for a maximum of two children, by category, April 2024
| Total | Universal Credit | Child Tax Credit | |
|---|---|---|---|
| Total - Households in receipt of an exception | 24,000 | 21,000 | 3,100 |
| Multiple birth | 16,000 | 14,000 | 2,000 |
| Non-parental care | 3,200 | 2,600 | 540 |
| Adoption | 1,200 | 1,200 | 40 |
| Non-consensual conception | 3,100 | 2,600 | 500 |
Note: UC figures are for GB only; CTC figures are for the UK; The Total does not equal the sum of the components as there are a number of households that have exceptions in more than one category.
Households affected by the policy to provide support for a maximum of two children, by work status
59% of claimants affected by the policy, or 270,000, are in-work (Figure 1). “In work” is defined as eligible for Working Tax Credit within the tax credit system, or in receipt of employment income within Universal Credit.
230,000 affected UC households are in work, equating to 60% of UC households affected by the policy. This is a higher proportion than those on CTC, where 39,000 affected CTC households are in work, which is 55% of CTC households affected by the policy.
A slightly lower proportion of households with an exception are in work (53%) compared to those without an exception for at least one child (60%).
Figure 1: Households affected by the policy to provide support for a maximum of two children, by work status, April 2024

Note: UC figures are for GB only; CTC figures are for the UK.
Households affected by the policy to provide support for a maximum of two children, by number of adults
About half (52%) of Universal Credit or Child Tax Credit households affected by the policy, or 230,000, are single adult households, and about half (48% or 220,000) are couples (Figure 2). The proportion of couples in affected households is higher in Child Tax Credit (60%) than in Universal Credit (46%).
Figure 2: Households affected by the policy to provide support for a maximum of two children, by number of adults, April 2024
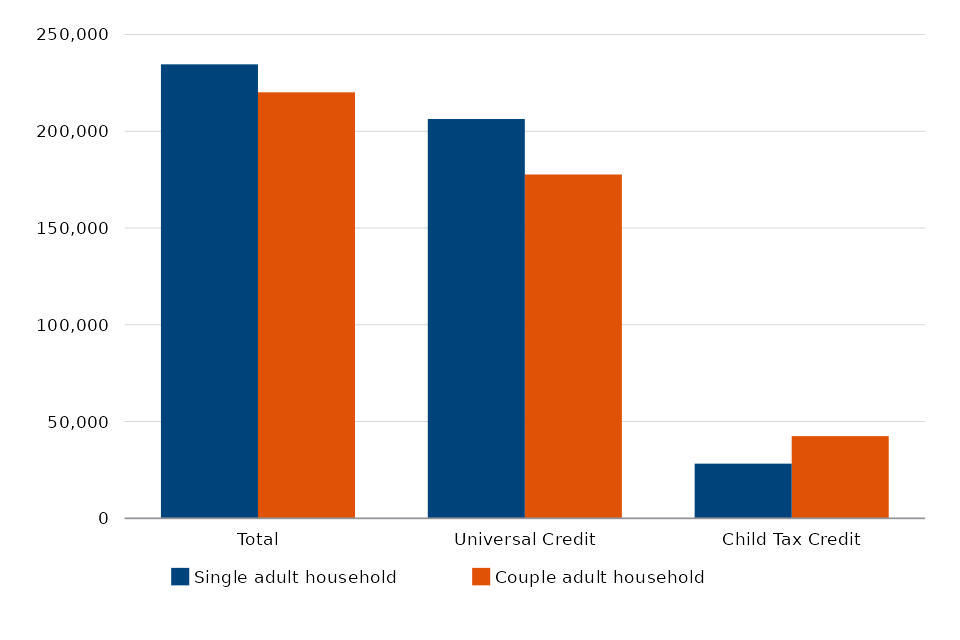
Note: UC figures are for GB only; CTC figures are for the UK.
Households affected by the policy to provide support for a maximum of two children, by country
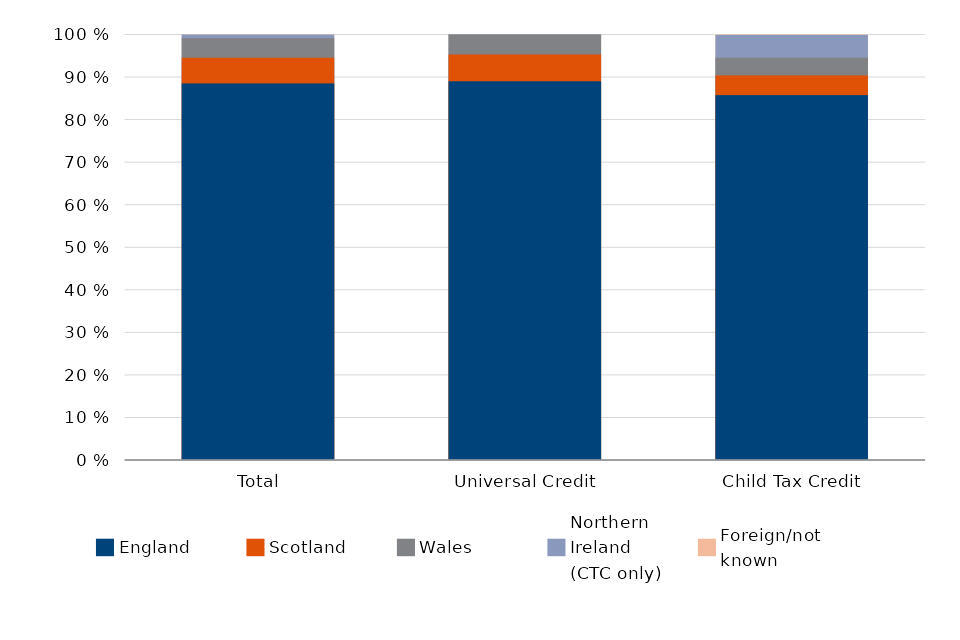
400,000 (89%) UC and CTC households affected by the policy were residents in England in April 2024 (Figures 3 and 4), as were 27,000 (6%) in Scotland, and 21,000 (5%) in Wales. 3,800 (5% of CTC) were CTC recipients in Northern Ireland. A small number of CTC claimants (80) were either resident abroad or their country could not be identified from the data.
5% of households in England who were affected by the policy were in receipt of an exception in April 2024, as did 6% of households in Scotland, 6% of households in Wales and 4% of CTC households in Northern Ireland.
Figure 3: Households affected by the policy to provide support for a maximum of two children, by country, April 2024
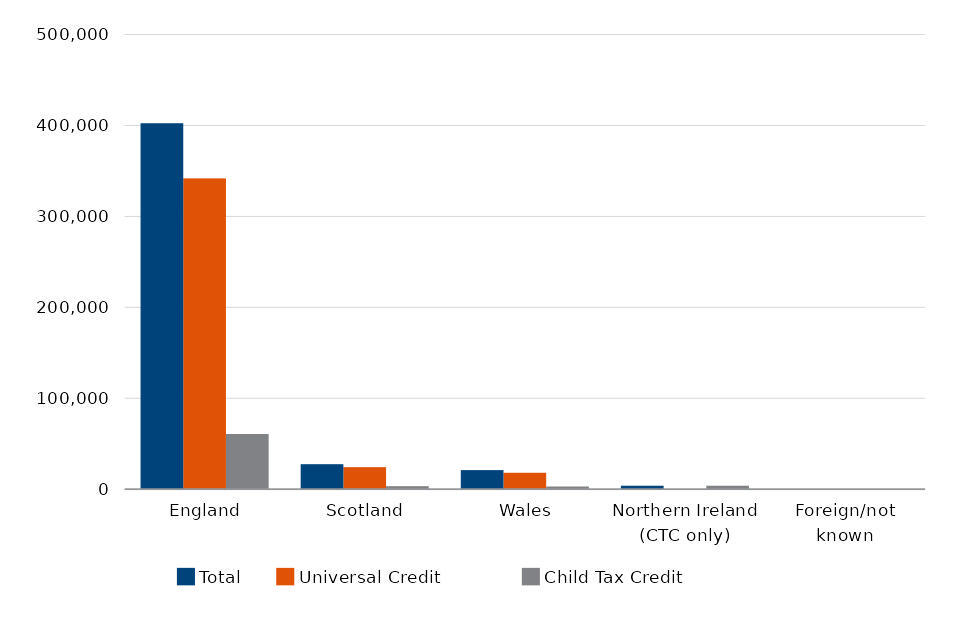
Figure 4: Proportion of households affected by the policy to provide support for a maximum of two children, by country, April 2024
Households with an exception to the policy to provide support for a maximum of two children, by country and exception category
Across all countries of the UK in April 2024, households with a multiple birth were the most common type of exception, accounting for 69% of UC or CTC households with an exception in England, 70% of households in Scotland, 68% of households in Wales and 75% of CTC households in Northern Ireland (Figure 5). Given small population sizes it is not recommended to draw robust conclusions from the differing proportions of households with other types of exceptions by country, due to both rounding and the suppression of small numbers of cases. As noted earlier, in future years the numbers affected by the policy, and the numbers of exceptions, are expected to increase.
Figure 5: Proportion of exceptions to the policy in each country by exception category, April 2024
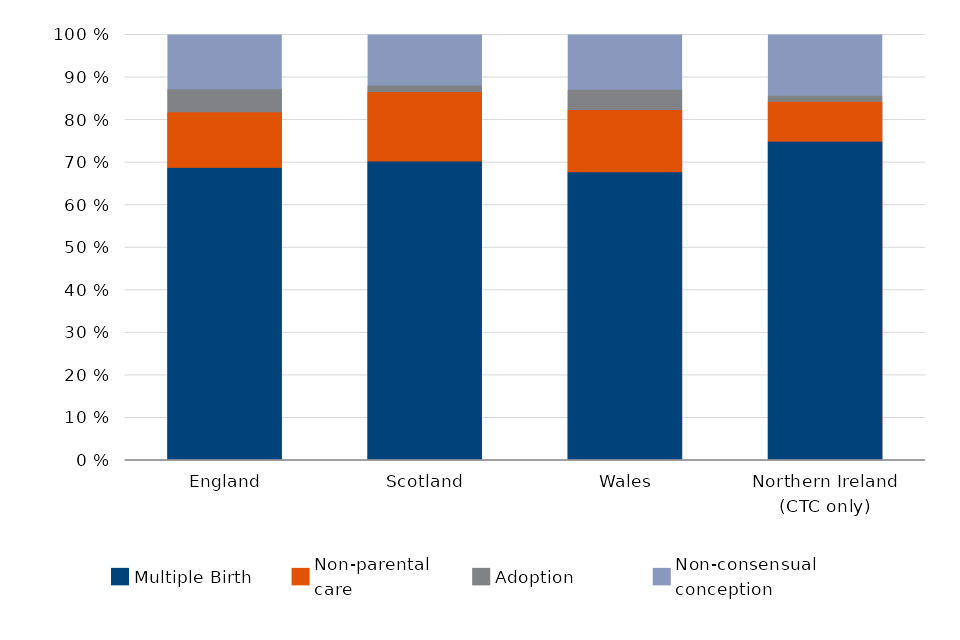
Note: A small number of households have exceptions in more than one category.
Households affected by the policy to provide support for a maximum of two children, by region
The London region contains the largest number of households that are affected by the policy with a total of 69,000 households being affected (Figure 6). Within Great Britain, the North East region contains the lowest number of households affected by the policy with a total of 20,000 households affected. CTC claimants are the only households reported here as affected by the policy in Northern Ireland, which consequently contains the lowest number of households affected by the policy in the UK with a total of 3,800.
The proportion of households not receiving a child element/amount for all regions lies between 95% and 99% of all households affected by the policy, with no clear disparities between regions (Figure 7). Similarly, the proportion of households with an exception lies between 3 and 7% of all households affected across all regions. A consistent 2% of all households affected across each region are both not receiving a child element/amount for at least one third or subsequent child, and have an exception for at least one other child.
Figure 6: Number of households affected by the policy to provide support for a maximum of two children, by region, April 2024
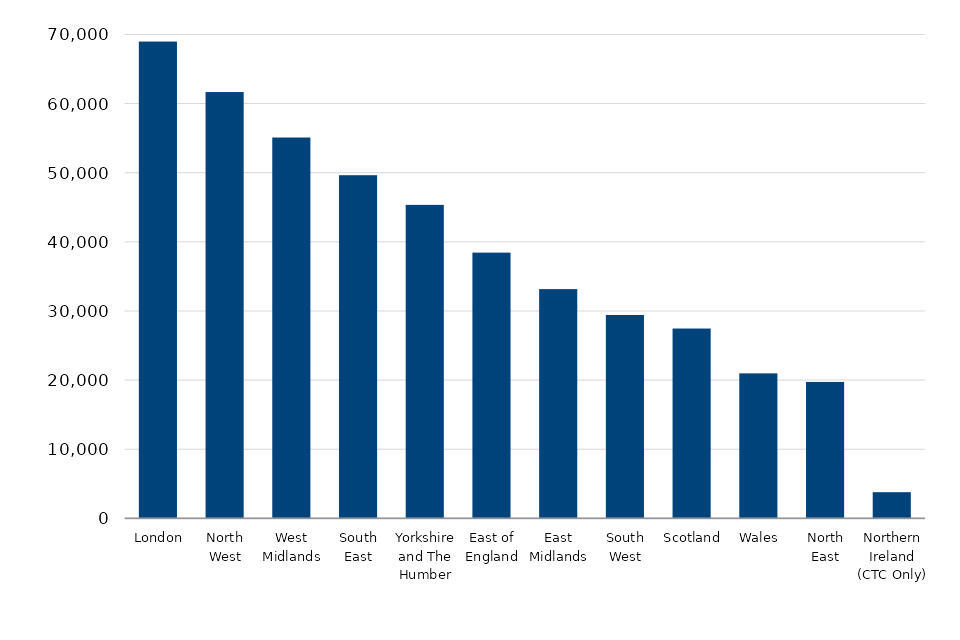
Note: For a small number of UC households, information on their region is not available.
Figure 7: Proportion of households affected by the policy to provide support for a maximum of 2 children, by region, April 2024
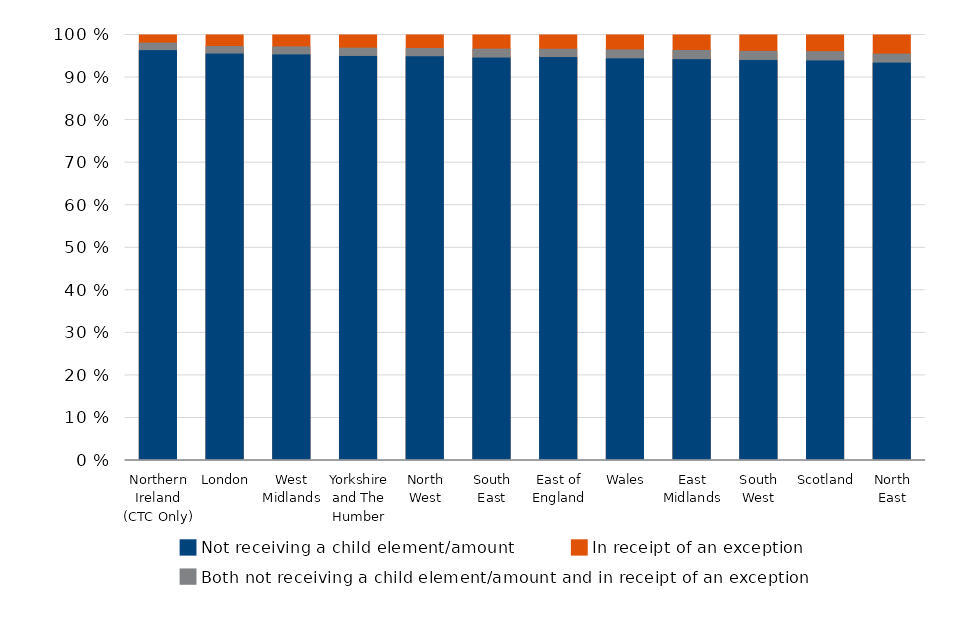
Note: For a small number of UC households, information on their region is not available.
Households with an exception to the policy to provide support for a maximum of two children, by region and category
There are 12 first level regions in the UK, 9 such regions in England, together with Scotland, Wales, and Northern Ireland. In line with the national picture, the most common exception across all regions is the multiple birth exception whilst the least common exception is adoption. The region with the largest number of households with exceptions to the policy is the North West (with 3,200), whereas in GB Wales has the fewest with 1,200 (Figure 8).
Figure 8: Number of households with an exception to the policy to provide support for a max of 2 children, by region, April 2024
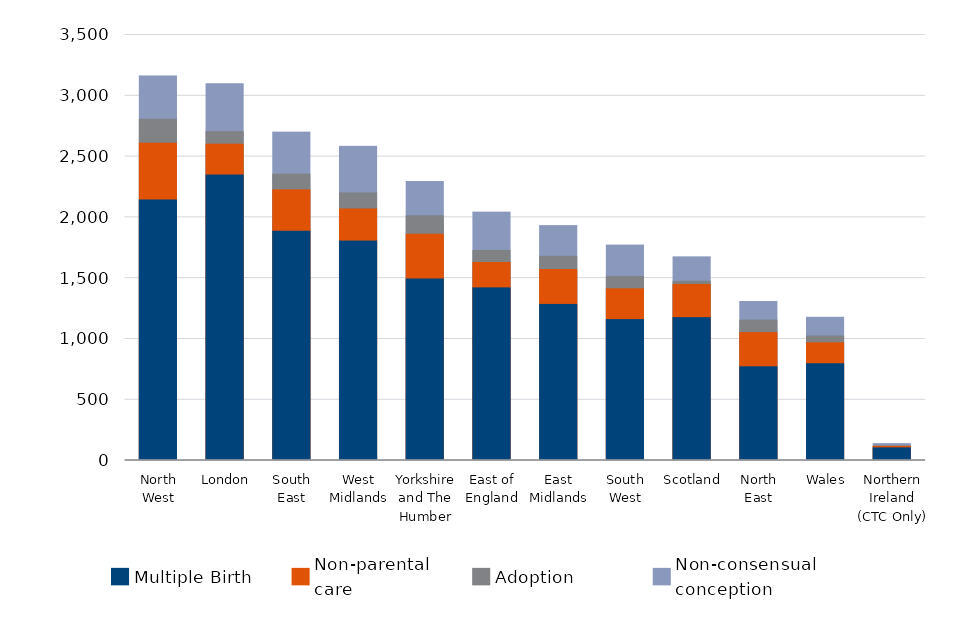
Note: For a small number of UC households, information on their region is not available.
Overall numbers of households affected by the policy to provide support for a maximum of two children, not receiving a child element/amount for at least one child, by local authority and 2019 parliamentary constituency
Across the UK, the proportion of households with three or more children on Universal Credit or Child Tax Credits that do not receive a child element/amount for at least one child is 61%. For UC households only the proportion is 65%, and for CTC households only the proportion is 46%. This is because UC has a higher proportion of households with younger children than CTC households.
As of the time of publication, there are 349 local authorities in GB (in the UK there are 360 due to the inclusion of Northern Ireland), which vary largely by population. Birmingham, the largest of these, has the highest number of households with three or more children on UC or CTC, at 29,000, and also the highest number of households on UC or CTC not receiving an element/amount for one or more children, at 17,000. As a proportion of these volumes, at 60% Birmingham matches closely with the UK average.
In the 2019 General Election there were 632 parliamentary constituencies in GB (in the UK there are 651 due to the inclusion of Northern Ireland) which have similar populations. The proportion of households with three or more children on UC or CTC that do not receive a child element/amount for at least one child across parliamentary constituencies in GB ranges between 49% (East Dunbartonshire) and 72% (Hackney North and Stoke Newington). For UC claims this range is between 51% (East Dunbartonshire) and 73% (Arfon), and for CTC claims this range including Northern Ireland is between 26% (Stratford-on-Avon) and 73% (Hackney North and Stoke Newington).
For these breakdowns for each local authority and parliamentary constituency see the supplementary data tables published with this release of statistics.
Households affected by the policy to provide support for a maximum of two children, by number of children
Out of 450,000 households affected by the policy, due to having a third or subsequent child born on or after 6 April 2017, 280,000 (62%) have three children, 120,000 (25%) have four children and 56,000 (12%) have five or more children (Figure 10).
Of the 1.6 million children in households affected by the policy (Figure 11), 52% of children were in households with three children, 29% in households with four children, and 19% are in households with five or more children.
Figure 9: Number of households affected by the policy to provide support for a maximum of two children, by size of family, April 2024
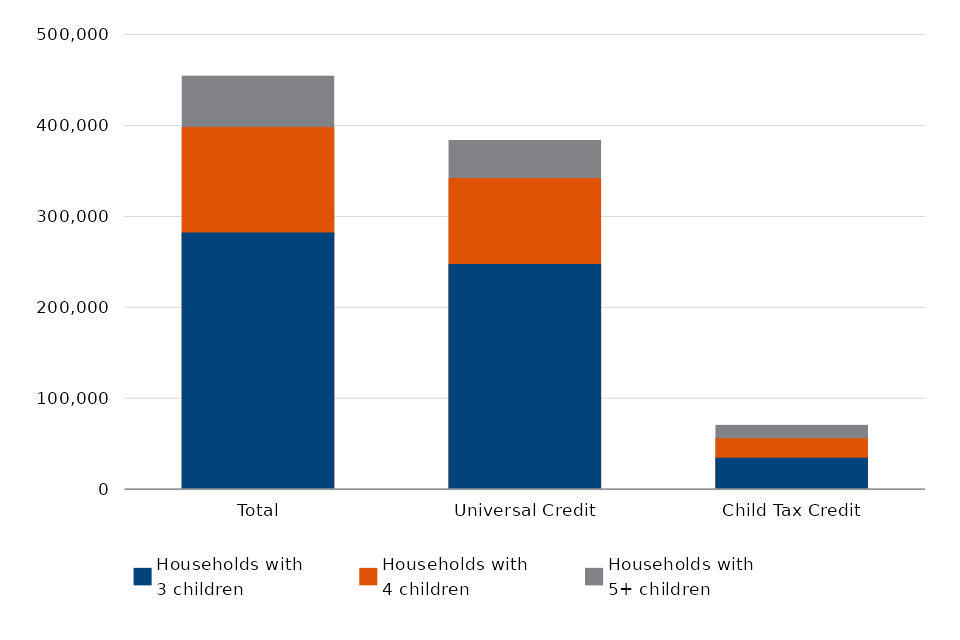
Note: UC figures are for GB only; CTC figures are for the UK.
Figure 10: Number of children living in households affected by the policy to provide support for a maximum of two children, by size of family, April 2024
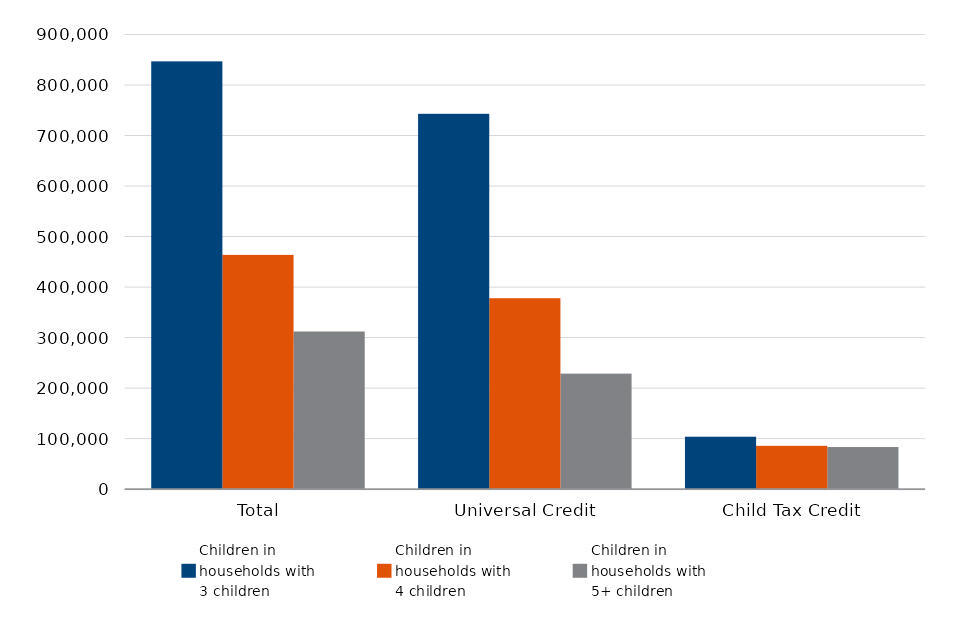
Note: UC figures are for GB only; CTC figures are for the UK.
Overall numbers of households affected by the policy to provide support for a maximum of two children, by year
In the year since the last publication there has been a net increase of 33,000 households in receipt of Universal Credit or Child Tax Credit affected by the policy to provide support for a maximum two children (Figure 12). UC increased by 79,000 while CTC fell by 46,000. This trend is expected as new claimants cannot apply for Tax Credits and must instead apply for UC, and CTC households are moving over to UC throughout 2024/25.
Note: this is the final release to include coverage of Child Tax Credits (CTC). For the next release based on April 2025 data, the transition to Universal Credit is expected to have been completed for eligible CTC claimants.
Figure 11: Number of households affected by the policy to provide support for a maximum of two children, by year
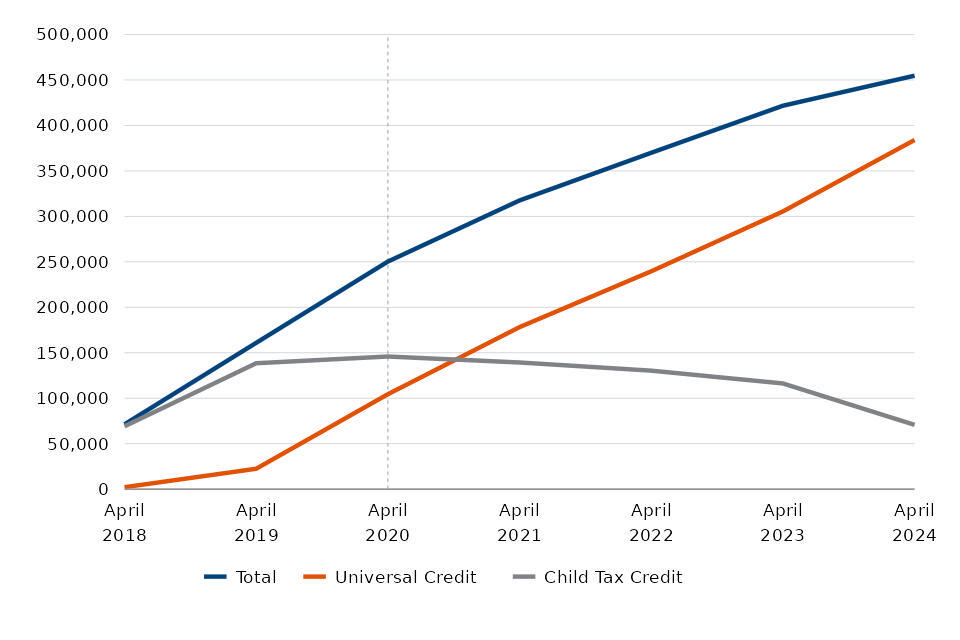
Note: UC figures are for GB only; CTC figures are for the UK; An improved methodology for UC was implemented from April 2020 onwards, and so are not comparable with prior years. For more information on the revisions to statistics see the supporting background information and methodology document.
All households in receipt of Universal Credit or Child Tax Credit with three or more children, by year
The total number of households with three or more children in April 2024, including children born before 6 April 2017, reduced from 770,000 to 720,000 households (Figure 13). Whilst the number of households with three or more children is going up in UC as expected, the overall fall in these figures is due to the reduction over the past year in CTC households with three or more children, which fell by 140,000.
Figure 12: All households in receipt of Child Tax Credit or Universal Credit with three or more children, by year
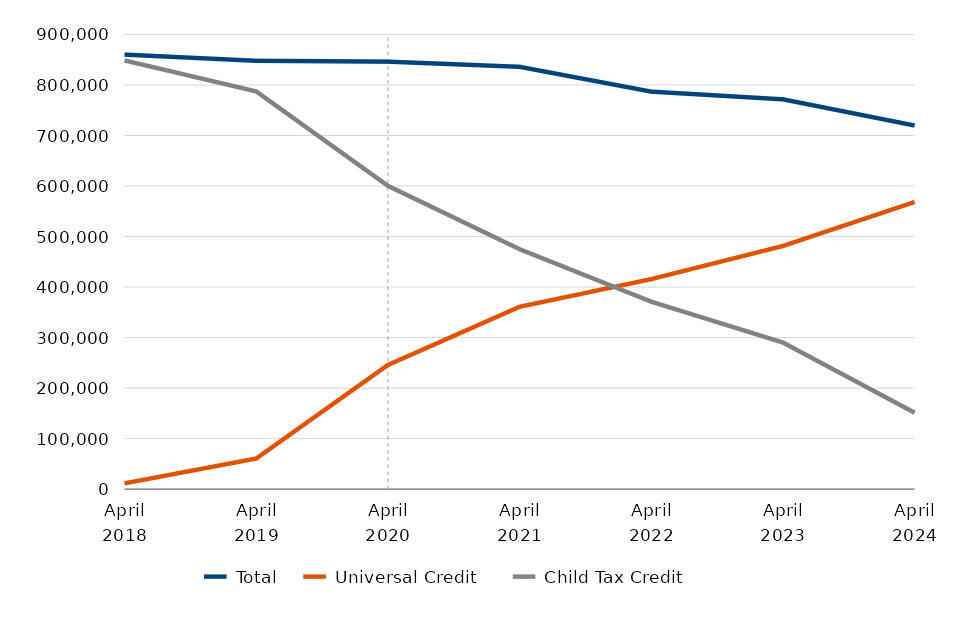
Note: UC figures are for GB only; CTC figures are for the UK; An improved methodology for UC was implemented from April 2020 onwards, and so are not comparable with prior years. For more information on the revisions to statistics see the supporting background information and methodology document.
Feedback
We welcome feedback.
We are committed to improving the official statistics we publish. We want to encourage and promote user engagement, so we can improve our statistical outputs. We would welcome any views you have using the following contact information.
DWP Press Office
For media enquiries, please contact the DWP press office.
Statistical contacts
S Lewis, G Walmsley, N Amini: ucad.briefinganalysis@dwp.gov.uk
M Parker, D Bailey: benefitsandcredits.analysis@hmrc.gov.uk