Universal Credit Work Capability Assessment, April 2019 to March 2024
Published 13 June 2024
Applies to England, Scotland and Wales

© Crown copyright 2024
This publication is licensed under the terms of the Open Government Licence v3.0 except where otherwise stated. To view this licence, visit nationalarchives.gov.uk/doc/open-government-licence/version/3 or write to the Information Policy Team, The National Archives, Kew, London TW9 4DU, or email: psi@nationalarchives.gov.uk.
Where we have identified any third party copyright information you will need to obtain permission from the copyright holders concerned.
This publication is available at https://www.gov.uk/government/statistics/universal-credit-work-capability-assessment-statistics-april-2019-to-march-2024/universal-credit-work-capability-assessment-april-2019-to-march-2024
The latest release of these statistics can be found in the collection of Universal Credit Work Capability Assessment statistics.
This is a quarterly release of Official Statistics on the number of people on UC with a health condition or disability restricting their ability to work, the number of WCA decisions made for UC, and the outcomes of these WCAs.
The next release will be on 12 September 2024.
This release covers:
- the number of people on UC health from April 2019 to March 2024 – by stage of process and personal characteristics such as age and gender
- more granular information by region and local authority
- proportions of Universal Credit claimants on UC health
- monthly WCA decisions and outcomes from April 2019 to February 2024
- medical conditions for claimants undertaking a WCA
Universal Credit has replaced income-related Employment and Support Allowance (ESA) for new claimants. The legacy ESA scheme closed to new claimants in January 2021. New Style ESA is a contributory benefit open to eligible claimants.
In some circumstances, Universal Credit can be claimed alongside New Style ESA. When both benefits are claimed together, Work Capability Assessments are led through the UC claim and outcomes then applied to both benefits.
1. Main stories
The statistics show, across Great Britain at March 2024:
Caseload (number of people on UC health)
- 2.1 million people were on UC health compared to 1.7 million a year earlier
- of these, 267 thousand (13%) had acceptable medical evidence of a restricted ability to work pre-WCA; 356 thousand (17%) were assessed as limited capability for work (LCW), and 1.4 million (70%) were assessed as limited capability for work and work-related activity (LCWRA)
- 53% of claimants were female
- of all claimants on UC health, 38% were aged 50 plus and 10% aged under 25
- from 1 November 2023, an operational change to the provision of fit note evidence resulted in a step change in the number of pre-WCA cases. The new process allows for a period of 21 days after fit note expiry before the claimant is considered for removal from the health journey. This has increased the pre-WCA caseload by around 11% and the overall UC health caseload by 2%
Proportions of Universal Credit claimants
- in March 2024, 31% of people on UC were on UC Health – up 3 percentage points from March 2023
- within England, the region with the highest proportion of UC health cases relative to overall Universal Credit claimants is the North-East (37%), followed by South-West (33%) and North-West (33%) – and the lowest is London (25%)
UC WCA Decisions (in the period April 2019 to February 2024)
- 2.6 million UC WCA decisions have been made. 16% of decisions found claimants had no limited capability for work and hence no longer on UC health, 19% limited capability for work (LCW), and 65% limited capability for work and work-related activity (LCWRA)
- within England, the region with the highest proportion of LCWRA decisions was the North-West (68%) and the lowest the North-East (60%)
- of all WCA decisions in the period January 2022 to February 2024, at least 68% of WCA decisions are recorded as having mental and behavioural disorders albeit this may not be their primary medical condition
2. What you need to know
The number of people on UC health refers to those on Universal Credit with a health condition or disability restricting their ability to work. The sources of the statistics are:
- DWP’s Universal Credit full service administration datasets
- Healthcare provider assessment data
Statistics are published 3-4 months in arrears to allow sufficient time for retrospective data to be captured in the published statistics. Further information on the sources of the statistics and on their derivation is available in the Background and Methodology
Statistics include dual claimants of both UC and New Style ESA as well as both new and repeat UC WCA decisions. Statistics for each of these elements are not currently available.
All figures in this release have been rounded according to DWP rounding policy.
COVID-19 operational easements
Historic figures in this release reflect the disruptions caused by the coronavirus (COVID-19) pandemic, which led to changes in operational procedures. These changes were necessary to process claims and ensure people in need of financial help could access benefits, while keeping customers and staff safe.
DWP temporarily suspended face-to-face health assessments from 17 March 2020 while paper-based assessments continued, and telephone assessments were introduced from 7 May 2020.
Face-to-face assessments were resumed in May 2021, and they now take place alongside paper-based assessments, telephone assessments and a small number of video assessments.
3. UC health caseload by stage of process
Most individuals claiming UC with a health condition or disability that restricts their ability to work, will have a Work Capability Assessment (WCA). The WCA determines whether a person has limited capability for work and, if they do, whether they also have limited capability for work-related activity.
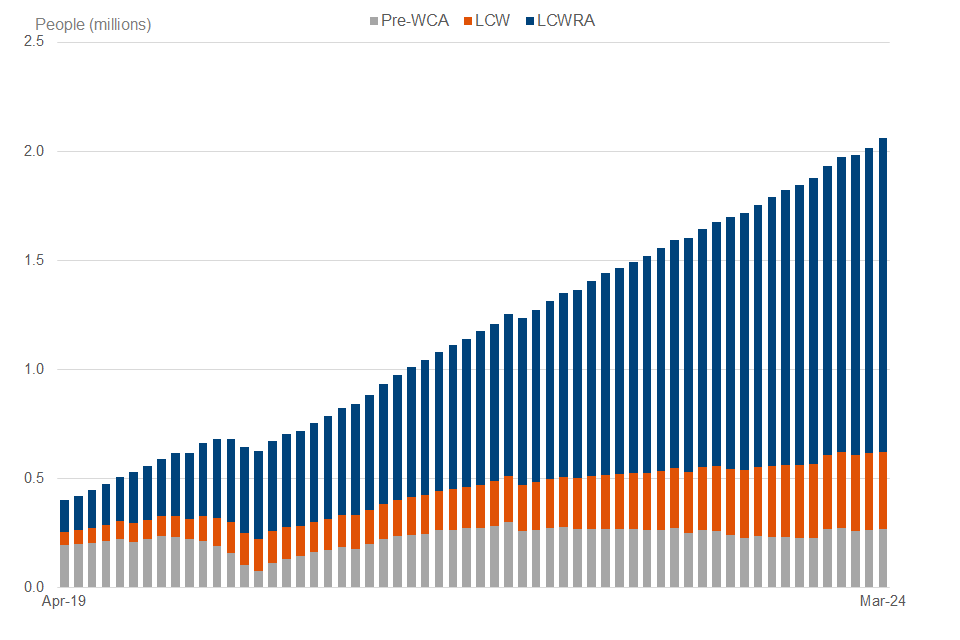
Monthly Universal Credit health caseload, Great Britain, April 2019 to March 2024
At March 2024, 70% of people (1.4 million) on UC health have limited capability for work and work-related activity.
Source: DWP Stat-Xplore, UC Work Capability Assessments
At March 2024, 2.1 million people were on UC health – up 23% from March 2023, and by 4% from the month of December 2023.
Of those on the caseload as at March 2024, 267 thousand (13%) had acceptable medical evidence of a restricted ability to work and were awaiting a decision, 356 thousand (17%) were assessed as limited capability for work (LCW), and 1.4 million (70%) were assessed as limited capability for work and work-related activity (LCWRA).
The composition of the UC health caseload has changed over time as people migrated from ESA to UC, and due to the suspension of face-to-face assessments in March 2020 in response to the COVID-19 pandemic which adversely impacted DWP’s ability to complete assessments and for claimants to provide medical evidence.
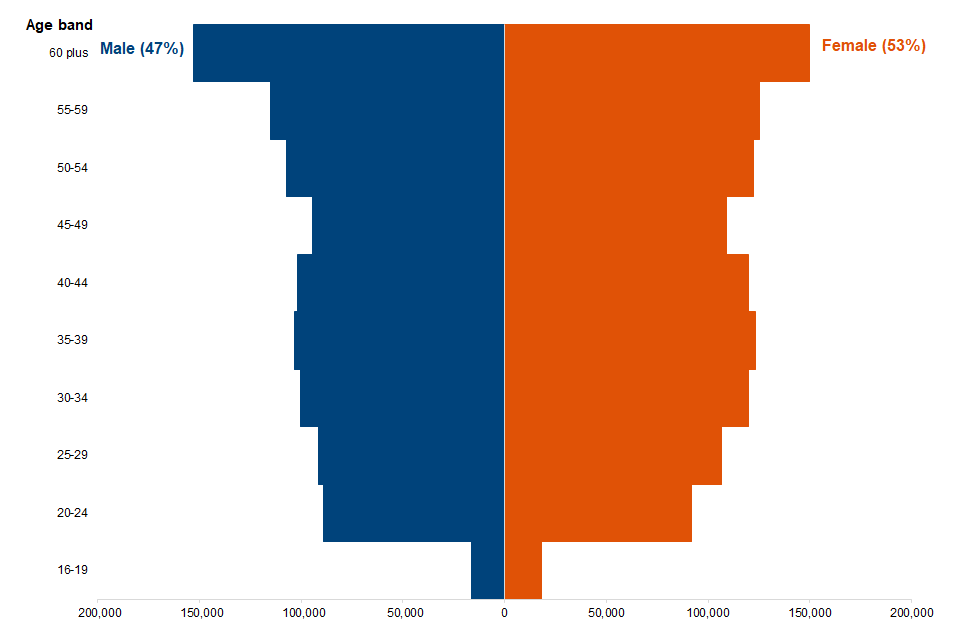
Number of people on the Universal Credit health caseload by gender and age band, Great Britain, March 2024
There are more women on UC health than men, at every age band except 60+.
Source: DWP Stat-Xplore, UC Work Capability Assessments
At March 2024, 53% of those on UC health were female; of these, 37% were aged 50 plus and 10% aged under 25.
4. UC Health caseload by region, local area and proportion of overall Universal Credit claimants
Proportion of Universal Credit claimants on UC health by region, Great Britain, March 2023 and March 2024
Across Great Britain (GB), Scotland has the highest proportion of Universal Credit claimants on UC health in March 2024 at 39%. Within England, the North-East (37%) has the highest proportion of Universal Credit claimants on UC health and London (25%) the lowest.
| Region | March 2023 Rate | March 2024 Rate |
|---|---|---|
| North East | 34% | 37% |
| North West | 31% | 33% |
| Yorkshire and The Humber | 30% | 32% |
| East Midlands | 28% | 30% |
| West Midlands | 27% | 30% |
| East of England | 27% | 30% |
| London | 22% | 25% |
| South East | 25% | 28% |
| South West | 31% | 33% |
| Scotland | 36% | 39% |
| Wales | 35% | 37% |
Source: DWP Stat-Xplore, UC Work Capability Assessments
Across Great Britain, the number of people on UC health represents 31% of the overall number of people claiming Universal Credit in March 2024 – up 3 percentage points from March 2023.
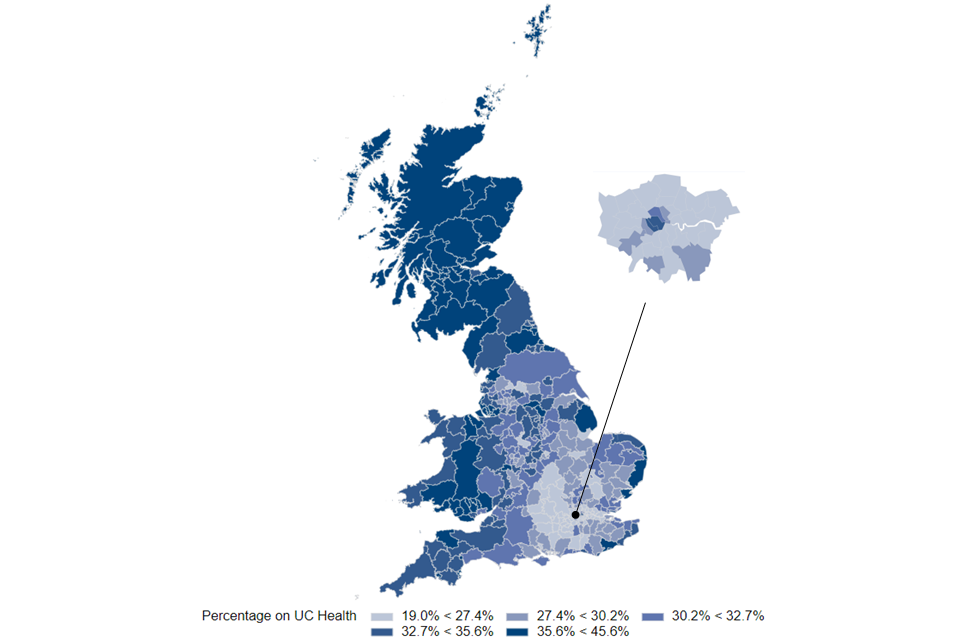
Proportion of Universal Credit claimants on UC health by local authority, Great Britain, March 2024
Over 60% of local authorities have over 30% of UC claimants on UC health.
Source: DWP Stat-Xplore, UC Work Capability Assessments
Group ranges are calculated to split local authorities evenly into 5 bands, so approximately 20% of local authorities fit into each group.
At local authority level, Inverclyde (46%) has the highest proportion of Universal Credit claimants on UC health in March 2024, followed by Clackmannanshire (43%). Excluding very small local authorities where rates can be spurious, Newham (19%) has the lowest proportion of Universal Credit claimants on UC health.
5. UC Work Capability Assessment decisions and outcomes
DWP decisions are based on the WCA outcome report from the Assessment Provider (AP) together with any related evidence. Decisions cover:
- limited capability for work (LCW) and required to participate in work related activity to help them move towards the labour market
- limited capability for work and work related activity (LCWRA) and therefore not required to undertake any interviews or work related activity
- no limited capability for work and therefore no longer on UC health
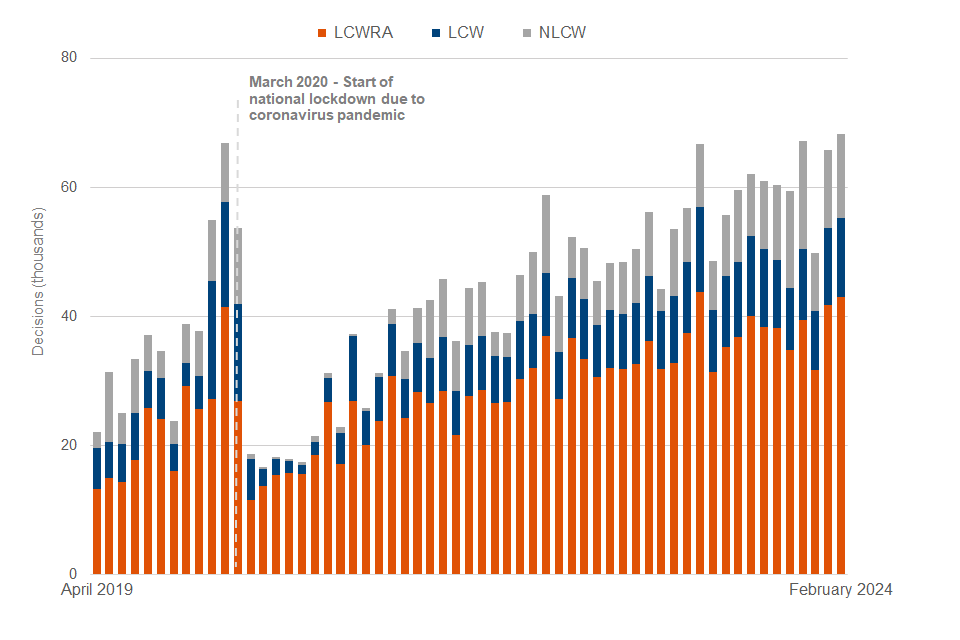
Monthly Universal Credit WCA decisions, Great Britain, April 2019 to February 2024
In the quarter to February 2024, 63% of UC WCA decisions were for LCWRA, down from 66% in the quarter to February 2023.
Source: DWP Stat-Xplore, UC Work Capability Assessments
Since April 2019, DWP have made 2.6 million decisions. Of these decisions, 16% of people were found to have no limited capability for work and hence no longer on UC health, 19% limited capability for work (LCW), and 65% limited capability for work and work-related activity (LCWRA).
The region with the highest proportion of LCWRA decisions was Wales (69%) and the lowest the North-East (60%).
Proportion of LCWRA decisions by local authority, Great Britain, April 2019 to February 2024
All local authorities have more than 50% of decisions recorded as LCWRA.
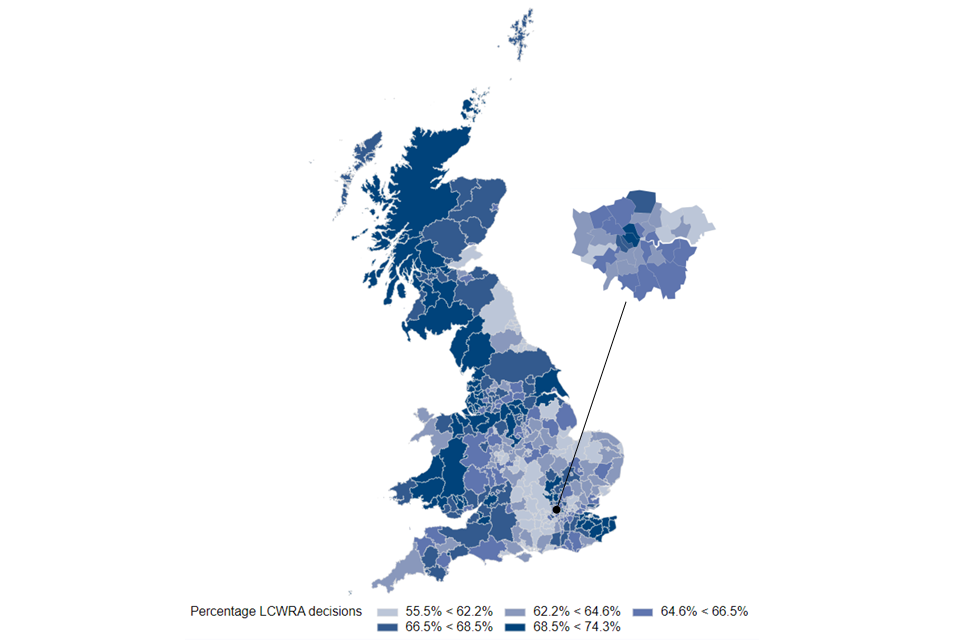
Source: DWP Stat-Xplore, UC Work Capability Assessments
Group ranges are calculated to split local authorities evenly into 5 bands, so approximately 20% of local authorities fit into each group.
At local authority level, excluding very small local authorities where rates can be spurious, Ceredigion (74%) and Folkestone and Hythe (73%) have the highest proportion of LCWRA decisions since April 2019. Slough (55%) has the lowest proportion.
40 local authorities (11%) have 7 in 10 decisions recorded as LCWRA.
6. UC Work Capability Assessment medical conditions
Claimants often have complex health issues and can thus be recorded with multiple conditions across International Classification of Disease (ICD10) Codes. Unlike ESA medical statistics, a primary medical condition is not recorded. As such, UC WCA medical conditions convey all recorded medical conditions, but do not relate to a primary medical condition.
Medical condition is based on evidence recorded at the WCA, this in itself does not confer entitlement to Universal Credit. The Background and Methodology provides further information on the source of these statistics and how they are recorded, and on their coding and derivation.
Coverage is not complete for data on medical conditions for UC WCA. Of all WCA decisions in the period January 2022 to February 2024 (1.4 million), 81% have a medical condition recorded on the Medical Services Referral System (MSRS).
Those without a medical condition primarily comprise claimants for whom a decision is made without the need for an interview based WCA. These filework cases can relate to claimants who are severely or terminally ill, or have other complex conditions and thus may not be representative of the cohort of known medical conditions.
Of all WCA decisions in the period January 2022 to February 2024:
- at least 68% are recorded as having mental and behavioural disorders albeit this may not be their primary medical condition. The proportion recorded as having mental and behavioural disorders is lower (54%) for claimants found capable for work, and higher for claimants found to have limited capability for work (89%)
- 47% are recorded with diseases of the musculoskeletal system and connective tissue. This proportion is higher (59%) for claimants found capable for work
Universal Credit WCA decisions, Great Britain, January 2022 to February 2024 by medical condition (ICD summary group)
Claimants can be recorded across multiple ICD10 Classifications, but are only shown once within a Classification. Primary conditions are not recorded.
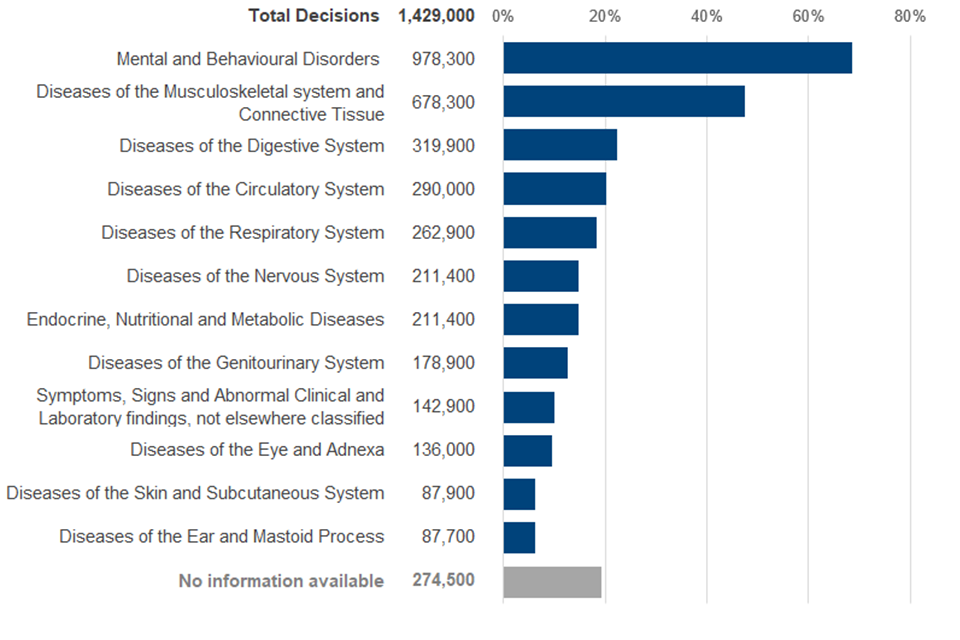
Source: DWP, UC Work Capability Assessments
7. About these statistics
The statistics in this bulletin are classified as Official Statistics. The Statistics and Registration Service Act 2007 defines ‘Official Statistics’ as all those statistical outputs produced by the UK Statistics Authority’s executive office (the Office for National Statistics), by central Government departments and agencies, by the devolved administrations in Northern Ireland, Scotland, and Wales, and by other Crown bodies (over 200 bodies in total). The statistics in this bulletin are compliant with the Code of Practice for Official Statistics. The Code encourages and supports producers of statistics to maintain their independence and to ensure adequate resourcing for statistical production. It helps producers and users of statistics by setting out the necessary principles and practices to produce statistics that are trustworthy, high quality and of public value.
Plans and proposals for further developments to the statistics are shown in the release strategy document and summarised in the DWP statistical work programme. This includes an intention to publish summary statistics on the gender and age of claimants for WCA decisions and outcomes, and a breakdown of initial and repeat WCA Decisions, in the next release.
The Benefit Combination statistics are included as part of the quarterly DWP benefits statistics collection, and allow users to view the combinations of benefits that people claim at a point in time for almost all benefits administered by DWP, including PIP.
The latest statistics include PIP, DLA and Attendance Allowance (AA) award levels for the first time and is updated every six months in February and August. The underlying data is updated every quarter (February, May, August and November) and can be found on Stat-Xplore
Key uses of the statistics include:
- providing the evidence base for assessing the potential effect of changes, monitoring and evaluation of DWP policy
- answering Parliamentary Questions and Freedom of Information requests and forecasting benefit expenditure (in conjunction with expenditure statistics)
- policy development and evaluation by local authorities and other welfare to work stakeholders and providers
Where to find out more
This statistical bulletin gives an overview of the important points and trends. More detailed breakdowns can be found via the supporting data tables published alongside each bulletin and DWP’s online tabulation tool Stat-Xplore.
Read more about UC statistics and ESA-WCA statistics.
See Transforming Support: the Health and Disability White Paper for information on proposed changes to support for those with health and disability needs.
Contact information and feedback
DWP would like to hear your views on these statistics. We would be interested in hearing what you use them for and how well they meet your requirements.
Feedback and queries about the statistics can be sent to stats.consultation-2018@dwp.gov.uk.
Media enquiries should be directed to the DWP Press Office, Telephone: 0115 965 8781. Email: newsdesk@dwp.gov.uk.
Lead Statisticians: David Leighton and Russ Bentley
ISBN: 978-1-78659-688-8