Use of Discretionary Housing Payments: analysis of end-of-year returns from local authorities, data for April 2023 to March 2024
Published 11 July 2024
Applies to England and Wales

© Crown copyright 2024
This publication is licensed under the terms of the Open Government Licence v3.0 except where otherwise stated. To view this licence, visit nationalarchives.gov.uk/doc/open-government-licence/version/3 or write to the Information Policy Team, The National Archives, Kew, London TW9 4DU, or email: psi@nationalarchives.gov.uk.
Where we have identified any third party copyright information you will need to obtain permission from the copyright holders concerned.
This publication is available at https://www.gov.uk/government/statistics/use-of-discretionary-housing-payments-financial-year-2023-to-2024/use-of-discretionary-housing-payments-analysis-of-end-of-year-returns-from-local-authorities-data-for-april-2023-to-march-2024
The latest release of these statistics can be found in the collection of Discretionary Housing Payments statistics.
1. Main stories
Here are the main headlines about the use of Discretionary Housing Payments (DHPs) for the financial year ending March 2024 based on information received from 316 out of 318 Local Authorities in England and Wales:
- in the financial year ending March 2024, local authorities had spent 112% of their combined allocations for the year, compared to 115% in the financial year ending March 2023
- DHP spending varied between local authorities, with 14% of local authorities spending less than 95% of their allocation, 51% of local authorities spending between 95% to 105% of their allocation and 35% of local authorities spending over 105% of their allocation
- for the 310 local authorities that submitted awards data, the total number of DHP awards given out in the financial year ending March 2024 was 175,034
- 63% of DHP expenditure was related to a welfare reform, with Removal of the Spare Room Subsidy (RSRS) accounting for the greatest share of expenditure (25%)
- over a quarter (28%) of DHP expenditure was related to moving accommodation, while 11% was used for short-term rental costs while seeking employment
2. What you need to know
Discretionary Housing Payments (DHPs) can be paid to those entitled to Housing Benefit or the housing element of Universal Credit who face a shortfall in meeting their housing costs. Local authorities have broad discretion to spend in line with their local priorities. This includes deciding how much will be paid and the length of the award. A DHP can be awarded to cover a rent shortfall, a rent deposit, rent in advance, or other costs associated with moving.
The government provides funding to local authorities for DHPs. For the financial year ending March 2024, the Government provided £100m of funding. In addition to the government contribution, local authorities can top up DHP funding up to a maximum of two and half times this figure using their own funds.
LAs are encouraged to manage their DHP budget, the level of DHP spending does not necessarily reflect the level of demand for DHPs.
These statistics cover the financial year ending March 2024. The findings are based on returns from 316 out of 318 local authorities.
Further guidance on these statistics is provided in the more information section of this publication and in the background information and methodology document.
3. How much of their DHP funding did local authorities spend?
In the financial year ending March 2024, the local authorities who provided information had spent £112m on DHPs which represents 112% of their combined allocations. This compares to the previous financial year ending March 2023, where local authorities spent £111m on DHPs which represented 115% of combined allocations. Caution should be taken when comparing expenditure to previous years as different local authorities responded in each year.
Welsh local authorities who provided information had spent 127% of their combined allocation, which is a higher proportion than that spent by reporting English local authorities (111%).
The local authorities that provided information for number of awards made 175,034 awards to claimants in the financial year ending March 2024. For the 310 local authorities that provided this information, the total expenditure on DHPs was £111m. While this suggests that the average DHP award was £634, this figure should be treated with caution, since there are a variety of different types of DHP awards (for example, a single DHP award to cover a deposit is likely to have a different value to a DHP award paid on a weekly or monthly basis).
Just over half of local authorities spent between 95% to 105% of their allocation
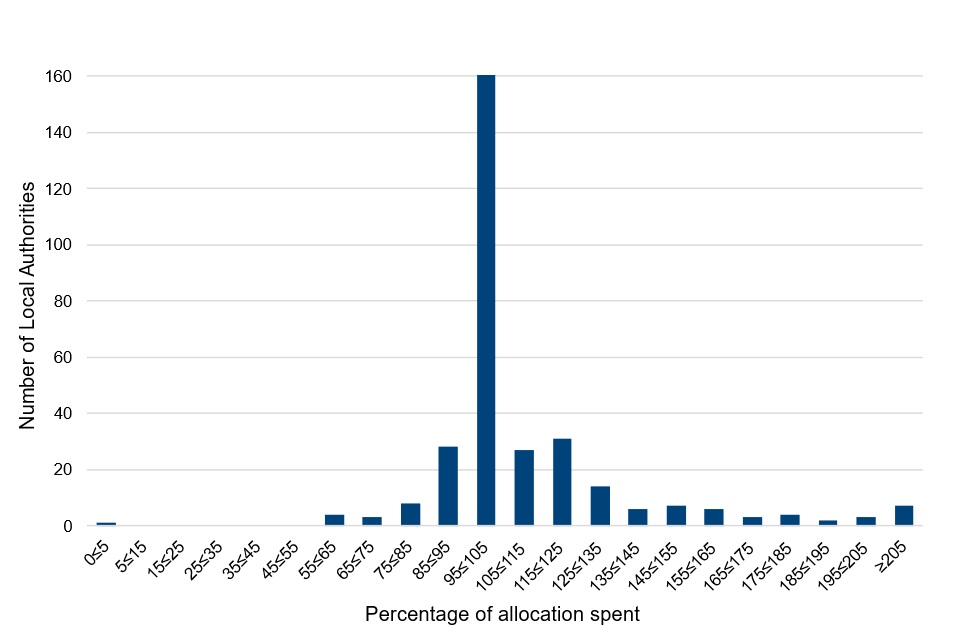
Local authorities varied in the proportion of their DHP allocation that they had spent, with 14% of Local authorities spending less than 95% of their allocation and 35% spending over 105%. Just over half (51%) of local authorities spent between 95% and 105% of their allocated funding: that is, they spent slightly more or slightly less than their allocated funding.
In the previous financial year, the pattern of spending showed local authorities spending a higher proportion of their allocated funding: 11% of local authorities who responded had spent less than 95% of their allocation, while 42% had spent over 105%.
Over 3 in 10 reporting local authorities spent between 99% and 101% of their allocation
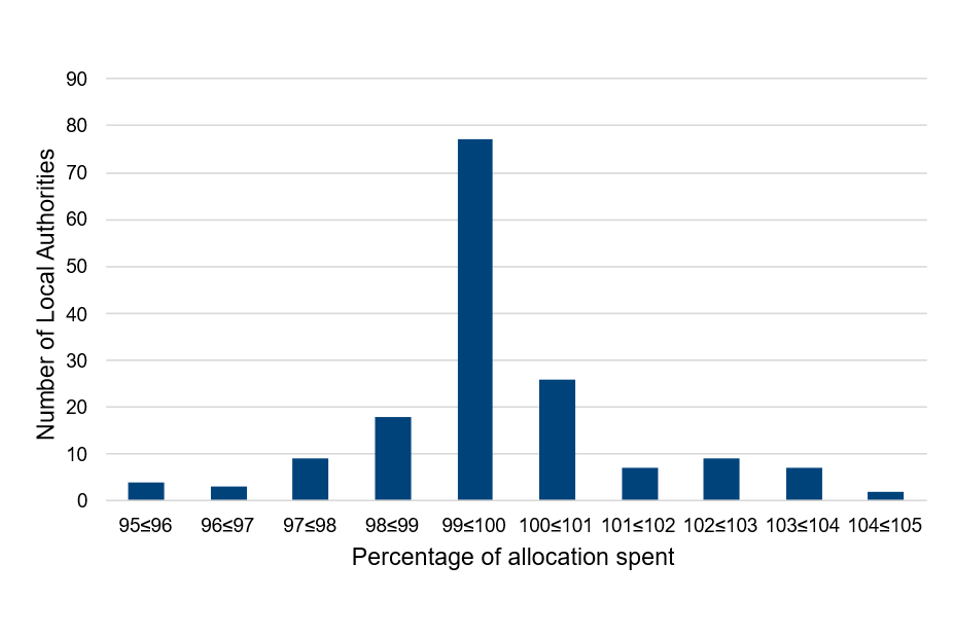
When looking more closely at local authorities that spent between 95% and 105% of their allocations, 103 of them spent more than 99% and less than or equal to 101% (i.e. very close to 100% of their allocation). This is 33% of all local authorities that provided a return. Of these, 25 Local authorities reported spending exactly the same as their allocation.
Local authorities in Wales spent the highest proportion of their combined allocations, local authorities in London spent the least
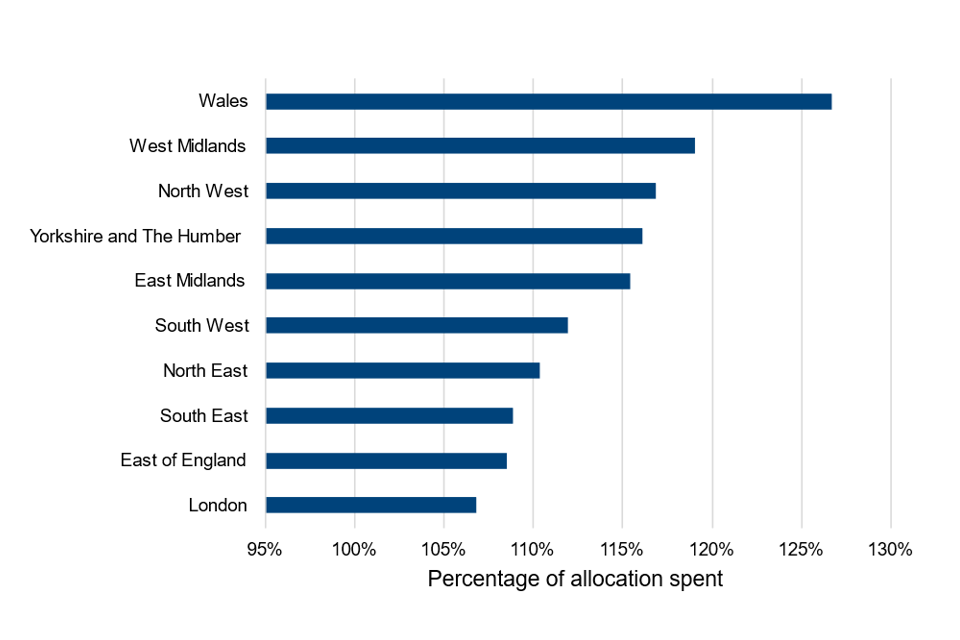
There was some variation in the proportion of combined allocation spent by region, with local authorities in Wales spending the greatest proportion of their combined allocations (127%) and local authorities in London spending the least (107%).
In the previous financial year ending March 2023, local authorities in Wales had also spent the greatest proportion of their combined allocations (155%) with local authorities in Outer London spending the lowest proportion (105%).
4. How much was spent on each welfare reform
63% of DHP expenditure was related to welfare reforms
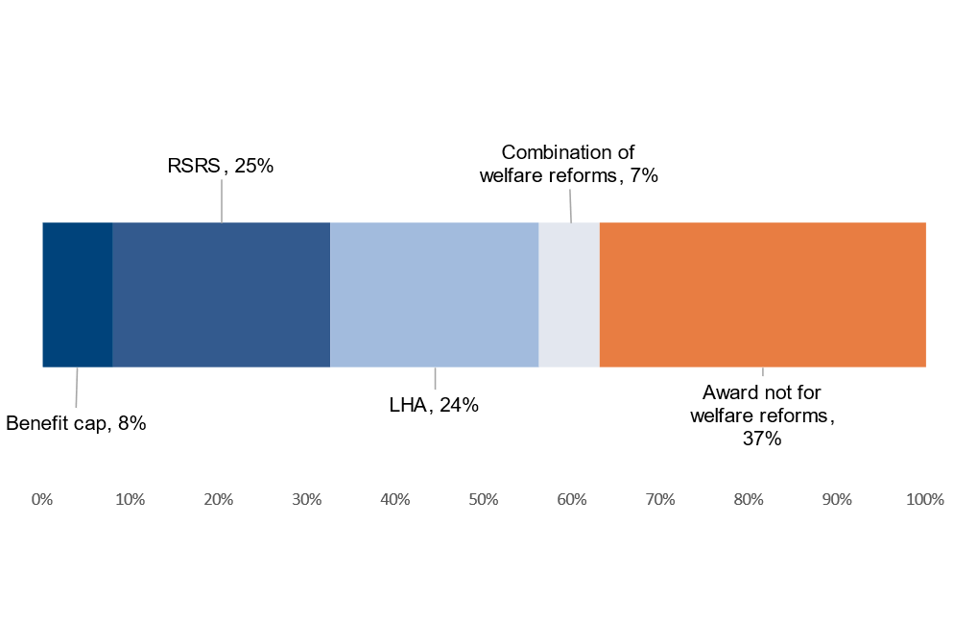
63% of DHP expenditure was recorded as related to welfare reforms, with the Removal of the Spare Room Subsidy (RSRS) recorded as being responsible for the largest proportion of DHP expenditure (25%), followed by Local Housing Allowance (LHA) reforms (24%) and the Benefit Cap (8%) and a combination of welfare reforms (7%). Just over a third (37%) of DHP expenditure was reported as unrelated to welfare reforms.
In the previous financial year, a similar proportion (64%) of DHP expenditure was recorded as being related to welfare reforms.
5. What DHPs were awarded for
Over a quarter of expenditure was related to moving to alternative accommodation
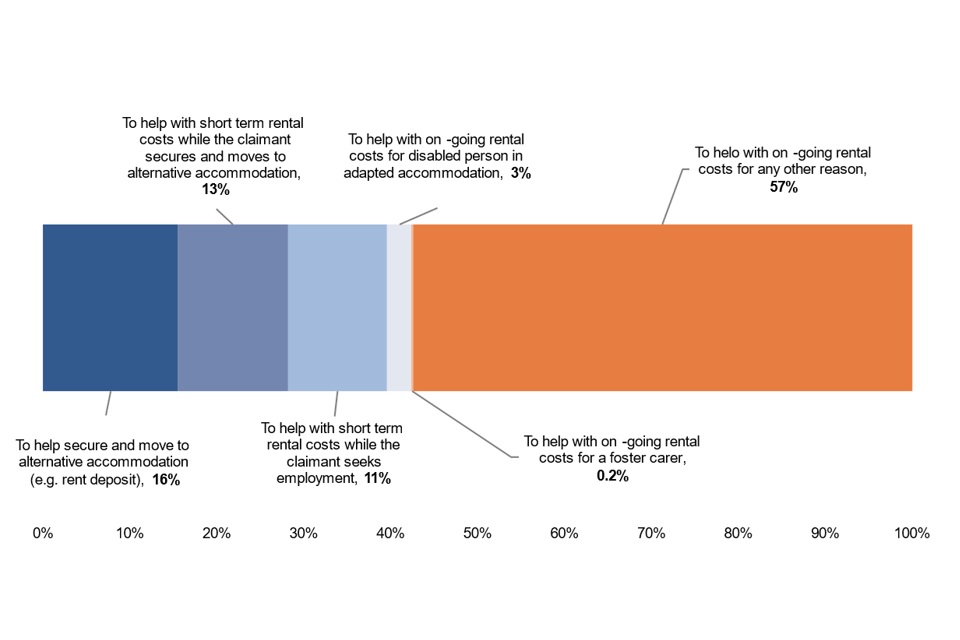
Over a quarter (28%) of DHP expenditure was related to moving to alternative accommodation. 11% was to help with short-term rental costs while the claimant sought employment, while 3% went towards costs for disabled people in adapted accommodation.
Over half (57%) of DHP expenditure was given to help with ongoing rental costs, for a reason unrelated to the above. This is similar to the percentage reported in the previous financial year ending March 2023 (58%).
6. More information
DHP government funding
Total DHP funding for the financial year ending March 2024 is £100m. Funding for DHPs has historically been split into four streams (Core, Local Housing Allowance, Removal of the Spare Room Subsidy and Benefit Cap) for DWP’s calculation purposes, although local authorities are not required to take account of these streams in allocating their funding. More information about funding levels over time can be found in table 1 in the data tables document of this statistics release.
Welfare reforms
Since 2011, the Government increased its contribution to DHPs so that local authorities can support those affected by the Benefit Cap, Removal of the Spare Room Subsidy and reforms to the Local Housing Allowance. The background information and methodology document provides more detail.
Data source
At the midpoint and end of each financial year, local authorities provide details of their DHP expenditure for financial accounting purposes, which they are legally required to do. 316 out of 318 local authorities provided this information in time for inclusion within these statistics. Of these 316 local authorities, 318 gave information about the number of DHP awards they gave out in the financial year.
In addition to financial information, local authorities are also asked, at the mid-point and end of each financial year, to provide additional monitoring information. Not all local authorities supply some or all of the monitoring information requested. Of the 316 local authorities that submitted a return, 305 provided a breakdown of expenditure by welfare reform and 300 provided a breakdown of expenditure by purpose of DHP. More information about both the financial information and monitoring information provided in returns can be found in the background information and methodology document.
Release schedule
These Official Statistics are released biannually. This current statistical release presents a summary of the end-of-year claim forms that include both financial and monitoring information. They cover the financial year ending March 2024.
The next release in this series will be based on mid-year monitoring and financial returns covering April 2024 to September 2024. It will be published in December 2024.
Status
These statistics have not been assessed by the UK Statistics Authority and have not been designated as National Statistics.
7. Where to find out more
These statistics are released as part of a series of Discretionary Housing Payment statistics.
Read information about Discretionary Housing Payments, including how to claim them.
8. Contact information
Responsible Analyst: Keir Thomson
Email: keir.thomson@dwp.gov.uk
Author: Sophie Reid
Email: sophie.reid2@dwp.gov.uk
For media enquiries, please contact the DWP press office.
Comments? Feedback is welcome
Please answer this short survey to help us make the statistics better for you.
Published 11 July 2024
Next edition December 2024