Quarterly VAT statistics commentary (April to June 2021)
Updated 30 July 2021

© Crown copyright 2021
This publication is licensed under the terms of the Open Government Licence v3.0 except where otherwise stated. To view this licence, visit nationalarchives.gov.uk/doc/open-government-licence/version/3 or write to the Information Policy Team, The National Archives, Kew, London TW9 4DU, or email: psi@nationalarchives.gov.uk.
Where we have identified any third party copyright information you will need to obtain permission from the copyright holders concerned.
This publication is available at https://www.gov.uk/government/statistics/value-added-tax-vat-bulletin/quarterly-vat-statistics-commentary-april-to-june-2021
Released: 30 July 2021.
UK Quarterly VAT Statistics updated with April to June 2021 provisional data.
Receipts
All figures published in this bulletin should be read in the context of the coronavirus (COVID-19) pandemic and the government’s VAT deferral measure, where traders were able to defer VAT payments due between 20 March and 30 June 2020.
Businesses were required either to pay deferred VAT in full by 31 March 2021 or make an arrangement to pay by 30 June 2021. The VAT Deferral New Payment Scheme was open online between 23 February 2021 and 21 June 2021 and allowed businesses to self-serve by spreading payment of deferred VAT over up to 11 equal monthly instalments, interest free.
Headlines
The following headlines refer to the latest quarter (April to June 2021):
- Total VAT receipts this quarter were £35,152 million
- Net Home VAT receipts for this quarter were £30,457 million
- Import VAT receipts this quarter were £4,695 million, which is 16.1% lower than the same quarter last financial year
As a consequence of the VAT deferral scheme, VAT repayments exceeded VAT payments creating negative Net Home VAT between March and June 2020. Between April and June 2020, Total VAT was also negative. Hence comparisons of this year’s Total VAT and Net Home VAT receipts with receipts from the same quarter last year are not helpful at this time.
Another consequence of VAT deferral is that VAT payments for the current quarter have been boosted by payments of VAT deferred from the previous year, with some businesses continuing to pay deferred VAT under the VAT Deferral New Payment Scheme.
Import VAT receipts for the current quarter are lower compared to the same quarter last year, due to the introduction of postponed VAT accounting (PVA).
Chart 1: Receipts for Net Home VAT, Import VAT and Total VAT for the past 10 financial years
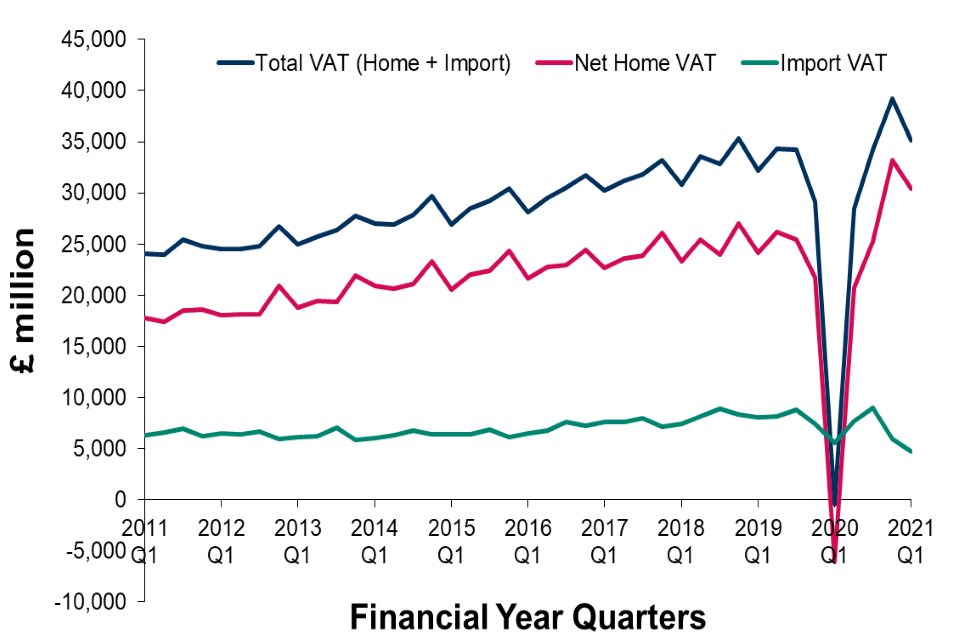
The graph is plotted in quarters with Q1 referring to the first quarter of the financial year. Hence, 2021 Q1 refers to the months from April 2021 to June 2021.
For the full dataset that accompanies Chart 1, go to Quarterly VAT statistics tables (April to June 2021) data tables.
Chart 1 demonstrates the following trends:
- up until 2019 Q3 Total VAT Receipts were steadily rising
- very low Home VAT receipts were recorded in 2020 Q1 coinciding with the period when businesses were able to defer their VAT payments (Total VAT and Net Home VAT both negative in this quarter)
- Home VAT receipts have been boosted in recent quarters (particularly 2020 Q4) by payments of VAT deferred from 20 March to 30 June 2020
Import VAT receipts were lower for the current quarter. This is mainly due to postponed VAT accounting (PVA). Since January 2021, traders have been able to include Import VAT on their regular VAT return. Note that January 2021 receipts reflect December 2020 returns which were on the previous regime.
Payments made using PVA are recorded as Home VAT payments and not Import VAT. Only traders who are continuing to pay Import VAT under the previous regime are contributing to Import VAT receipts as reported above.
Net Home VAT and Import VAT
Net Home VAT comprises VAT payments offset by VAT repayments. Total VAT is the sum of Net Home VAT and Import VAT receipts. The following refer to the latest quarter (April to June 2021):
- Net Home VAT receipts were £30,457 million, having been very low the same quarter last financial year
- Home VAT payments were £54,525 million, having been very low the same quarter last financial year
- Home VAT repayments were £24,068 million, which is £2,636 million (12.3%) higher this quarter compared to the same quarter last financial year
- Import VAT receipts decreased by £903 million (16.1%) this quarter against the same quarter last financial year
Import VAT receipts were lower for the current quarter. This is mainly due to postponed VAT accounting (PVA). Since January 2021, traders have been able to include Import VAT on their regular VAT return.
Payments made using PVA are recorded under Home VAT payments and not Import VAT. Only traders who are continuing to pay Import VAT under the previous regime are contributing to Import VAT receipts as reported above.
Net Home VAT means VAT declared on VAT returns. From January 2021 this includes import VAT paid through PVA.
Chart 2: Net Home VAT and Import VAT receipts for this year and the 2 previous financial years
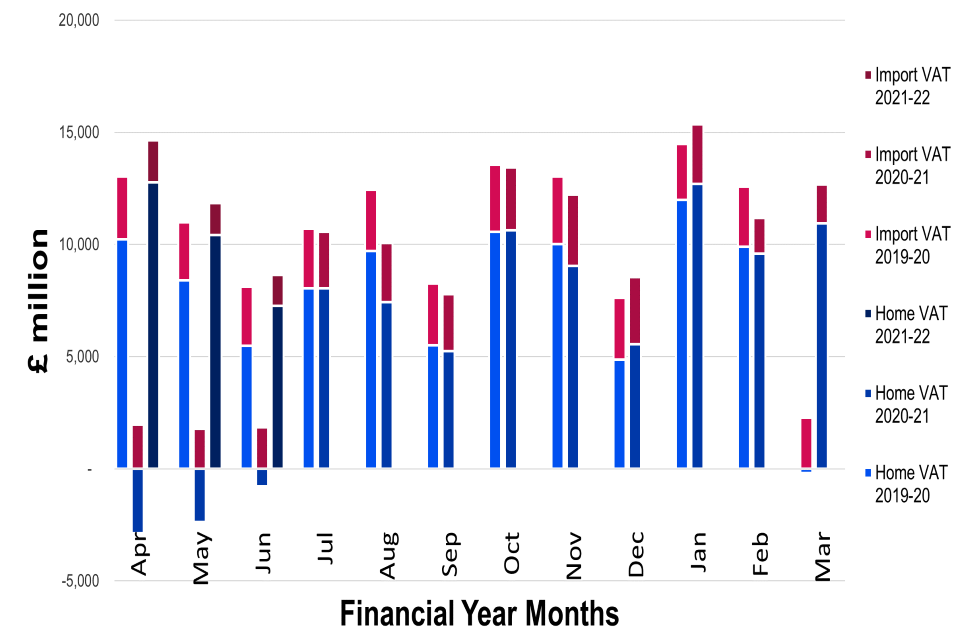
Chart 2 is a bar chart showing monthly trends in Home VAT and Import VAT for the last 3 financial years.
For the full dataset that accompanies Chart 2 go to Quarterly VAT statistics tables (April to June 2021) data tables.
Chart 2 demonstrates the following trends:
- negative Net Home VAT was seen from March to June 2020 as a result of the VAT deferral measure
- Net Home VAT has been boosted in all months since July 2020, to varying degrees, by payments of VAT deferred from March to June 2020
- March 2021 Net Home VAT receipts were substantially boosted by payments of deferred VAT
Since February 2021, comparisons of Import VAT with receipts from previous years are no longer meaningful as many traders are now paying Import VAT as part of their regular VAT return under the new PVA arrangements.
Repayments of deferred VAT in the current financial year are done through the VAT Deferral New Payment Scheme.
Chart 3: VAT payments and repayments for this year and the 2 previous financial years
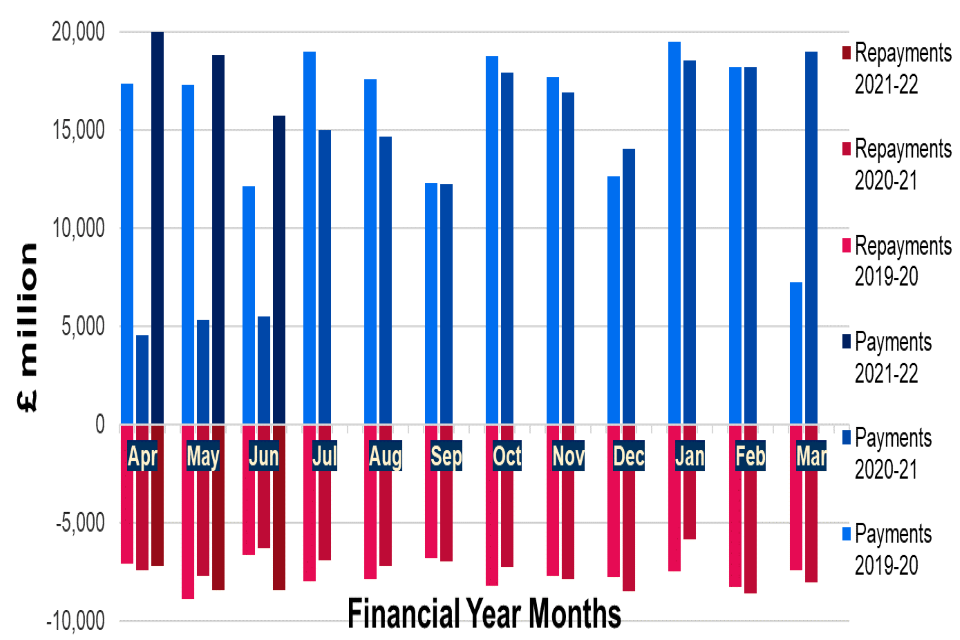
Chart 3 is a bar chart showing monthly trends for VAT payments and VAT repayments for the last 3 financial years:
For the full dataset that accompanies Chart 3 go to Quarterly VAT statistics tables (April to June 2021) data tables.
Chart 3 demonstrates the following trends:
- VAT payments were very low from March 2020 to June 2020 when many traders were deferring their VAT payments
- VAT payments since July 2020 have been boosted each month by payments of deferred VAT, with the highest level of deferred VAT payments seen in March 2021
- between May 2020 and August 2020, VAT repayments were lower than the corresponding months the previous year
- between September 2020 and April 2021, the value of repayments has fluctuated from month to month, compared to the same month the year before
- we saw high levels of VAT repayments both in May and June 2021
Since June 2020 we have started to see a higher number of repayments but of lower value. This can be partly explained by a large number of businesses moving from a net payment position to a net repayment position.
The reduced VAT rate for hospitality, holiday accommodation and some attractions (effective between 8 July 2020 and 30 September 2021) also contributes to some businesses moving to a net repayment position.
VAT trader population
Chart 4: Quarterly VAT registrations and de-registrations over the last 10 financial years
For the quarter from April to June 2021 we have recorded:
- 80,580 new registrations
- 29,135 de-registrations
- an increase of 51,445 (2.1%) since the previous quarter
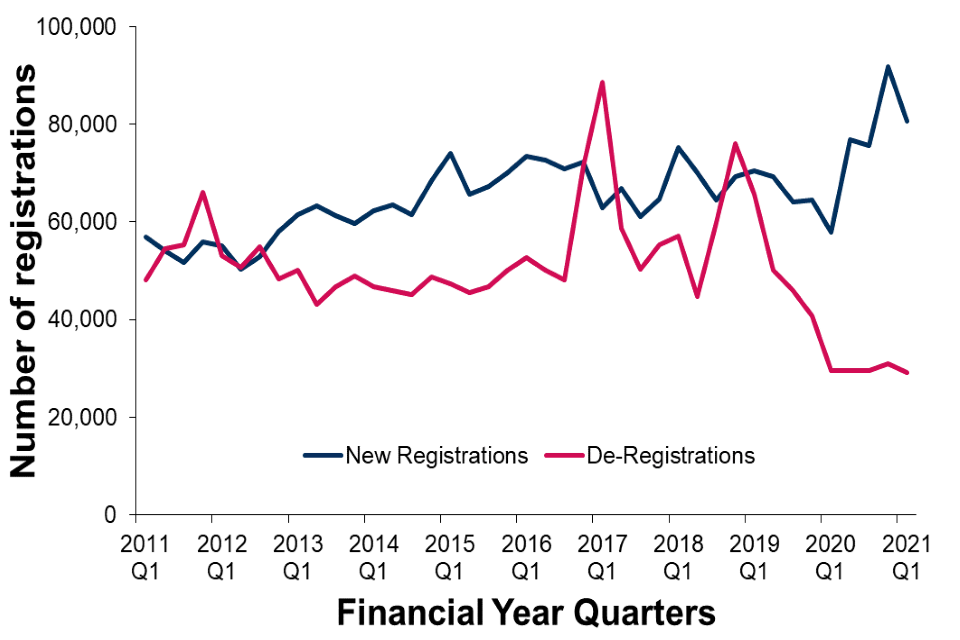
Chart 4 is plotted in quarters and Q1 refers to the first quarter of the financial year. Hence, 2021 Q1 refers to the months between April and June 2021.
For the full dataset that accompanies Chart 4 go to Quarterly VAT statistics tables (April to June 2021) data tables.
Chart 4 demonstrates the following trends:
- large increases in new registrations have been seen each quarter since 2020 Q2
- the highest number of new registrations on record was seen in 2020 Q4
- de-registrations have remained very low since 2020 Q1
There was a substantial increase in the number of de-registrations in mid-2017, with a smaller spike in early 2019; in both cases at this point the number of de-registrations exceeded new registrations. This could potentially be related to trader behaviour associated with changes in relation to the Flat Rate Scheme.
Chart 5: Live VAT trader population over the last 10 financial years
The size of the trader population now stands at 2,488,679 (up by 2.5% since the previous quarter).
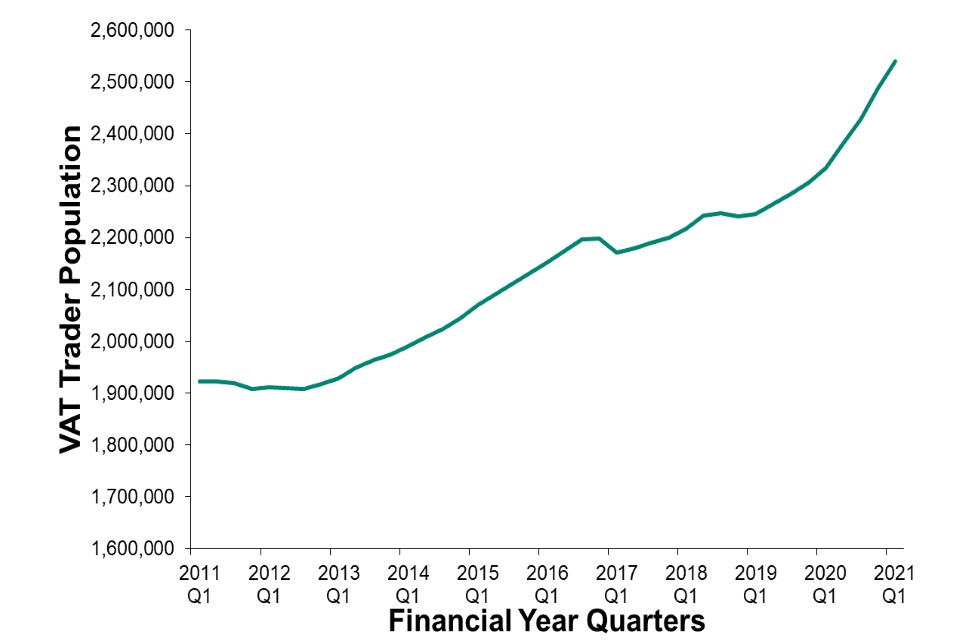
Chart 5 is plotted in quarters and Q1 refers to the first quarter of the financial year. Hence, 2020 Q1 refers to the months between April 2020 and June 2020.
For the full dataset that accompanies Chart 5 go to Quarterly VAT statistics tables (April to June 2021) data tables.
Chart 5 demonstrates the following trends:
- the VAT trader population has seen a near continuous upward trend since 2013 from around 1.9 million traders in 2012 to over 2.5 million today
- recent growth in the trader population has been more pronounced
- the only reductions observed in trader numbers are linked to the spikes in de-registrations previously referenced
Since 2020 Q1, we have seen the highest levels of new VAT registrations on record with the number of VAT de-registrations remaining very low throughout this period. Recent, more pronounced, growth in the trader population has been driven both by high levels of new registration and low levels of de-registration.
Contacts
The UK Quarterly VAT Statistics Bulletin is produced by the Indirect Tax Receipts Monitoring team as part of the Excise duties, VAT, and other tax statistics collection.
For statistical enquiries, contact:
For media enquiries, see HMRC press office. Phone: 03000 585 028.