Cyber security sectoral analysis 2024
Published 15 May 2024

© Crown copyright 2024
This publication is licensed under the terms of the Open Government Licence v3.0 except where otherwise stated. To view this licence, visit nationalarchives.gov.uk/doc/open-government-licence/version/3 or write to the Information Policy Team, The National Archives, Kew, London TW9 4DU, or email: psi@nationalarchives.gov.uk.
Where we have identified any third party copyright information you will need to obtain permission from the copyright holders concerned.
This publication is available at https://www.gov.uk/government/publications/cyber-security-sectoral-analysis-2024/cyber-security-sectoral-analysis-2024
Foreword
Over the last year, the UK’s cyber security sector has shown significant resilience and growth, with a 13% increase in sector revenue, creating 2,700 new jobs, and demonstrating robust economic performance despite global challenges.
The government remains committed to responsible growth within our world-leading digital sectors. The geographical spread of cyber security firms across the UK is a testament to the sector’s nationwide impact, with over half of these firms located outside London and the South East. This distribution both promotes regional economic development and strengthens national resilience in cyber security.
We also will continue to step -up our cyber capability in the months and years ahead. Most notably, establishing the National Cyber Force in Lancashire represents a strategic and significant investment, bolstering our capabilities to address and mitigate cyber threats. This initiative is pivotal in safeguarding national security and harnessing technological advancements.
This year, we continue to fund initiatives such as the UK Cyber Security Council and the CyberFirst programme which are cultivating and supporting new and diverse talent into the sector. This is alongside supportive programmes such as Cyber Runway and NCSC for Start-Ups have been instrumental in nurturing innovation and entrepreneurship within the industry, and ensuring opportunities are spread across the UK as much as possible through leadership offered by organisations such as the UK Cyber Cluster Collaboration (UKC3).
The government recognises and values the relentless efforts of those working within the cyber security sector. Your contributions are crucial to the safety and security of the UK’s digital infrastructure. We remain dedicated to supporting the UK cyber sector, ensuring its continued growth and adaptation to meet future challenges and opportunities.

Viscount Camrose
Minister for AI and Intellectual Property
Department for Science, Innovation and Technology
Executive summary
Introduction
Ipsos and Perspective Economics, with data and advisory support from glass.ai and the Centre for Secure Information Technologies (CSIT) at Queen’s University Belfast were commissioned by the Department for Science, Innovation and Technology (DSIT) in March 2023 to undertake an updated analysis of the UK’s cyber security sector.
This analysis builds upon the previous UK Cyber Security Sectoral Analysis (published in April 2023) that provides a recent estimate of the size and scale of the UK’s cyber security industry. The research provides an assessment of:
-
The number of businesses in the UK supplying cyber security products or services
-
The sector’s contribution to the UK economy (measured through revenue and Gross Value Added, or GVA)
-
The number employed in the cyber security sector
-
The products and services offered by these firms
Project Scope and Summary of Methodology
The diagram below sets out a summary of the research methodology used. This is consistent with previous studies to support a time-series analysis of the sector’s performance to date.
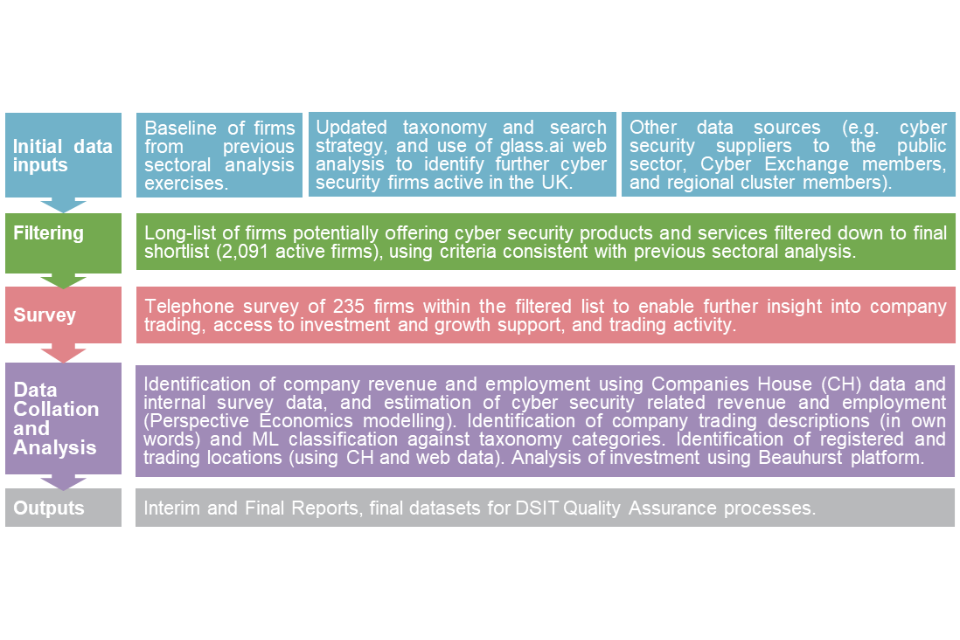
Source: Ipsos, Perspective Economics, and the Centre for Secure Information Technologies
Key Findings
Number of companies
- We estimate there are 2,091 firms currently active within the UK providing cyber security products and services
Sectoral Employment
-
We estimate there are approximately 60,689 Full Time Equivalents (FTEs) working in a cyber security related role across the cyber security firms identified
-
This reflects an estimated increase of c. 2,700 cyber security employee jobs within the last 12 months (an increase of 5%)
Sectoral Revenue
-
We estimate total annual revenue within the sector has reached £11.9 billion within the most recent financial year.[footnote 1]
-
This reflects an increase of c. 13% since last year’s study.[footnote 2] This is considerably higher than the slower growth in the previous study (3%), and in line with previous annual growth trends seen between 2017 – 2021.
Gross Value Added
-
We estimate total GVA for the sector has reached c. £6.5 billion
-
This reflects an increase of 4% since last year’s study.
-
We estimate that GVA per employee has remained relatively consistent, with a slight decrease of 1% from £107,400 to £106,300.
Investment
-
In 2023, £271 million has been raised across 71 deals within dedicated cyber security firms.
-
For the first time within this study, all UK regions have had at least one cyber security investment deal undertaken within the last twelve months.
1. Introduction
1.1 Methodology and Sources
This analysis builds upon the previous UK Cyber Security Sectoral Analysis (published in April 2023) that provides a recent estimate of the size and scale of the UK’s cyber security industry. This continues the time-series analysis undertaken by the research team since 2018. A full time-series analysis is set out within Chapter 4.
The research provides an assessment of the number of businesses in the UK supplying cyber security products or services; the sector’s contribution to the UK economy (measured through revenue and Gross Value Added[footnote 3], or GVA); the number employed in the cyber security sector; and an overview of the products and services offered by these firms.
The UK cyber security sector does not have a formal Standard Industrial Classification (SIC) code, and this study therefore closely aligns itself to that of the baseline analysis, to provide a time series analysis of how the sector has progressed since the baseline (2017/18) and subsequent annual studies.
The cyber security sector remains fast-moving, and continually subject to changes in products, services, and market approaches. This year’s study is fully consistent with the previous updated methodology set out within last year’s report. This includes an improved identification of businesses offering cyber security products and services in the UK, using:
-
An updated and refined taxonomy to better identify and classify cyber security activity
-
An established data partnership with leading data intelligence firm glass.ai (using Artificial Intelligence (AI) techniques[footnote 4] to identify businesses using web data)
-
Ongoing telephone and online survey of cyber security businesses in May to July 2023
The following methodology and research sources were used to provide an overarching shortlist of UK cyber security businesses, and to estimate their economic contribution related to the sale of cyber security products or services.
The process by which we identify and measure the economic contribution of cyber security activity reflects a best estimate by the Ipsos, Perspective Economics, glass.ai and Centre for Secure Information Technologies team, using agreed parameters for the inclusion of respective firms considered to be active in the field.
The key stages below are consistent with previous Cyber Security Sectoral Analysis exercises to enable a time series comparison
Stage 1: Desk Research
The research team conducted initial desk research to explore how the cyber security market had changed within the last 12 months. This included:
-
Engagement with UK cyber security regional networks and clusters, to gather local intelligence
-
A review of published reports regarding the output or activities of the sector (e.g., National Cyber Strategy, NCSC Annual Review, and wider landscape literature)
-
Recent investments or initiatives in the cyber security sector (including review of investments and acquisitions, and identification of industry initiatives and cohorts, e.g., Cyber Runway)
-
Any emerging trends in the market (including supply side and demand side), e.g., enhanced demand attributable to cloud security, or new product innovations requiring specific cyber security requirements (e.g., data exfiltration from Large Language Models)
Stage 2: Initial Data Collection & Gap Analysis
The research team sought to identify potential active cyber security firms in the UK through:
-
A review of firms previously identified in the sectoral analysis (identifying current status and determining inclusion in the updated set)
-
A review of company participation within clusters, networks, and/or government supported initiatives
-
An updated taxonomy has been used to inform a long list of firms (identified through use of glass.ai web data and by Perspective Economics). This list was subject to automated and manual review, and refined to a final cyber security business list for analysis (n = 2,091)
The business metrics include (but are not limited to):
-
Company name, registered number, company status, and date of incorporation
-
Registered and trading locations (using official and web data)
-
Company website and contact details
-
Core description of company activities related to cyber security
-
Company size[footnote 5] (large / medium / small / micro)
Stage 3: Cyber Security Sectoral Survey
Ipsos conducted a representative survey of 210 cyber security firms from May to July 2023. The survey used the list of firms (n = 2,091) established in Stage 2 of this study as a sample frame from across the UK. The purpose of the survey was to understand firm-level performance, barriers, and collaboration in further detail.
It covered the following topics:
-
The categories of products and services offered across firms
-
The client sectors that cyber security firms work across
-
Revenue estimates (to supplement the other published data found in Stage 2)
-
Extent of export activity, or international collaboration
-
Perceived barriers to growth
-
Understanding areas of collaboration and reasons for working with cyber security partners
Appendix C provides the full technical details for the survey, including the data collection approaches and response rate.
Stage 4: Qualitative Consultations
This research has also been supported through six one-to-one consultations with investors in the cyber security sector. Participants were purposively sampled to reflect variation in size, location, product or service focus, maturity, and investment focus.
Stage 5: Data Blending
In September 2023, the results of the cyber security sector survey were used to inform gaps within the list of identified cyber security sector firms e.g., the extent to which a firm provided cyber security products or services and attributed revenues accordingly. This stage involved data cleaning and augmentation from a range of previous sources (including company level accounts, web data, survey data, and wider desk review) to provide a final dataset of cyber security firms, including the development of firm-level metrics used for analysis within the report.
Stage 6: Data Analysis and Reporting
The final stage involved analysis of the final shortlist of firms to provide estimates of total number of firms, products and services offered, whether firms are ‘dedicated or diversified’ with respect to how much of their activity related to cyber security provision, revenue/GVA/employment estimates, locations (registered, trading, and international presence), investment and survey feedback (anonymised at an individual level).
The data sources used to underpin the sectoral analysis included:
-
glass.ai: web data to help identify and map new providers of cyber security products and services, and match these to the cyber security taxonomy, and to extract and parse key company descriptions and locations for identified company websites
-
Bureau van Dijk FAME (and Companies House Data Product): This platform collates Companies House data and financial statements from all registered businesses within the UK
-
Beauhurst: Beauhurst is a leading investment analysis platform, which enables users to discover, track and understand some of the UK’s high-growth companies e.g., identify investment, accelerator participation, and key information
-
Tussell: Tussell provides market insight into public sector procurement through identifying key contracts, spend, buyers and suppliers
-
Cyber Exchange: techUK’s Cyber Exchange directory enables cyber security providers to register an account and set out the products and services they provide to the market
-
Representative survey of cyber security firms: in Summer 2023, Ipsos conducted a representative survey of cyber security firms. The feedback from 210 providers has been useful to understand the financial performance, growth drivers, and challenges for firms within the market
-
One-to-one qualitative consultations: further, the team has also conducted six one-to-one consultations with investors to gather feedback on the growth and performance of the cyber security sector in the UK
1.2 Consistency with the 2023 Cyber Security Sectoral Analysis
Our approach remains consistent with previous reports (and builds upon the methodology to identify and measure the contribution of the sector). As per previous studies, this report also explores firms that:
-
Have a clear presence within the UK market, through a UK registered business that reports to Companies House on an annual basis
-
Demonstrate an active provision of commercial activity related to cyber security (e.g., through the presence of a website / social media)
-
Provide cyber security products or services to the market (i.e., sell or enable the selling of cyber solutions to other customers)
-
Have identifiable revenue or employment within the UK
-
Appear to be active at the time of writing (i.e., have not, or are not in the process of dissolution)
-
Are not charities, universities, networks, or individual contractors (non-registered) – all excluded for analysis purposes
It also draws upon consistent sources, i.e., company accounts, longitudinal survey data, and Beauhurst for investment data. The financial analysis of firms is also consistent, as it uses company information from the most recent financial year of accounts (analysis undertaken in late 2023, with financial year 2022/23 as the modal year for published accounts) and the underpinning dataset sets out where employment, revenue, GVA and investment are either known or estimated (and the rationale underpinning this).
1.3 Interpretation of the Data
Across this report, percentages from the quantitative data may not add to 100%. This is because:
-
We have rounded percentage results to the nearest whole number
-
At certain questions, survey respondents could give multiple answers
It is also important to note that the survey data is based on a sample of cyber sector firms rather than the entire population. Therefore, they are subject to sampling tolerances. The overall margin of error for the sample of 210 firms (within a population of 2,091 firms) is between c.4 and c.6 percentage points. The lower end of this range (4 percentage points) is used for survey estimates closer to 10% or 90%. The higher end (6 percentage points) is used for survey estimates around 50%. For example, for a survey result of 50%, the true value, if we had surveyed the whole population, is highly likely to be in the range of 44% to 56%. [footnote 6]
By contrast, the data from the qualitative consultations is intended to be illustrative of the key themes affecting the cyber security sector, as a whole, rather than a statistically representative view of cyber sector investors.
1.4 Acknowledgements
The authors would like to thank the DSIT team for their support across the study. DSIT and the report authors would also like to thank those that participated within this research, including those that participated within the industry survey, the regional cyber security clusters, consultations, and shared data, knowledge, and feedback to help underpin this study.
Note: The cyber security sector continues to increase in size, scope, and specialisms. We are happy to receive comments and feedback regarding the methodology or findings herein, through contacting cybersecurity@dsit.gov.uk
2. Profile of the UK cyber security sector
2.1 Defining the UK cyber security sector
Within the National Cyber Strategy 2022, cyber security is defined as:
The protection of internet connected systems (to include hardware, software, and associated infrastructure), the data on them, and the services they provide, from unauthorised access, harm, or misuse. This includes harm caused intentionally by the operator of the system, or accidentally, as a result of failing to follow security procedures or being manipulated into doing so.
Therefore, this sectoral analysis seeks to identify businesses active within the UK that provide products or services that enable the protection of internet connected systems and their users.
In line with previous studies, this analysis is focused upon organisations that include all of the following attributes:
-
Have a clear presence within the UK market, through a UK registered business that reports to Companies House on an annual basis
-
Demonstrate an active provision of commercial activity (e.g., through the presence of an active website / social media presence)
-
Provide cyber security products or services to the market (i.e., sell or enable the selling of cyber solutions to other customers) – aligned to the taxonomy set out below
-
Have identifiable revenue or employment within the UK related to cyber security
-
Appear to be active at the time of writing (i.e., have not, or are not in the process of dissolution)
-
Are not charities, universities, networks, and individual contractors (non-registered) – which are all excluded for analysis purposes
The businesses included within this analysis are considered to provide one or more of the following products or services:
-
Cyber professional services, i.e., providing trusted contractors or consultants to advise on, or implement, products, solutions, or services for others.
-
Endpoint and mobile security, i.e., hardware or software that protects devices when accessing networks
-
Identification, authentication, and access controls, i.e., products or services that control user access, for example with passwords, biometrics, or multi-factor authentication
-
Incident response and management, i.e., helping other organisations react, respond, or recover from cyber attacks
-
Information risk assessment and management, i.e., products or services that support other organisations to manage cyber risks, for example around security compliance or data leakage
-
Internet of Things (IoT Security), i.e., products or services to embed or retrofit security for Internet of Things devices or networks
-
Network security, i.e., hardware or software designed to protect the usability and integrity of a network
-
SCADA and Information Control Systems, i.e., cyber security specifically for industrial control systems, critical national infrastructure, and operational technologies
-
Threat intelligence, monitoring, detection, and analysis, i.e., monitoring or detection of varying forms of threats to networks and systems
-
Awareness, training, and education, i.e., products or services in relation to cyber awareness, training, or education
Section 2.3 sets out the type of cyber security products and services in further detail.
2.2 Number of Cyber Security Firms Active in the UK
We estimate that there are currently 2,091 firms active within the UK providing cyber security products and services. This reflects a glass.ai and Perspective Economics estimate as of September 2023.
Whilst this reflects an increase in the number of firms offering cyber security products and services (1,979 identified in the previous study), the research team emphasise that this is one metric among many to gauge the health of the sector. For example, this increase includes:
-
Newly registered companies offering cyber security products and services (often very early / small start-ups)
-
Previously registered companies that did not previously offer such services, but have established a product or team to do so recently (e.g., consultancies offering IT risk services)
-
Businesses now identified as providing a relevant cyber security product or service (e.g., identified through provision of an accredited scheme such as Cyber Essentials) where previous web-data matching did not flag such products or services.
-
Businesses with limited web data reporting the provision of cyber security products or services, but which have been flagged through engagement with other sources (e.g., consultation with regional clusters).
Throughout this study, the research team emphasise the need to draw upon a wide range of existing sources, alongside the development and deployment of a cyber security taxonomy against Companies House data, analysis of relevant website domains, and in-depth regional engagement. Within the process, a ‘long list’ of several thousand businesses in the UK was identified as potentially relevant to the cyber security sector using keywords and web data. However, this long list was subsequently filtered to ensure each business demonstrated sufficient alignment to the research parameters and the market taxonomy.
For example, web data can identify firms that may have an active registration with Companies House, have a website or social media presence, and meets the parameters of the taxonomy. However, further review of the presence may indicate a lagging status (e.g., the business may have no true employees or may not appear to be active for several years). The team therefore reviewed more than 3,000 firms in detail, removing organisations that may have mentioned security (e.g., offering a secure data centre service) but did not appear to tangibly offer cyber security products or services to the end-market.
This yielded the 2,091 firms in scope, and the research team considers this to be an appropriate figure to gauge the health and composition of the sector whilst ensuring consistency with previous analysis.
We do however note, that as with all emerging sectors, subtle differences in definition can result in varying interpretations of the size and composition of activity. In this respect, there may be other relevant cyber security use cases, which could in future meet the short list requirements (i.e., the six conditions set at the beginning of Section 2.1) and could therefore be included in future analysis. This might include, for example, firms involved in areas such as FinTech, RegTech[footnote 7] or Safety Tech[footnote 8]. However, we provide these parameters to avoid duplication, and provide DSIT with a health check regarding the overall cyber security market.
There are also businesses operating within the UK that may, for example, resell cyber security solutions (anti-virus, anti-malware, spam filtering etc) through a broader package of managed IT support. As this cyber security spend should be reflected in the revenues of those providing rather than reselling these solutions, we place less focus on the role of resellers within the sectoral analysis (although do include a small number of larger resellers that offer cyber security advisory services and implementation support).
Overall, this process means that the 2,091 firms for analysis within this report have been assessed and verified as providers of cyber security products and solutions. We provide a high-level breakdown of this provision in subsequent chapters. Given the breadth of ‘cyber security’ as a term, we endeavour to be clear regarding what is in scope, what is being measured, and why this matters, for the sector and for the wider economy and society. The following sub-sections set out an overview of the number of companies by size; the breakdown between companies that appear dedicated or diversified; and the products or services provided by each company.
For the 2,091 cyber security firms, Figure 2.1 and Table 2.1 demonstrate the breakdown by size.[footnote 9]
Figure 2.1: Number of Registered Cyber Security Firms by Size
| Large | 174 (8%) |
| Medium | 258 (12%) |
| Small | 506 (24%) |
| Micro | 1,153 (55%) |
Source: Perspective Economics, glass.ai (n = 2,091)
Within the UK, the vast majority of all businesses are Small and Medium Enterprises (SMEs), and it is therefore to be expected that the majority of registered businesses within the cyber security sector are small (24%) or micro (55%) in size.
As this study focuses upon businesses with at least one member of staff, the following comparison is noted between the UK’s cyber security sector, and the broader UK business population. This highlights that, despite the cyber security sector containing a considerable proportion of micro and small businesses, there are many providers of scale operating within the UK market (i.e., 20% of businesses offering cyber security products and services to market are medium or large, compared to c. 3% of all businesses[footnote 10] in the UK).
Comparison of the Size of Cyber Security Firms and Wider Business Population
| Size | UK Business Population Estimates (2023) | Percentage | Cyber Sectoral Analysis | Percentage[footnote 11] |
|---|---|---|---|---|
| Large (250+ employees) | 7,960 | <1% | 174 | 8% |
| Medium (50-249) | 6,905 | 3% | 258 | 12% |
| Small (10-49) | 222,785 | 15% | 506 | 24% |
| Micro (1-9) | 1,177,335 | 81% | 1,153 | 55% |
| All Businesses with at least 1 employee | 1,444,985 | 100% | 2,091 | 100% |
Change in Size
Following last year’s sectoral analysis, we have tracked the performance of each firm (n = 1,979 in the previous study) to understand how the size of cyber security firms has changed (where applicable) in the last 12 months.
The left side of the Sankey diagram (Figure 2.2) shows the size of cyber security firms as identified in the 2023 study, with the right side showing their updated size currently. As this is a brief time period, the size composition of firms remains fairly static.
However, this does highlight that 4.1%[footnote 12] of firms appear to have closed or are no longer fully trading within the last 12 months. This is a lower closure rate to that identified within the previous study (6.1% in 2023). It is also lower than the whole economy business closure rate of 11.8% in 2022.
Figure 2.2: Sankey Flow Chart – Size (2022 Study – 2023 Study)
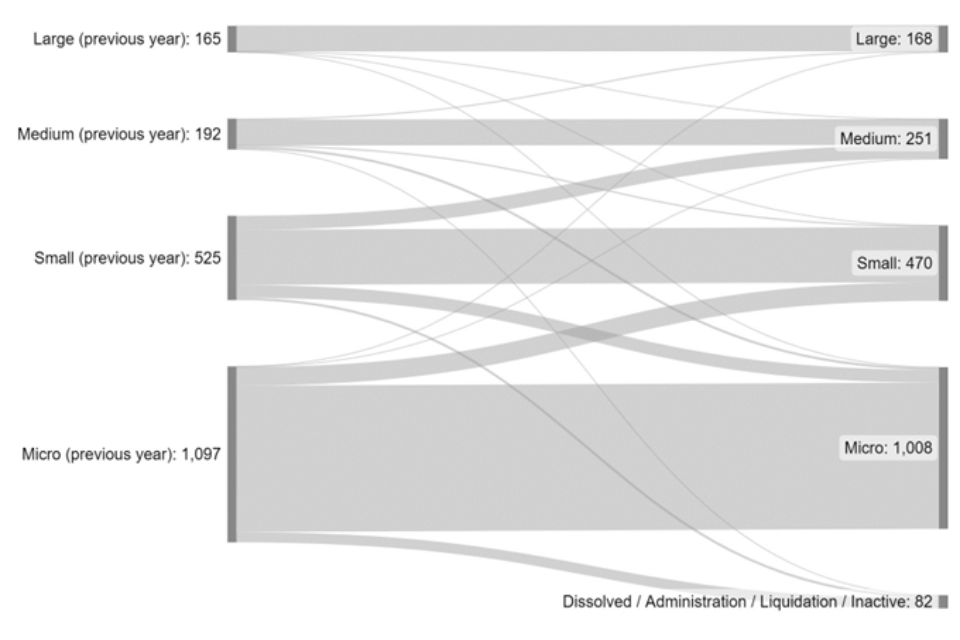
Source: Perspective Economics (n=1,979)
Dedicated and Diversified Providers of Cyber Security Products and Services
Within this research, we attempt to categorise firms by whether they are either:
-
Dedicated (or ‘pure-play’), i.e., most (>75%) of the business’ revenue or employment can be attributed to the provision of cyber security products or services
-
Diversified, i.e., less than 75% of the business’ revenue or employment can be attributed to the provision of cyber security products or services
Figure 2.3 Dedicated and Diversified Providers
| Diversified | 29% |
| Dedicated | 71% |
Source: Perspective Economics (n = 2,091)
The rationale underpinning the need to provide this distinction is attributable to seeking to understand how firms either set up to solely provide cyber security, or firms that provide cyber security as one product or service among others vary with respect to size, scale, growth, and market activity.
Within the current dataset, almost three-quarters (71%) of firms are dedicated providers of cyber security products and services. This reflects no change from the previous study.
Disaggregating these firms by size (as below in Figure 2.4) also highlights that micro and small firms within this analysis are much more likely to be dedicated (85% and 65% respectively), whereas there are few large dedicated cyber security firms (18%).
In other words, this reflects the tendency for several large and medium sized companies in the UK to establish cyber security practices to complement existing provision, e.g., management consultancies, managed service providers, or telecoms firms developing a cyber security division that sells to the market. This also includes a range of larger diversified firms developing cyber security products or solutions tailored towards markets such as aerospace and defence, critical national infrastructure, and professional services.
Figure 2.4 Dedicated / Diversified Cyber Security Firms by Size
| Type of Firm | Dedicated | Diversified |
|---|---|---|
| Large | 18% | 82% |
| Medium | 54% | 46% |
| Small | 65% | 35% |
| Micro | 85% | 15% |
Source: Perspective Economics (n=2,091)
2.3 Products and Services Provided
In order to understand the products and services provided by the UK cyber security sector, DSIT and the research team use a taxonomy (as summarised below) to categorise each of the products and services offered.
This provides a high-level overview of the UK’s cyber security product and service offer. This taxonomy remains broadly consistent with previous years; however, the underlying keywords and terms have been revisited and updated. Further, the use of web data and manual review means that firms can be classified into taxonomy areas through both the text available, and the analyst decision regarding key products and services. This means that the following data reflects an interpretation of the key products and services offered. It is therefore indicative of the main solutions provided by the UK cyber security sector.
In previous studies, the cyber security business survey had asked respondents which products and services they provide (against the taxonomy areas); however, this found that many respondents report to offer all or most of these products and services, which made delineation between specialisms difficult to measure. Therefore, we take a top-down review of products and services using the text data available through web data review.
Taxonomy Definitions:
| Taxonomy Category | Agreed Definition (Short) |
|---|---|
| Cyber professional services | Providing trusted contractors or consultants to advise on, or implement, cyber security products, solutions, or services for others. |
| Endpoint and mobile security | Hardware or software that protects devices when accessing networks |
| Identification, authentication, and access controls | Products or services that control user access, for example with passwords, biometrics, or multi-factor authentication |
| Incident response and management | Helping other organisations react, respond, or recover from cyber attacks |
| Information risk assessment and management | Products or services that support other organisations to manage cyber risks, for example around security compliance or data leakage |
| Internet of Things | Products or services to embed or retrofit security for Internet of Things devices or networks |
| Network security | Hardware or software designed to protect the usability and integrity of a network |
| SCADA and Information Control Systems | Cyber security specifically for industrial control systems, critical national infrastructure, and operational technologies |
| Threat intelligence, monitoring, detection, and analysis | Monitoring or detection of varying forms of threats to networks and systems |
| Awareness, training, and education[footnote 13] | Products or services in relation to cyber awareness, training, or education |
Source: Ipsos, Perspective Economics and Centre for Secure Information Technologies
Further, we also classify each company by whether they provide (as their main cyber security offering) products, services, managed security services, or act as a cyber security specific reseller:
-
Cyber security product(s): i.e., the business has developed and sells a bespoke product (hardware or software solution) to the market
-
Cyber security service(s): i.e., the business sells a service to the market e.g., cyber security advisory services, penetration testing etc
-
Provide Managed Security Services: i.e., the business offers other organisations some degree of cyber security support e.g., establishes security protocols, monitoring, management, threat detection etc – typically for a monthly or annual fee
-
Resellers: i.e., the business packages and resells cyber security solutions (usually through licencing agreements)
This approach helps policymakers, industry, and investors understand how many companies there are focusing on a particular subsector of the market or offering new products or solutions accordingly.
Product and Service Provision
Figure 2.5 sets out an analysis of how many companies appear to be focused upon product or service provision. It is worth noting that in reality, there will be some overlap where firms provide both products and services; however, this approach selects one category per firm. Overall, analysis of company trading descriptions suggests that over 7 in 10 (72%) of firms are mainly involved in service provision (including managed services and reselling[footnote 14]), and just under 3 in 10 (27%) are mainly involved in cyber security product development. This is consistent with the 2023 study.
In the previous study, there were 558 product firms. This has only increased to 570 (+12, +2%) providers. However, the number of service providers has increased from 1,088 to 1,178 (an increase of 90 providers, +8%). This suggests that most of the growth in company registrations in the UK cyber security sector is driven by service provision.
Figure 2.5 Number of Registered Cyber Security Firms by Product/Service Focus
| Service | 1,178 (56%) |
| Product | 570 (27%) |
| MSP | 327 (16%) |
| Reseller | 17 (1%) |
Source: Perspective Economics (n = 2,091)
Taxonomy Breakdown
Within this study, we have matched company descriptions (in their own words through website analysis) with the key terms within each taxonomy category, followed by a manual and automated check to assign companies to one (or more) taxonomy categories with respect to their product and service provision.
On this basis, Figure 2.6 is based upon our analysis of trading descriptions.
We find that that companies offering solutions in Threat Intelligence, Monitoring, Detection and Analysis has increased the most over the last year (from 56% to 73%), as well as SCADA and ICS (from 4% to 19%).
Figure 2.6 Number of Registered Cyber Security Firms by Taxonomy Offering
| Threat Intelligence, Monitoring, Detection and Analysis | 76% |
| Cyber Professional Services | 62% |
| Endpoint Security (including Mobile Security) | 59% |
| Information Risk Assessment and Management | 55% |
| Incident Response and Management | 42% |
| Network Security (including perimeter and application) | 38% |
| Training, Awareness and Education | 24% |
| Identification, Authentication and Access Control | 21% |
| SCADA and ICS | 19% |
| IoT (including devices, automotive and connected home) | 5% |
Source: Perspective Economics (n = 2,091)
3. Location of cyber security firms
3.1 Introduction
This chapter explores the registered location (i.e., where each business has located its registered address with Companies House), and the active office locations (i.e., where each business has a trading presence or office across the UK) of cyber security firms.
Understanding the registered and trading addresses of cyber security firms in the UK enables regional analysis and supports the evidence-based identification of notable clusters or hotspots of activity. We have identified 3,391 office locations for the 2,091 firms identified within this study. In other words, a median firm has two office locations across the UK (of which, one will be a ‘registered’ location with Companies House).
Please note that this number is smaller than the 2023 study (n = 4,970). This is due to an updated search algorithm which identifies active (and cyber related) office provision, and also a reduction in the number of active satellite offices.
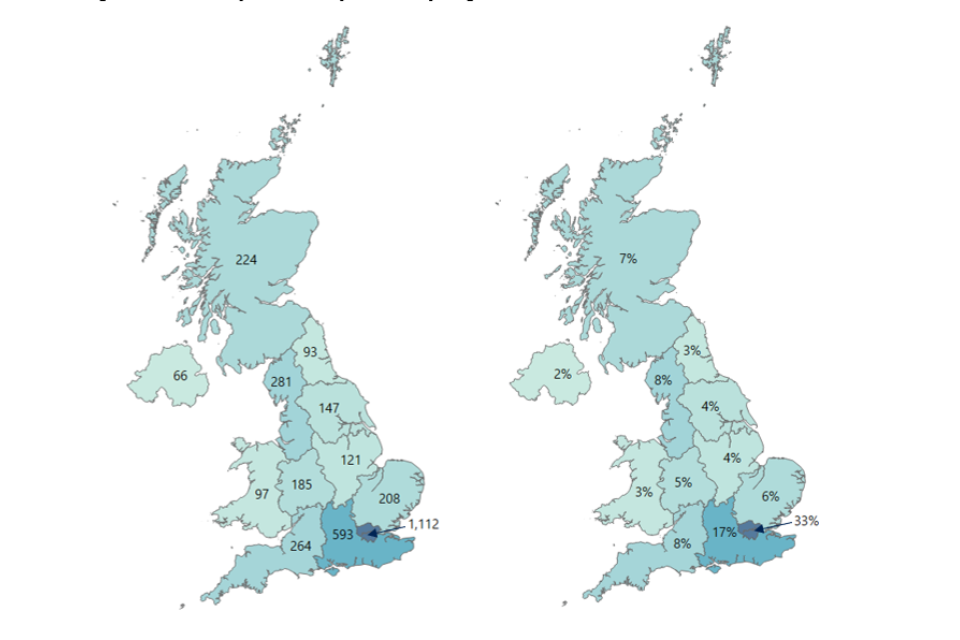
3.2 Location of Cyber Security Firms in the UK
Figure 3.1 sets out the breakdown of firms by number of UK office locations identified in each of the twelve regions. This highlights the importance of identifying local units of activity in the UK (marked in blue below) when seeking to understand regional activity, as registered locations can be skewed towards London and the South East.
Figure 3.1 Percentage of Cyber Security Firms by Location
| London | 33% |
| South East | 17% |
| North West | 8% |
| South West | 8% |
| Scotland | 7% |
| East of England | 6% |
| West Midlands | 5% |
| Yorkshire and the Humber | 4% |
| East Midlands | 4% |
| Wales | 3% |
| North East | 3% |
| Northern Ireland | 2% |
Source: Perspective Economics (n=3,391)
Active (Local Offices)
Figure 3.2 sets out the number of active offices identified within this study by UK region. Overall, the data suggests that half (50%) are based outside of London and the South East regions. Further exploration of regional office data suggests no significant proportional changes at the regional level (proportional to overall size of the UK market).
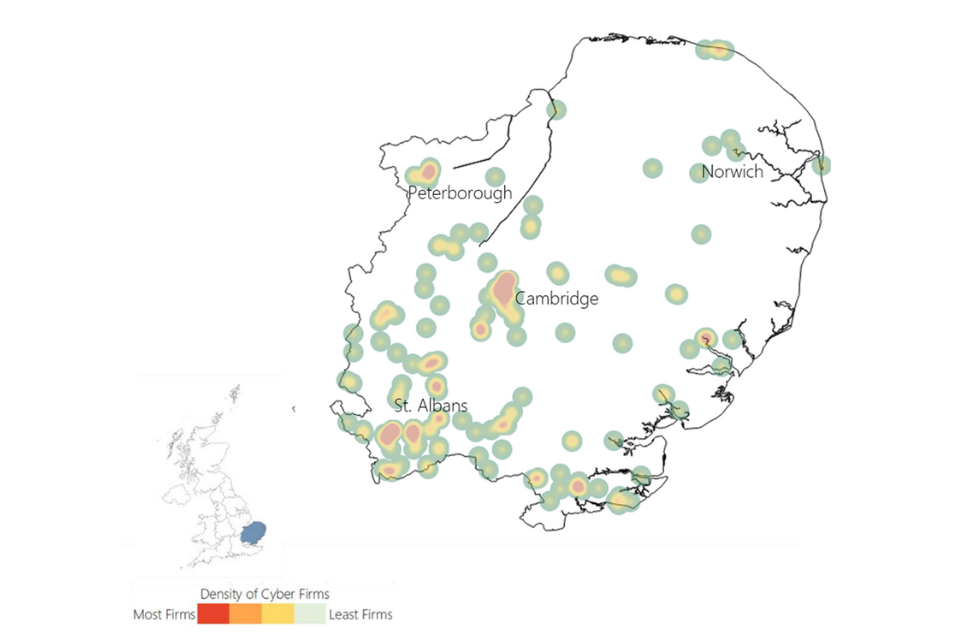
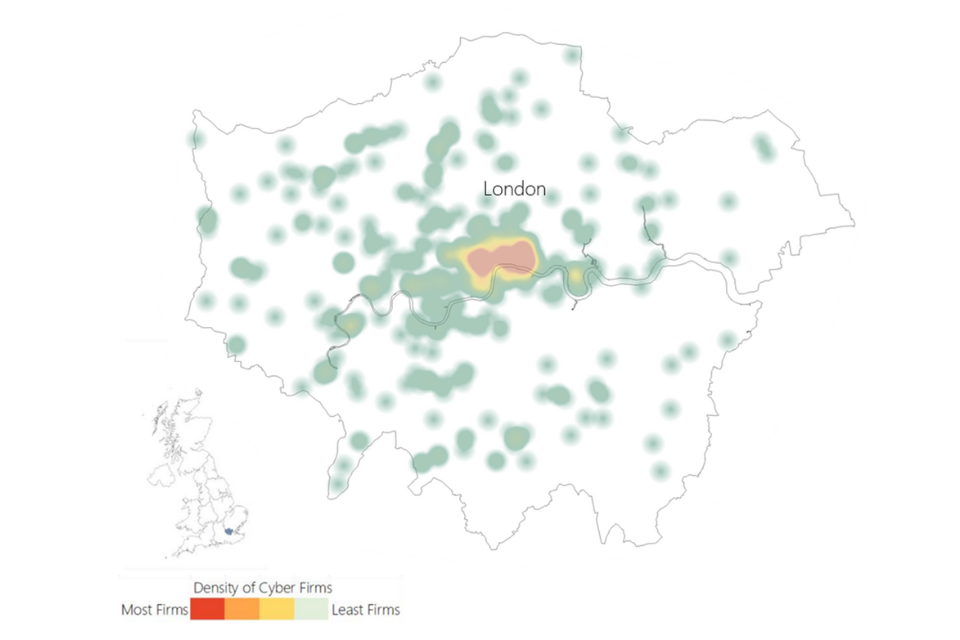
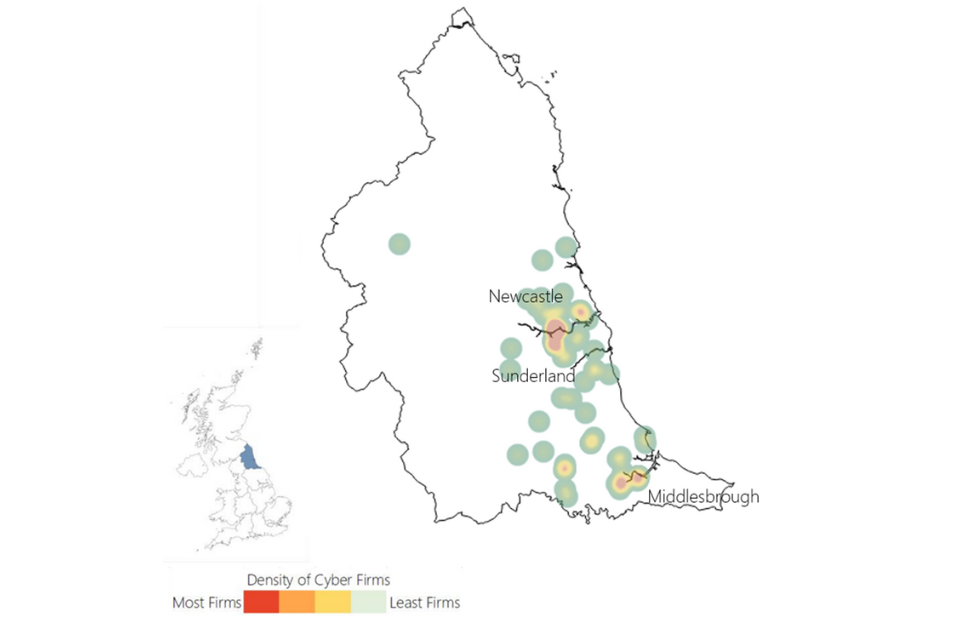
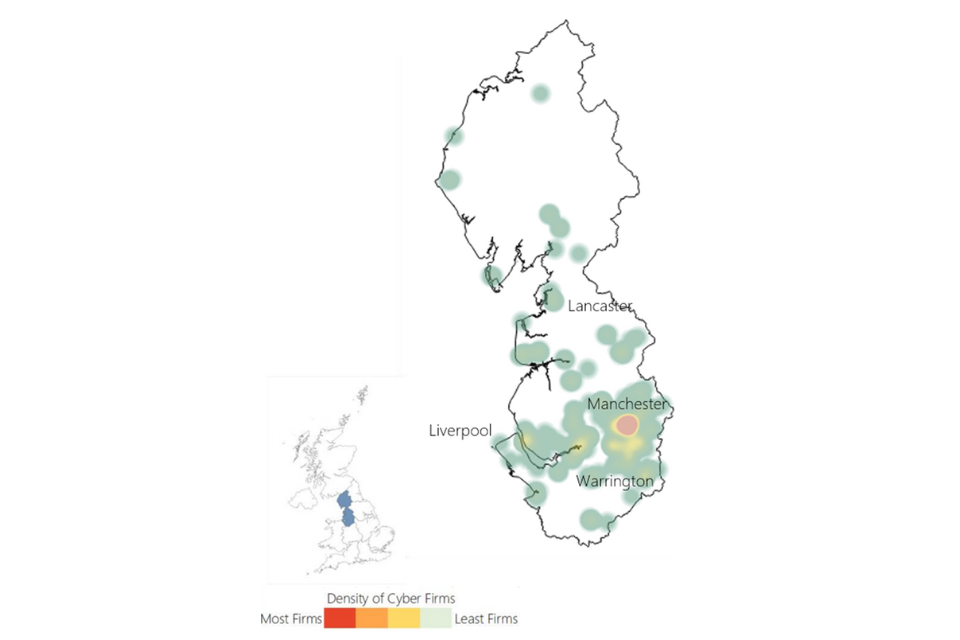
Figure 3.3 also highlights the number of active offices by Travel to Work Area (TTWA)[footnote 15], and emphasises sustained hotspots in areas such as Greater Manchester, Bristol and Bath, Cambridge, and Newcastle.
Figure 3.2 Active Cyber Security Offices by Region
Source: Perspective Economics (n=3,391)
Figure 3.3 Active Cyber Security Offices by Travel to Work Area (TTWA)
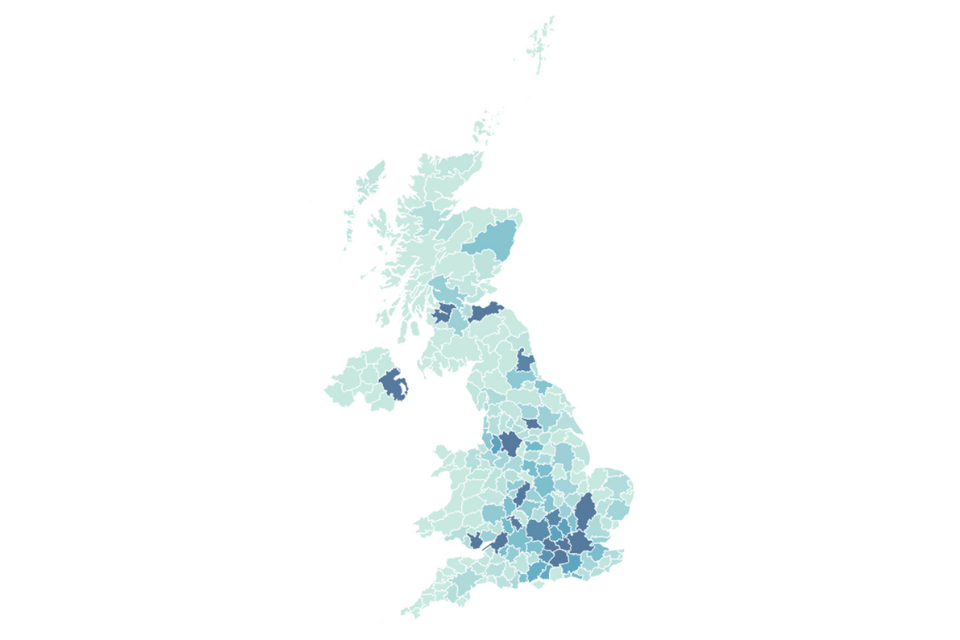
Source: Perspective Economics (n=3,391) (Darkest blue denotes any TTWA with >50 active offices)
3.3 International Activity
This section outlines where UK registered cyber security firms have an established physical presence in another country. This helps to inform a further understanding of where firms are exporting, are engaged in international markets, or where multinational firms have a presence in the UK. For the 2,091 providers of cyber security products and services, we have identified:
-
230 UK-headquartered cyber security businesses with a physical presence in international markets (denoted by an office presence); and
-
A further 180 cyber security businesses active in the UK appear to be headquartered or originate from outside the UK
For the 230 UK-headquartered cyber security businesses, the following chart sets out the main trading regions (totalling to more than 100%, since firms have offices across multiple locations):
Figure 3.4 Regions with an international presence (by UK-headquartered Cyber Security Firms)
| United States | 59% |
| EU / EEA | 41% |
| Australia | 16% |
| India | 13% |
| Canada | 12% |
| Ireland | 11% |
| Germany | 10% |
| France | 9% |
| South Africa | 8% |
| Netherlands | 7% |
Source: Perspective Economics (n = 230)
As with previous years, the United States and European Union / European Economic Area are core markets for international trading[footnote 16]. In recent years, the UK has also been a clear international destination for foreign direct investment (FDI) in cyber security. We have also identified where international firms (n = 180) have set up a physical presence in the UK (related to cyber security). We find that key nations (by count) include the US, Ireland, Israel, Australia, and Canada.
4. Economic contribution of the UK cyber security sector
4.1 Estimated Revenue
In the most recent financial year, annual cyber security revenue within the sector is estimated at £11,859 million (rounded to £11.9 billion). This reflects a significant increase of 13%[footnote 17] from last year’s study (£10.5 billion).
This figure is estimated using:
-
Revenue figures available for dedicated (100%) cyber security firms that publish annual accounts
-
Revenue figures available for diversified cyber security firms (multiplied by the estimate of the proportion of the firm’s activity related to cyber security)
-
Estimated cyber security revenue within the cyber sector survey (for the most recent financial year)
-
Where gaps exist, employment has been sourced or estimated, with revenue estimated using ‘revenue per employee’ (estimated by size using known data) multiplied by ‘number of employees’ to provide an estimated revenue figure on a firm-by-firm basis.
This revenue estimate relates to revenue attributable to cyber security activity only. The following subsections set out revenue by size, revenue by size and dedicated/diversified categorisation, and revenue by key company offer. Please note that as the analysis was undertaken in late 2023, we use the most recent financial year reporting data where possible, which means that much of the revenue will have been achieved through work delivered and billed in 2022 (e.g., if a company has a financial year ending March 2023, those accounts will reflect billed work from April 2022 – March 2023).
Revenue by Firm Size
We estimate that three-quarters (£8.9 billion, 75%) of all UK cyber security revenue is earned by large firms (which further demonstrates the earning power of these firms given that they reflect 8% of all market providers). This includes several very large firms in telecommunications, aerospace, defence and security, and consultancies for which the size and scale of their respective cyber security product and service divisions reflect a considerable proportion of the wider market.
Medium firm revenues have maintained a revenue share of 16%, with a notable increase from £1.6 billion to £1.9 billion in the last twelve months. Small firms have seen a slight reduction in revenues over this period (from £893 million to £862 million), and micro firms have broadly maintained revenue levels (from £267 million to £262 million). This may reflect inflationary considerations over the most recent twelve months, whereby some practices have determined to increase prices in line with cost pressures, whereas other providers may have determined to take an effective real-term hit in revenue to maintain market competitiveness.
Figure 4.1 Total Cyber Security Revenue by Size of Firm
| Large | £8,866M (75%) |
| Medium | £1,869M (16%) |
| Small | £862M (7%) |
| Micro | £262M (2%) |
Source: Perspective Economics (n=2,091)
Segmentation of revenue by both size and by whether the firm is understood to be ‘dedicated’ or ‘diversified’ also provides an interesting overview of which firms are driving the revenue within the sector.
This highlights that ‘diversified’ firms continue to generate significant revenues through their cyber security offer. However, for Small and Medium Enterprises (SMEs), dedicated cyber security firms generate the greatest proportional revenue (i.e., c. 88% of revenues for each of the SME categories).
Figure 4.2 Total Cyber Security Revenue by Size by Dedicated / Diversified Status
| Firm Size | Dedicated | Diversified |
|---|---|---|
| Large | £3,846M | £5,020M |
| Medium | £1,651M | £218M |
| Small | £762M | £100M |
| Micro | £235M | 27M |
Source: Perspective Economics (n = 2,091)
This suggests that the UK market remains home to:
-
Approximately 20 ‘anchor’ large and diversified firms, which are estimated to generate over £50 million each in cyber security revenues. This can often be a very small proportion of the firm’s revenues (often in £ billions) but reflects a significant proportion of the UK’s cyber sector
-
A significant ‘dedicated’ and growing middle market: There are now 105 firms (an increase from 93 last year) that we have identified as dedicated providers of cyber security with over £10 million in annual revenues
Finally, segmentation of revenues by size and by those companies that either provide (as a core role) cyber security products, services, managed security services, or resell (set out in Figure 4.3) also provides some useful insight.
Overall, service providers (including Managed Service Providers (MSPs) and Managed Security Service Providers (MSSPs)) are generating approximately £6.2 billion in cyber security related revenues (up from £5.7 billion last year).
The revenue of product companies has increased more substantially to c. £5.5 billion (up from £4.6 billion last year), with strong performances from companies such as Darktrace, Sophos, and Mimecast.
In other words, of the £1.4 billion revenue increase noted at a sectoral level since the previous study, approximately £900 million can be derived to product firms, and £500 million to service firms – suggesting a particularly strong year for larger product companies. The majority of this growth has been driven by larger firms.
Figure 4.3: Total Cyber Security Revenue by Size and by Offering
| Offering | Large | Medium | Small | Micro | Total |
|---|---|---|---|---|---|
| Product | £4,032M | £1,045M | £324M | £67M | £5,468M |
| Service | £2,767M | £580M | £423M | £167M | £3,937M |
| MSP | £1,921M | £219M | £114M | £28M | £2,282M |
| Reseller | £146M | £25M | £0M | £0M | £171M |
Source: Perspective Economics (n = 2,091)[footnote 18]
4.2 Estimated Employment
We estimate that there are 60,689 Full Time Equivalents (FTEs) working in a cyber security related role across the 2,091 cyber security firms identified. Please note that this figure only relates to the number of estimated FTE cyber security professionals working within cyber security sector firms.
This reflects an increase of 5% (up from 58,005 last year) in employee jobs within the last 12 months. This growth is lower than seen in previous years (typically 8 – 12% per annum) and reflects some softened growth with the sector with respect to employment levels. This is explored further in the DSIT Cyber Security Skills in the UK Labour Market (2024) report.
Company level employment is initially estimated at the registered level (i.e., this suggests concentrated employment within Greater London and the South East is 74% of the UK figure). However, as this reflects employment at a registered level, this has the effect of underestimating employment for the other regions, whereby employers have employees across the UK. As such, in Figure 4.4, we provide the estimated ‘actual’ employment breakdown by region. This estimate draws upon Perspective Economics modelling[footnote 19] of key regional employers.
Figure 4.4 Estimated Cyber Security Employment by Region
| Region | Estimated true employment | Registered-level employment |
| London | 29% | 45% |
| South East | 13% | 29% |
| North West | 10% | 6% |
| South West | 9% | 3% |
| Scotland | 7% | 2% |
| West Midlands | 7% | 2% |
| Yorkshire and the Humber | 7% | 2% |
| East of England | 5% | 6% |
| Northern Ireland | 4% | 1% |
| Wales | 4% | 1% |
| East Midlands | 3% | 1% |
| North East | 2% | 1% |
Source: Perspective Economics (n = 60,689 FTEs)
Analysis of estimated cyber security employment by company size (Figure 4.5) demonstrates that, in line with last year’s findings, most cyber security employment remains concentrated within large firms (65%). The average size of a cyber security related team has remained consistent with last year’s study, at 29 staff.
Figure 4.5 Estimated Cyber Security Employment by Size of Firm
| Large | 39,624 |
| Medium | 12,555 |
| Small | 6,270 |
| Micro | 2,240 |
| Total | 60,689 |
Large: 39,624 (Average Cyber Team: 228, Median Cyber Team: 57)
Medium: 12,555 (Average Cyber Team: 49, Median Cyber Team:38)
Small: 6,270 (Average Cyber Team: 12, Median Cyber Team: 11)
Micro: 2,240 (Average Cyber Team: 2, Median Cyber Team: 1)
Total: 60,689 (Average Cyber Team: 29, Median Cyber Team: 2)
Source: Perspective Economics (n=60,689)
Figure 4.6 sets out employment segmented by ‘Dedicated’ and ‘Diversified’ firms. This suggests that in the most recent twelve months, despite softened employment growth across the wider cyber security sector – most of the employment growth has taken place within ‘diversified’ firms e.g., wider consultancies – with diversified employment share increasing from 39% to 41% in the past year.
Figure 4.6 Estimated Cyber Security Employment by Dedicated / Diversified
| Dedicated | 36,107 (59%) |
| Diversified | 24,582 (41%) |
Source: Perspective Economics (n=60,689)
Figure 4.7 also sets out cyber security related employment segmented by company core offering. Just under two-thirds (62%) of employees work within a company that primarily offers cyber security services or managed services, compared to 38% that work primarily within a product environment. The number of staff working within product companies has increased from 15,278 (2021 report, 33% of cyber security staff) to 18,813 (2022 report, 36% of cyber security staff) to 21,339 (2023 report, 37% of cyber security staff) to 23,153 (current report, 38%). This suggests a trend which highlights a drive for increased employment within cyber security product firms in the UK.
Figure 4.7 Estimated Cyber Security Employment by Offering
| Service | 27,016 (45%) |
| Product | 23,153 (38%) |
| MSP | 10,054 (17%) |
| Reseller | 466 (1%) |
Source: Perspective Economics (n=60,689)
4.3 Estimated Gross Value Added (GVA)
Gross Value Added (GVA) is used as a measure of productivity (at a firm level, or above). It captures the sum of a firm’s Gross Profit, Employee Remuneration, Amortisation and Depreciation. In this respect, any increase in GVA can highlight an improvement in the performance of a firm or a sector, as evidenced through higher profitability or enhanced earnings.
We estimate that within the most recent financial year, cyber security related GVA (for the 2,091 firms) has reached £6.5 billion (£6,450 million). This is an increase of £222 million (+4%) since last year’s report.
Figure 4.8 sets out an overview of GVA (compared to revenue) by size of firm.
Overall, this data suggests a slightly reduced GVA-to-turnover ratio of 0.54:1 (i.e., for every £1 of revenue the sector generates, 54p in direct GVA is generated, compared to 60p last year).
Table 4.2 also sets out the estimated GVA per employee at £106,285 per employee. This is a slight decrease of 1% from the previous year’s estimate of £107,400). GVA per employee provides an estimate of labour productivity in the sector, as it typically captures remuneration and profitability.
Figure 4.8: Total Cyber Security Revenue and GVA by Size of Firm
| Firm Size | Estimated Cyber Security Related Revenue | Estimated Cyber Security Related GVA |
|---|---|---|
| Large | £8,866M | £4,427M |
| Medium | £1,869M | £1,244M |
| Small | £862M | £624M |
| Micro | £262M | £155M |
Time-Series Analysis
The table below sets out the key metrics for the cyber security sector, as tracked by each sectoral study since 2017. Green denotes strong growth (year-on-year), and amber denotes softer growth (<5%).
Table 4.1: Key Sector Metrics (since 2017)
| Year | Number of Firms | Change | Employment | Employment | Revenue | Revenue | GVA | GVA | Investment (Dedicated) | Investment (Dedicated) |
|---|---|---|---|---|---|---|---|---|---|---|
| 2017 | 846 | 44% | 31,339 | 37% | £5,682m | 46% | £2,349m | 61% | £238m | 28% |
| 2019 | 1,221 | 44% | 42,855 | 37% | £8,293m | 46% | £3,774m | 61% | £305m | |
| 2020 | 1,483 | +21% | 46,683 | +9% | £8,878m | +7% | £4,003m | +6% | £821m | +169% |
| 2021 | 1,838 | +24% | 52,727 | +13% | £10,146m | +14% | £5,326m | +33% | £1,013m | +23% |
| 2022 | 1,979 | +8% | 58,005 | +10% | £10,462m | +3% | £6,228m | +17% | £302m | -70% |
| 2023 | 2,091 | +6% | 60,689 | +5% | £11,859m | +13% | £6,450m | +4% | £271m | -10% |
| Estimated CAGR (2017 – 23) | +16% | +12% | +13% | +18% |
4.4 Summary
The table below sets out the key findings regarding the economic contribution of the UK’s cyber security sector.
Table 4.2: Summary of Cyber Sector Economic Contribution
| Size | Number of Firms | Estimated Revenue (Cyber Security Related) | Estimated GVA (Cyber Security Related) | Estimated Employment (FTE) (Cyber Security Related) | Estimated Revenue per employee | Estimated GVA per employee |
|---|---|---|---|---|---|---|
| Large | 173 | £8,866m | £4,427m | 39,624 | £223,742 | £111,721 |
| Medium | 254 | £1,869m | £1,244m | 12,555 | £148,895 | £99,069 |
| Small | 496 | £862m | £624m | 6,270 | £137,420 | £99,583 |
| Micro | 1,169 | £262m | £155m | 2,240 | £117,023 | £69,348 |
| Grand Total | 2,091 | £11,859m | £6,450m | 60,689 | £195,401 | £106,285 |
Source: Perspective Economics
5. Investment in the UK cyber security sector
5.1 Introduction
This section draws upon the Beauhurst platform which tracks announced and unannounced investments in high-growth companies from across the UK. Our team has matched Company Registration Numbers and Company Names identified within this current analysis with the platform to identify 1,143 fundraisings[footnote 20] associated with 527 tracked companies. In other words, approximately 1 in every 4 firms identified within our analysis has received some form of external investment or fundraising since incorporation.
This chapter focuses on investment activity within the full year of 2023 (1st January – 31st December), and typically explores investment raised by dedicated cyber security firms.
5.2 Investment to Date
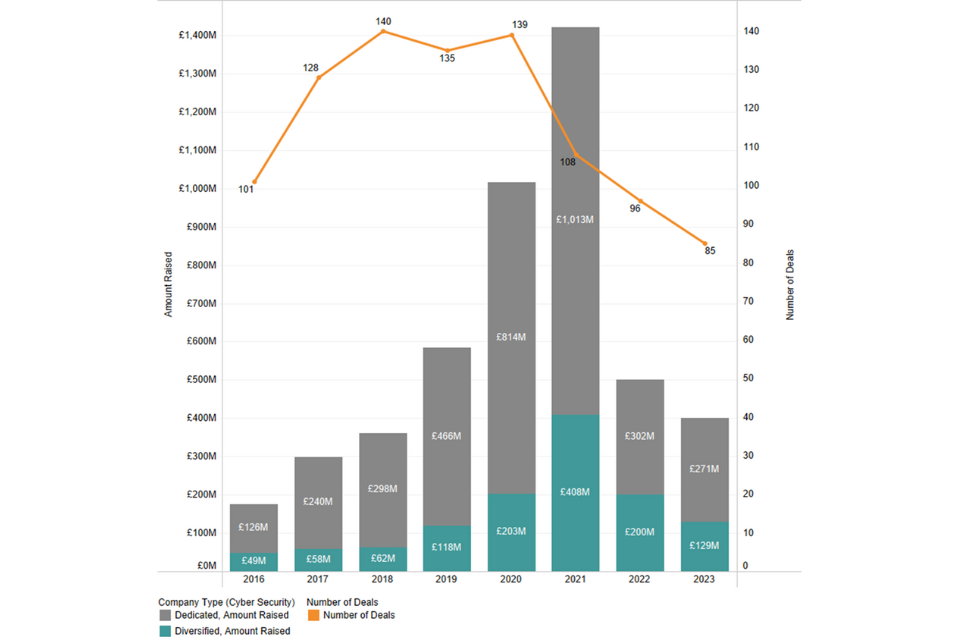
The investment timeline (Figure 5.1) demonstrates that 2023 has remained stable but challenging for cyber security investment compared to previous years. The investment data highlights that cyber security firms (dedicated and diversified) raised approximately £400 million in 2023 across 85 deals.
This includes £271 million raised across 71 deals within dedicated cyber security firms, which we focus on subsequently.
Between 2019 – 2021, external investment in dedicated cyber security companies reached record figures, particularly in 2020 and 2021, with £814 million raised and £1,013 million raised respectively. However, these high levels were arguably due to wider macroeconomic conditions such as low interest rates, and high demand for investment into technology sectors such as cyber security and AI.
In 2020 and 2021, there were several very large investment rounds raised by some dedicated cyber security firms in the UK, with firms such as Snyk raising over £400 million through Series F, OneTrust raising a Series C investment, and Immersive Labs raising over £53 million. This resulted in high levels of sectoral investment at the aggregate level. This data is also highly subject to variation, as a small number of very large investments can significantly impact quarterly and annual trends.
Since 2022, external investment into private firms has reduced across sectors, as interest rates have risen to address inflation, and as firm-level valuations have been revised. The Beauhurst Equity Investment Update[footnote 21] highlights that, for example, the amount raised by UK private companies across all sectors in H1 2023 (£5.9 billion) is 56% lower than that raised in H1 2022 (£13.5 billion).
Within the previous sectoral analysis, the research team noted that (in 2022), the UK cyber security investment landscape is broadly similar to 2019 levels, which may reflect a ‘return to normal’, rather than a significant loss of investor confidence or engagement.
As shown in Figure 5.1, investment levels into the UK cyber security sector have remained broadly consistent with 2022 levels. There has been a slight reduction in overall amount raised by UK dedicated cyber security firms (reducing from £302 million in 2022 to £271 million in 2023, a decrease of 10%). Dedicated deals have also reduced slightly (from 76 to 71, a decrease of 7%), and the overall number of deals (including diversified cyber firms) has reduced from 96 to 85 (a decrease of 11%).
Figure 5.1: Total Cyber Security Revenue and GVA by Size of Firm
Source: Beauhurst
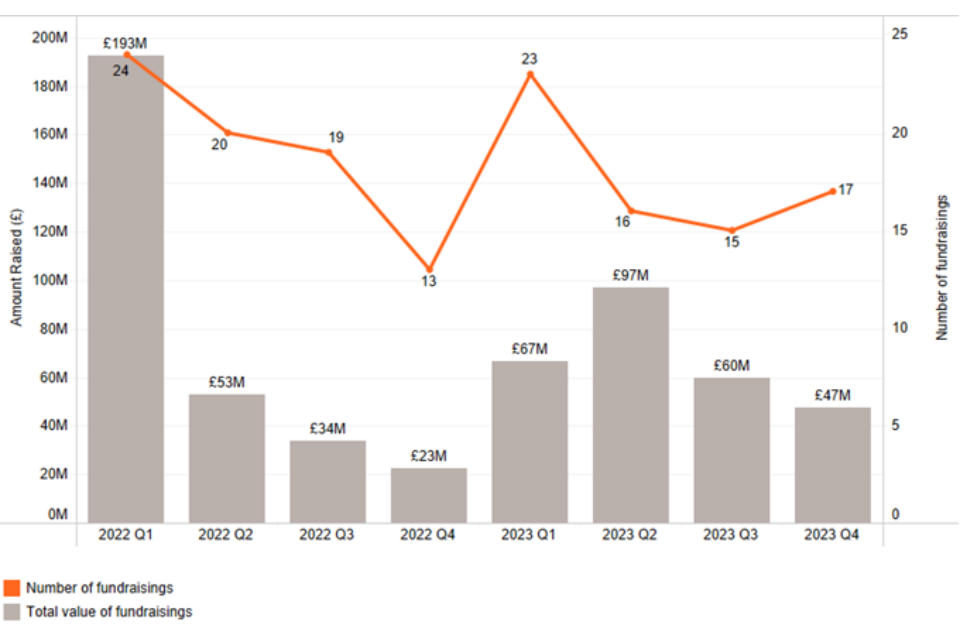
Figure 5.2 highlights the quarterly value and volume of investment raised by dedicated cyber security firms in the UK. Within the previous sectoral analysis, we noted how this demonstrates that the majority of investment (£193 million across 24 deals) was secured in Q1 2022, and had reduced significantly thereafter in 2022, particularly given some of the wider macroeconomic conditions mentioned previously, and as deals were being brought to completion.
Whilst the overall investment raised in 2023 remains similar to 2022 levels, there are some positive findings within the quarterly data. This suggests that:
-
The volume of investment deals is consistent, typically with 15 to 20 new deals each quarter. This means that dedicated cyber security firms are still able to secure external investment from Venture Capitals (VCs) and angel investment, despite wider macroeconomic pressures.
-
The value of fundraisings in each quarter in 2023 remained steadier than in 2022. For example, the lowest quarter was Q4 2023 (£47m) compared to £23m in Q4 2022.
Figure 5.2: Investment Timeline (Quarterly[footnote 22], Dedicated Cyber Security)
Source: Beauhurst
5.3 Investment by Location
Figure 5.3 sets out an overview of investment performance within cyber security by UK region, with respect to value and volume of investment. This highlights that the majority of investment raised (65%) is within cyber security firms based in London and the South East.
However, increasing access to investment across the regions is a key tenet of national cyber security and economic strategy, to support regional start-ups to scale and grow. In 2023, 35% of the investment raised was across the ten regions outside of London and South East. This is a higher proportion than seen in 2022 (25%), and much higher than the 9% in 2021. This is encouraging from a regional perspective, as it suggests increased investor activity across the regions, particularly in areas such as the North West (10%), East of England (9%), Yorkshire and the Humber (8%), and Northern Ireland (6%).
As explored in the previous annual studies, despite this increased regional activity at an aggregate level, there are six UK regions generating less than 1% of the UK total each, which highlights sustained disparity with respect to large scale investments. Despite this, this is the first time since this study commenced that every UK region has had at least one dedicated cyber security investment deal undertaken. This highlights the potential for regional schemes such as UK Cyber Cluster Collaboration (UKC3) and Cyber Runway to support catalysing investment across the regions.
Figure 5.3: Total Investment (Value and Volume, 2023)
| London | £144.9M (54%) |
| South East | £28.5M (11%) |
| North West | £26.0M (10%) |
| East of England | £25.0M (9%) |
| Yorkshire and the Humber | £21.3M (8%) |
| Northern Ireland | £16.9M (6%) |
| Scotland | £3.8M (1%) |
| West Midlands | £1.6M (1%) |
| North East | £1.0M (0%) |
| South West | £0.8M (0%) |
| Wales | £0.5M (0%) |
| East Midlands | £0.3M (0%) |
| London | 30 (42%) |
| South East | 10 (14%) |
| North West | 7 (10%) |
| East of England | 7 (10%) |
| West Midlands | 3 (4%) |
| South West | 3 (4%) |
| Northern Ireland | 3 (4%) |
| Yorkshire and the Humber | 2 (3%) |
| Wales | 2 (3%) |
| North East | 2 (3%) |
| Scotland | 1 (1%) |
| East Midlands | 1 (1%) |
Source: Beauhurst
5.4 Investment by Size
Figure 5.4 sets out the volume of investment by company size within the cyber security sector in 2023.
Figure 5.4: Total Investment by Company Size (2023)
| Medium | £137M (51%) |
| Small | £101M (37%) |
| Micro | £32M (12%) |
Source: Beauhurst
This data suggests that in 2023:
-
Medium sized firms (50-249 employees) have raised £137 million (51%) across 11 deals
-
Small firms (10-49 employees) have raised £101 million (37%) across 31 deals
-
Micro firms (1-9 employees) have raised £32 million (12%) across 29 deals
Within last year’s study, we found that 69% of investment raised was by small and micro firms, and this has reduced to 49% of investment raised. However, the number of deals has reduced only slightly (from 68 to 60) suggesting that whilst investors remain interested in early-stage investments, there remains a strong requirement among VCs and some seed investors for firms to demonstrate recurrent revenue streams prior to investment.
5.5 Investor Views
Across the six investor consultations undertaken by Ipsos in November 2023, investors were also asked about their main criteria for investing in cyber security businesses in the UK, the role of AI in cyber security, their view on the UK as a ‘destination’ for cyber security investment (including regional and national considerations), changes over the last year and how they expect the landscape to develop, and any other feedback on where additional support would help to catalyse further investment. We set out some key feedback below.
Please note that this is a small sample, covering indicative sentiment. It is not considered representative of the full investment community but does provide some insight into key areas.
Criteria for Investing:
Some investors felt that there is appetite to invest in the UK, particularly against competitive valuations at an international level; however, as the UK has just over 500 product companies (where investment typically occurs), additional supply of new businesses would help to increase the number of deals in the long term. Further, typically investors will require some sufficient evidence of current or expected annually recurring revenue prior to investing. Supporting very early-stage companies to commercialisation and revenue generation (e.g., over £1m in Annual Recurring Revenue (ARR)) was seen as a typical priority among the investment community, with support for initiatives such as academic start-ups, and early-stage support.
“There is so much appetite to invest in UK-based cyber companies, but simply not enough companies to invest in.” – Early-stage VC investor
“There needs to be additional support on the product development side, as investors want to help with commercialisation” – VC Investor
“We do not always have a revenue target, but we need proof that companies can sell to buyers and have early signs of a revenue model” - Early-stage VC investor
The role and impact of AI on cyber security investment
All investors recognised the significant role of AI in cyber security, with considered feedback about the impact on the cyber security market. Many investors acknowledged the potentially significant market for securing AI models and their applications, with anticipation that this market will expand as AI strategies become operational within businesses.
However, others highlight that the enhancement of cyber security solutions with AI is not necessarily novel, having been common in many leading UK threat intelligence firms for several years, but acknowledged this is expected to accelerate.
Some investors also highlighted that many startups are keen to include AI within their products; however, they were clear about the need to demonstrate functionality, uniqueness, and differentiation of AI’s core value in a product, rather than an add-on to demonstrate investment readiness.
“AI is the buzzword at the moment, but the key thing is whether it’s part of the value proposition, or a bolt-on” – VC Investor
Views on the UK investment landscape
The UK’s cyber security investment landscape was recognised as having evolved considerably, particularly over the last five years, and is considered a strong destination among other countries such as the US and Israel. Other investors also highlighted that London continues to be a significant hub for investment, but welcome regional initiatives to encourage investment across the UK.
“For the last two decades, the UK cyber market was seen as less than the Israeli market and west coast of US. This is changing very quickly and significantly…we’re now in a second wave of innovation of early-stage companies – a new vintage of companies going into cyber accelerators.” – early-stage UK VC Investor
However, the size and scale of the UK market meant that the volume of deals can be smaller, and as such, investors typically are more likely be collaborative in the UK. However, many investors felt that further support for accelerator and similar schemes could help to broaden the potential number of investment opportunities in future years,
“It’s an investment community rather than a competition” – UK VC Investor
Some investors also highlighted the importance of grassroots innovation and providing more support to role models in the UK cyber security ecosystem to share their knowledge, and to help start new companies, build second firms, or invest directly in other companies or initiatives.
Changes and Expectations
In the past year, the investment landscape has faced macro-economic pressures such as rising interest rates, as well as energy costs, the war in Ukraine, and broader tech layoffs. As set out in Section 5.2, this does impact the level of capital raised through VCs. However, cyber security remains a resilient and salient sector for VCs.
Within the consultations, respondents anticipated a sustained interest in AI and cyber security, but also recognised commercial opportunities in areas such as IoT, Operational Technology, connected and autonomous devices, post-quantum, and privacy. Some investors also noted the importance of cyber security applications that could be applied to certain sectors or use cases, to meet specific sectoral and societal challenges in a commercial way.
Some investors are noted that higher interest rates in 2024, compared to pre-2022, could place some downward pressure on investment rounds, but that there was a sustained need for encouraging new entrepreneurs to develop potentially high-risk, but high-reward products in emerging areas.
Across the consultations, there was a recurring call for government to play a more active role in procurement, funding, and business support initiatives, with an additional emphasis on developing clear funding and pathways for early-stage cyber security firms to develop products that could lead to commercial value.
“We need to build a flywheel effect; more government funding into cyber could mean exponential growth for the sector.” – Cyber Security VC
6. Supporting growth of the sector
6.1 Introduction
This section sets out some of the current initiatives within the UK that support the growth of the cyber security sector. In addition, the Ipsos survey (n = 210) asked cyber security businesses about their key challenges, collaborations, and export activity. The research team also carried out six consultations with cyber security investors to explore their views on the health and potential of the cyber security sector in the UK. This section explores these key findings.
6.2 Recent Investments and Support Initiatives
The National Cyber Strategy 2022 sets out how the government has sought to support the growth of the cyber security sector, through a blend of direct investment in accelerators and growth initiatives, skills and profession support, investment in regions and clusters, and as a key buyer of cyber security products and services.
Some of these initiatives are summarised below:
Growing the sector and exports, and promoting regional growth:
-
Helping cyber businesses find international markets. The UK exported £6.2 billion of cyber services in 2022. Section 6.4 explores export activity among UK cyber security firms identified through the business survey
-
Running Cyber Exchange, a portal for cyber security businesses across all regions of the UK: The Cyber Growth Partnership has been bringing government and industry together to break barriers to growth
-
The UK Cyber Cluster Collaboration (UKC3) is building partnerships between industry, academia, and local government to ensure opportunities and expertise are available across the regions, with over 15 accredited regional clusters across the UK
Supporting businesses to grow and scale:
-
Running initiatives such as NCSC for Startups to help address some of the most important strategic challenges in cyber security
-
Providing funding for schemes such as Cyber Runway, which supports innovators to launch, grow and scale their business – building on the success of LORCA, HutZero, Cyber101 and the Tech Nation Cyber Programme
Encouraging new entrants into the cyber security sector to help tackle the skills gap:
-
The CyberFirst bursary scheme supports undergraduate students and is delivering hundreds of individuals, with work experience, into the cyber workforce every year
-
The CyberFirst courses, Discovery, and Cyber Explorers programmes have engaged hundreds of thousands of young people aged 11-17 in the last five years
-
There are now several cyber apprenticeship standards that have been designed by industry and three cyber offerings for initial learning outcomes offered through the DfE ‘Courses for Jobs’ initiative
-
There have been several cyber bootcamps supported through the recent National Skills Fund, taking people into cyber careers
-
DSIT has also funded the ‘Upskill in Cyber’ programme, delivered by SANS Institute, which has supported hundreds of individuals to be trained and certified in cyber security pathways.
Professionalising the cyber security workforce:
-
The UK Cyber Security Council is a world-first professional authority for cyber security. It sets clear and consistent professional standards, and in October 2023, it recognised the first cohort of over 100 practitioners as ‘Chartered Cyber Security Professionals’.
-
The Cyber Security Body of Knowledge (CyBOK) informs and underpins education and professional training for the cyber security sector
These initiatives continue to help address a range of barriers faced by cyber security businesses. Within this year’s study, survey respondents were asked the extent to which the following barriers impacted their business to some or a great extent (as shown in Figure 6.1).
Figure 6.1: Barriers Reported by Cyber Security Businesses
| Competition for candidates within the cyber sector | 49% |
| Salary demands not affordable | 47% |
| Candidates lacking technical skills | 47% |
| Existing employees lacking non-technical skills | 34% |
| Candidates lacking non-technical skills | 34% |
| Competition for candidates from outside the cyber sector | 31% |
| Staff moving jobs or retiring | 29% |
| Existing employees lacking technical skills | 26% |
Source: Ipsos (n = 210) Percentage of businesses reporting barriers “to a great extent / to some extent”
These barriers remain broadly consistent with previous years; however, the percentage of respondents facing these barriers has increased across the majority of areas over the past twelve months:
-
Competition for candidates within the cyber sector (from 42% to 49%)
-
Salary demands not affordable (41% to 47%)
-
Candidates lacking technical skills (44% to 47%)
-
Existing employees lacking non-technical skills (24% to 34%)
-
Candidates lacking non-technical skills (32% to 34%)
-
Staff moving jobs or retiring (24% to 29%)
-
Existing employees lacking technical skills (22% to 26%)
However, the percentage of respondents stating that competition for candidates from outside the cyber security sector has fallen from 42% last year to 31%.
6.3 Sector Engagement
In the business survey, 86% of cyber security businesses said they engaged with at least one other type of organisation, with 65% engaging with another cyber security business, 60% attending meetup events, 37% engaging with a university or higher education provider, and 42% engaging with other public sector bodies. These levels are higher than last year’s survey (70% of businesses actively engaging with other organisations). This suggests increasing levels of collaborative working across commercial, research, and skills themes. This is summarised in Figure 6.2 below.
Figure 6.2: Businesses that collaborated with at least one of the following organisations in a cyber security activity:
| Other cyber security businesses | 65% |
| Meetup events | 60% |
| Other public sector bodies | 42% |
| Cyber Security Cluster | 38% |
| University or HE provider | 37% |
| Cyber Resilience Centre | 29% |
| LEP / REDA | 26% |
| None of these | 14% |
| Other organisations | 11% |
Source: Ipsos (n = 210)
6.4 Cyber Security Exports
In January 2024, the Department for Business & Trade published the updated UK Security Export Statistics (2022). This suggests that UK cyber security exports have grown from approximately £5 billion in 2021 to £6.2 billion in 2022 (increased by c. 22%).
Within this year’s survey, cyber security businesses were asked if they exported, and if so, what and to which regions. In Figure 6.3, just over two-fifths of businesses (44%) reported that they exported products or services, of which the majority exported to the European Union (75% of exporters), and North America (61% of exporters).
Figure 6.3: Export Regions (for businesses that export)
| European Union | 75% |
| North America | 61% |
| Asia-Pacific | 43% |
| Wider Europe | 34% |
| The Gulf states | 28% |
| Central or South America | 25% |
| Africa | 20% |
Source: Ipsos, n = 103
6.5 Public Procurement
Public procurement plays a crucial role in the health of the cyber security sector, and for improving public sector engagement with innovative cyber security start-ups and techniques. This includes where cyber security firms can sell products, services, and solutions to public sector buyers such as central and local government, law enforcement and policing, NHS, schools etc.
In previous years, we have used Tussell data to identify cyber security related contract notices. For transparency, this measures the number and value of public contracts awarded to UK registered firms related to cyber security. It excludes the award of framework contracts as these can be difficult to identify exact government spending, where the contract value is the same as the framework maximum budget.
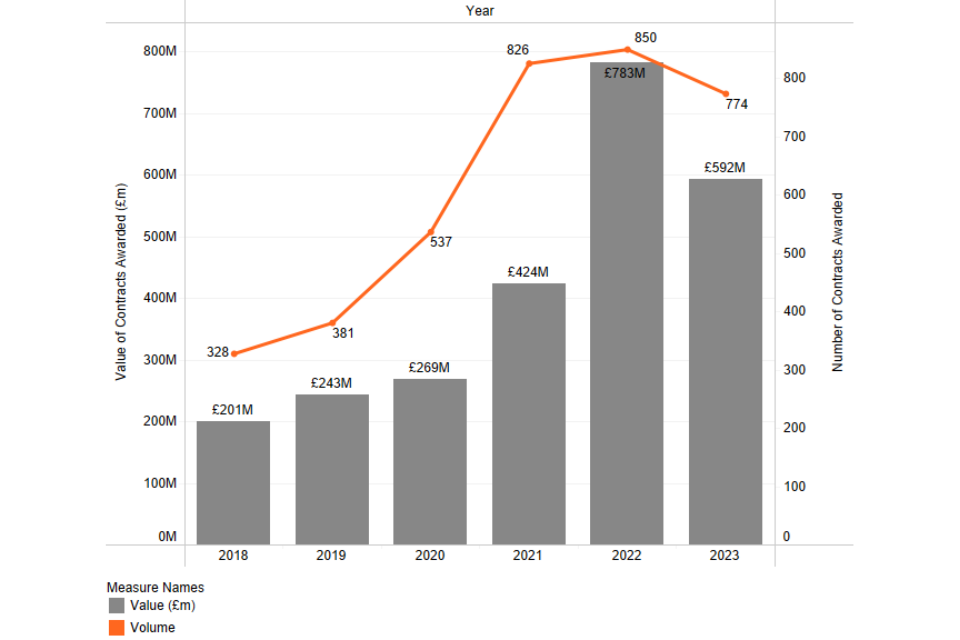
Figure 6.4 highlights the significance of public procurement in growing the UK cyber security ecosystem.
We note that, following publication of successful contract awards, the 2022 data has been revised upwards from the previous study, with 850 contracts awarded to UK cyber security businesses to the value of £783 million. The provisional procurement data for 2023 suggests that public sector demand for cyber security products and services has remained strong, with 774 contracts awarded to the value of £592m.
Figure 6.4: Cyber Security Contracts (Value and Volume)
Source: Tussell (data source on UK government spend and contracts).
Regional snapshots
Introduction
Whilst this report focuses upon the cyber security sector across the entire UK, we set out snapshots of the number of cyber security firms, offices, and estimated percentage of UK cyber security related employment.
East Midlands
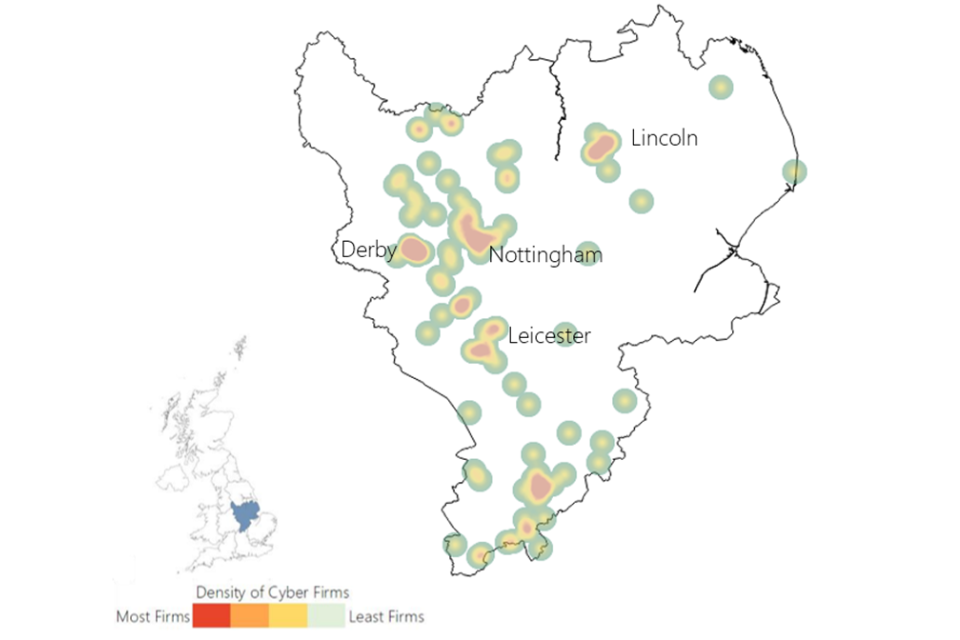
East Midlands
| Percentage of UK Cyber security offices | Estimated percentage of UK based cyber security employment | Mean Advertised Salaries (2023) in core cyber security roles |
|---|---|---|
| 4% | 3% | £52,000 |
East of England
East of England
| Percentage of UK Cyber security offices | Estimated percentage of UK based cyber security employment | Mean Advertised Salaries (2023) in core cyber security roles |
|---|---|---|
| 6% | 5% | £53,700 |
Greater London
Greater London
| Percentage of UK Cyber security offices | Estimated percentage of UK based cyber security employment | Mean Advertised Salaries (2023) in core cyber security roles |
|---|---|---|
| 33% | 29% | £67,800 |
North East
North East
| Percentage of UK Cyber security offices | Estimated percentage of UK based cyber security employment | Mean Advertised Salaries (2023) in core cyber security roles |
|---|---|---|
| 3% | 2% | £49,500 |
North West
North West
| Percentage of UK Cyber security offices | Estimated percentage of UK based cyber security employment | Mean Advertised Salaries (2023) in core cyber security roles |
|---|---|---|
| 8% | 10% | £56,000 |
South East
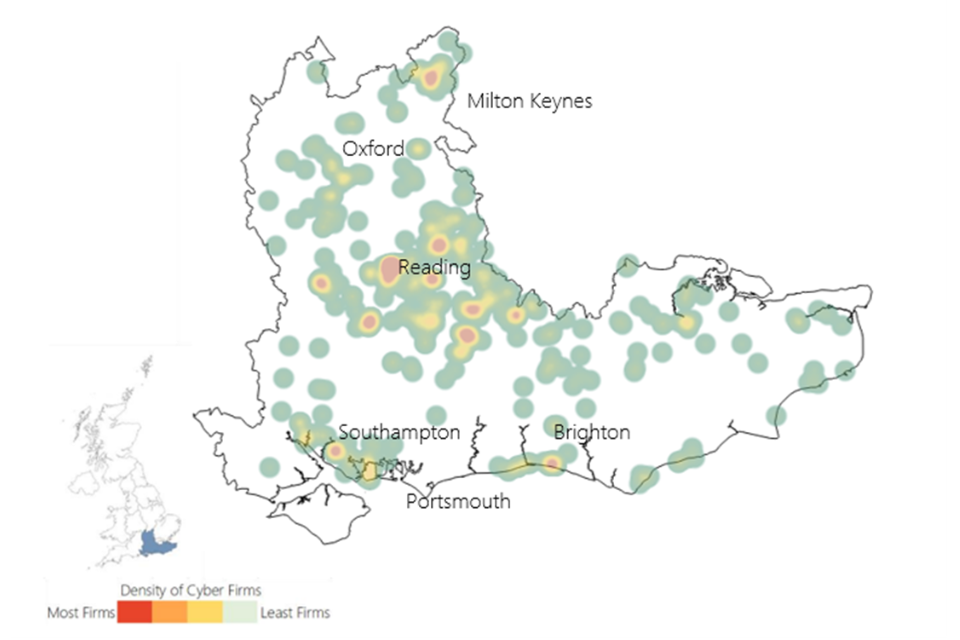
South East
| Percentage of UK Cyber security offices | Estimated percentage of UK based cyber security employment | Mean Advertised Salaries (2023) in core cyber security roles |
|---|---|---|
| 17% | 13% | £55,700 |
South West
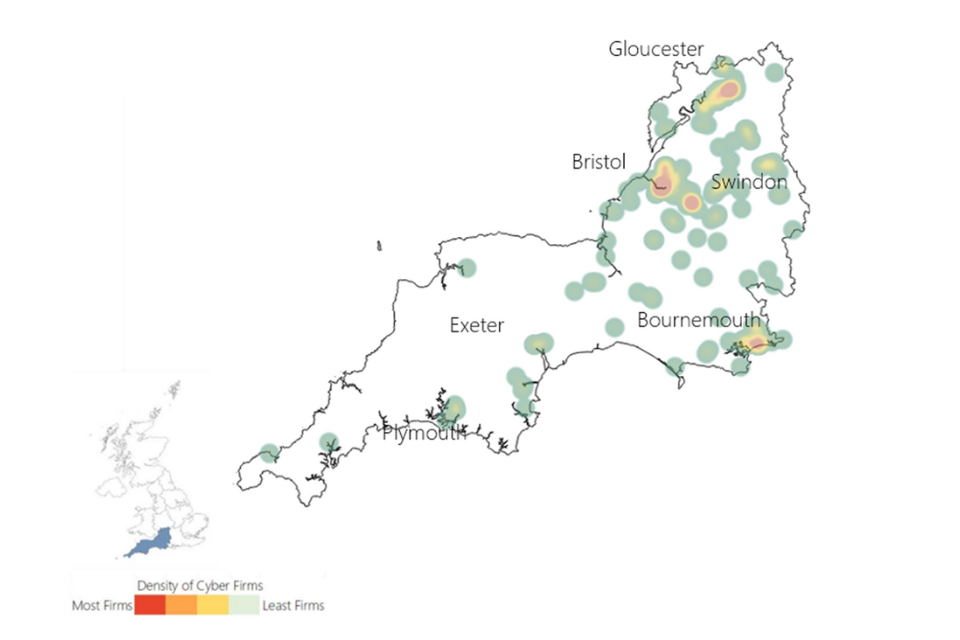
South West
| Percentage of UK Cyber security offices | Estimated percentage of UK based cyber security employment | Mean Advertised Salaries (2023) in core cyber security roles |
|---|---|---|
| 8% | 9% | £55,500 |
West Midlands
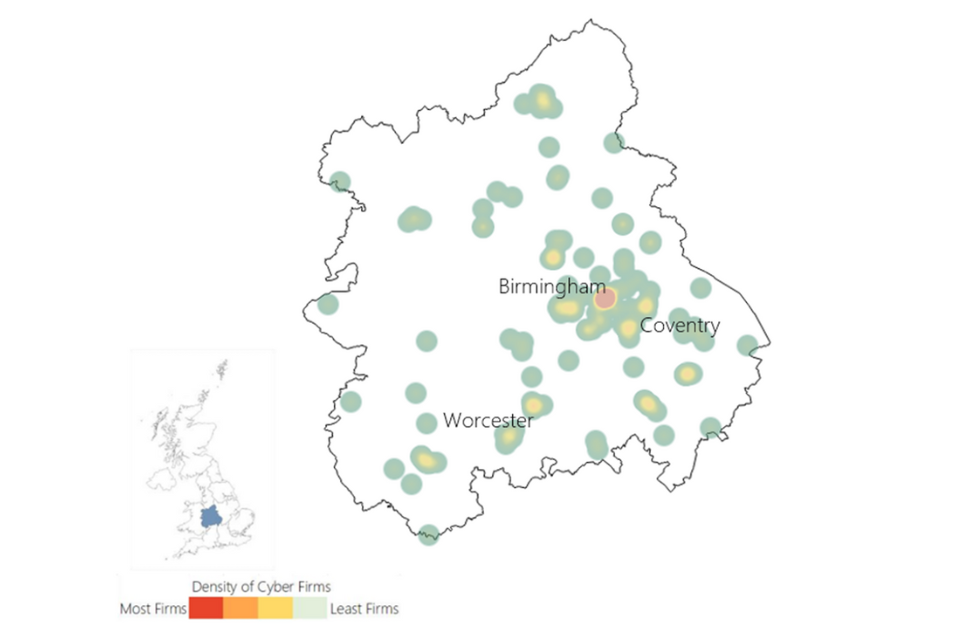
West Midlands
| Percentage of UK Cyber security offices | Estimated percentage of UK based cyber security employment | Mean Advertised Salaries (2023) in core cyber security roles |
|---|---|---|
| 5% | 7% | £55,500 |
Yorkshire and the Humber
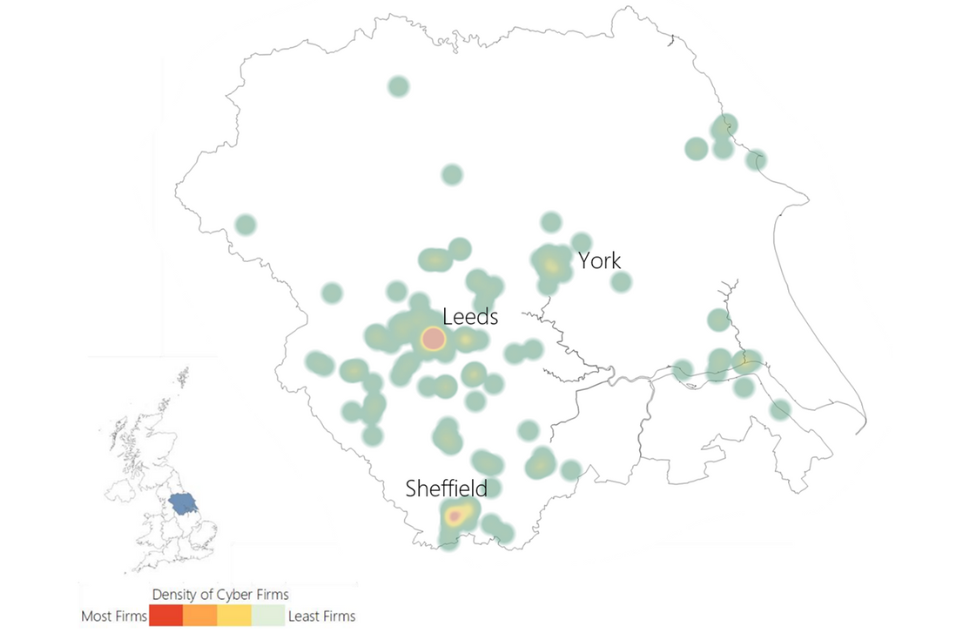
Yorkshire and the Humber
| Percentage of UK Cyber security offices | Estimated percentage of UK based cyber security employment | Mean Advertised Salaries (2023) in core cyber security roles |
|---|---|---|
| 4% | 7% | £53,500 |
Northern Ireland
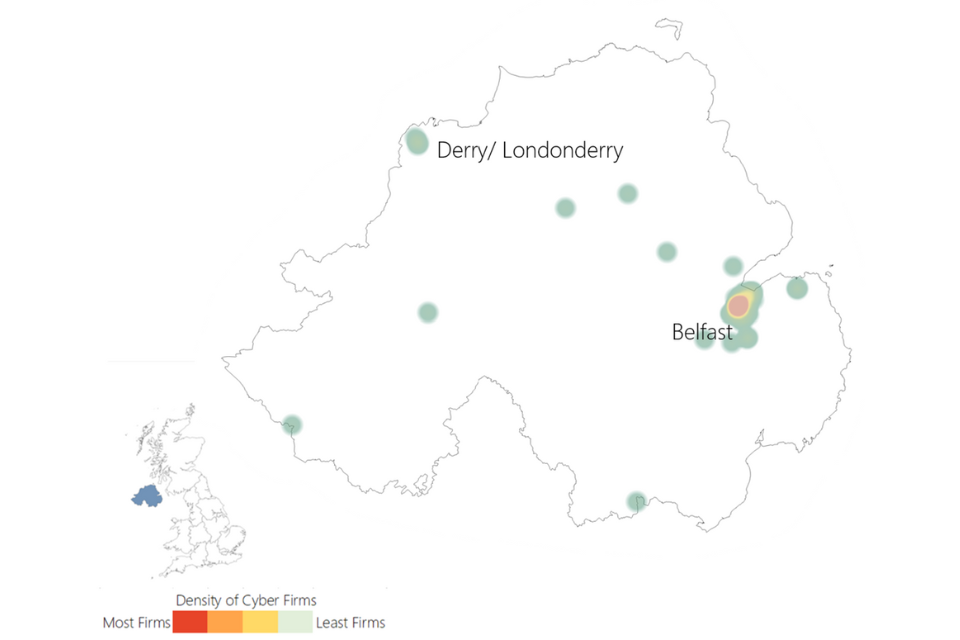
Northern Ireland
| Percentage of UK Cyber security offices | Estimated percentage of UK based cyber security employment | Mean Advertised Salaries (2023) in core cyber security roles |
|---|---|---|
| 2% | 4% | £53,900 |
Scotland
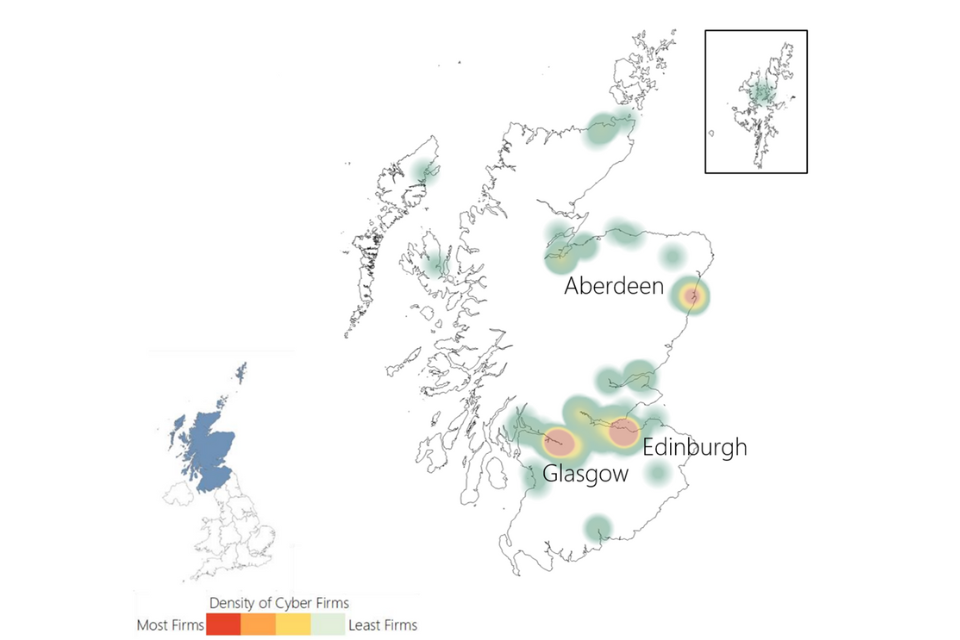
Scotland
| Percentage of UK Cyber security offices | Estimated percentage of UK based cyber security employment | Mean Advertised Salaries (2023) in core cyber security roles |
|---|---|---|
| 7% | 7% | £56,400 |
Wales
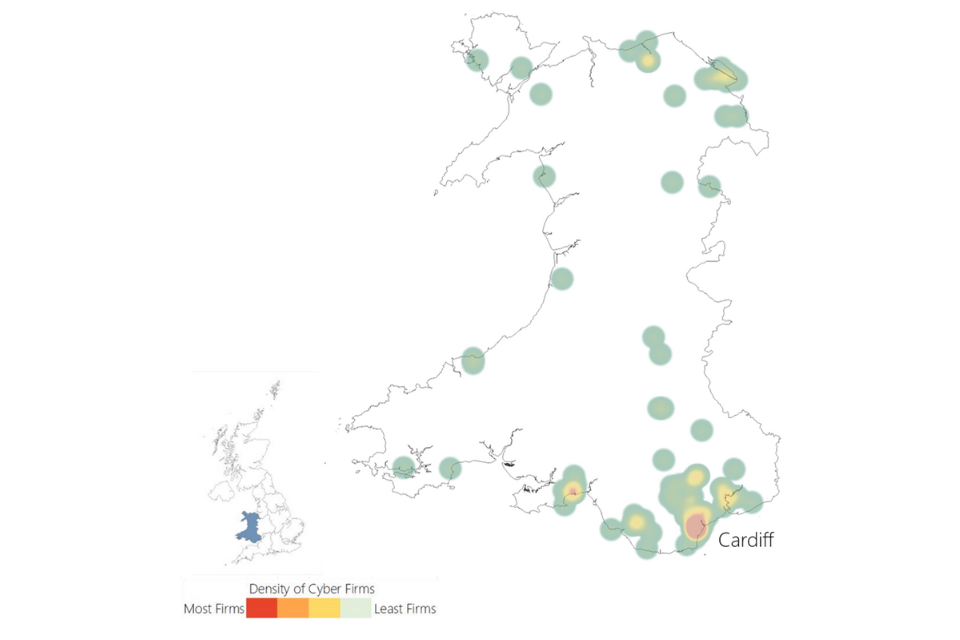
Wales
| Percentage of UK Cyber security offices | Estimated percentage of UK based cyber security employment | Mean Advertised Salaries (2023) in core cyber security roles |
|---|---|---|
| 3% | 4% | £50,800 |
Our standards and accreditations
Ipsos’ standards and accreditations provide our clients with the peace of mind that they can always depend on us to deliver reliable, sustainable findings. Our focus on quality and continuous improvement means we have embedded a “right first time” approach throughout our organisation.
ISO 20252
This is the international specific standard for market, opinion, and social research, including insights and data analytics. Ipsos in the UK was the first company in the world to gain this accreditation.
Market Research Society (MRS) Company Partnership
By being an MRS Company Partner, Ipsos UK endorse and support the core MRS brand values of professionalism, research excellence and business effectiveness, and commit to comply with the MRS Code of Conduct throughout the organisation & we were the first company to sign our organisation up to the requirements & self-regulation of the MRS Code; more than 350 companies have followed our lead.
ISO 9001
International general company standard with a focus on continual improvement through quality management systems. In 1994 we became one of the early adopters of the ISO 9001 business standard.
ISO 27001
International standard for information security designed to ensure the selection of adequate and proportionate security controls. Ipsos UK was the first research company in the UK to be awarded this in August 2008.
The UK General Data Protection Regulation (UK GDPR) and the UK Data Protection Act 2018 (DPA)
Ipsos UK is required to comply with the UK General Data Protection Regulation and the UK Data Protection Act; it covers the processing of personal data and the protection of privacy.
HMG Cyber Essentials
A government backed and key deliverable of the UK’s National Cyber Security Programme. Ipsos UK was assessment validated for certification in 2016. Cyber Essentials defines a set of controls which, when properly implemented, provide organisations with basic protection from the most prevalent forms of threat coming from the internet.
Fair Data
Ipsos UK is signed up as a ‘Fair Data’ Company by agreeing to adhere to twelve core principles. The principles support and complement other standards such as ISOs, and the requirements of Data Protection legislation.
-
Revenue analysis was undertaken in late 2023, with financial year 2022/23 as the modal year for company accounts where available. ↩
-
However, please note that this is nominal growth, and may reflect inflationary factors in 2022/23. Inflation peaked in October 2022 at 11.1%. ↩
-
Gross Value Added (GVA) is a measure of the increase in the value of the economy due to the production of goods and services. In this study, this captures the estimated direct contribution of the cyber security sector to the UK economy. ↩
-
All firms identified using glass.ai were also subject to human review by the Perspective Economics analyst team for final inclusion in the cyber security sectoral dataset. ↩
-
Full size definitions: Large: Employees >=250 and Turnover > €50 million or Balance sheet total > €43 million // Medium: Employees >50 and < 250 And Turnover <= €50 million or Balance sheet total <= €43 million // Small: Employees >10 and < 50 And Turnover <= €10 million or Balance sheet total <= €43 million // Micro Employees < 10 And Turnover <= €2 million or Balance sheet total <= €2 million ↩
-
Based on 95% confidence intervals. ↩
-
FinTech refers to financial technology used to help deliver financial products and services to users. RegTech refers to ‘regulatory technology’ used to enhance and assist organisations with regulatory and compliance processes. ↩
-
Safety tech providers deliver products and services that enable safer online experiences for citizens. DSIT sector research is available at: https://www.gov.uk/government/publications/safer-technology-safer-users-the-uk-as-a-world-leader-in-safety-tech ↩
-
Full size definitions: Large: Employees >=250 and Turnover > €50 million or Balance sheet total > €43 million // Medium: Employees >50 and < 250 And Turnover <= €50 million or Balance sheet total <= €43 million // Small: Employees >10 and < 50 And Turnover <= €10 million or Balance sheet total <= €43 million // Micro: Employees < 10 And Turnover <= €2 million or Balance sheet total <= €2 million ↩
-
UK Business Population Estimates (2022): Available at: https://www.gov.uk/government/statistics/business-population-estimates-2022 ↩
-
Figures may not sum due to rounding ↩
-
Number of firms dissolved, in administration, or liquidation (82 / 1,979) = 4.1% ↩
-
The keywords underpinning Awareness, Training and Education have been broadened to include firms offering awareness or training courses without formal accreditation (e.g., online modules in cyber security awareness). ↩
-
Note only a small number of resellers are included – whereby they also appear to offer other services aligned to the agreed cyber security taxonomy e.g., advisory support with implementation of cyber security products or services. We do not include, for example, high street or online retailers. ↩
-
For a full explanation of TTWAs, see the ONS website. TTWAs are a ‘self-contained labour market in which all commuting occurs within the boundary of that area. At least 75% of the area’s resident workforce work in the area, and at least 75% of the people who work in the area also live in th area. There is a total of 228 TTWAs. The Isle of Man and the Channel Islands are not TTWAs so are not included. Our Location Quotient calculations are based on 2016 Annual Population Survey (APS) data, and the TTWA calculations are based on the April 2011 TTWAs. ↩
-
As marked by international presence with a known office / location. Many firms will trade globally without a physical office presence. This is explored further in Section 6.4. ↩
-
£10,462 million (2023 study) to £11,859m (2024 study) = Compound Annual Growth Rate (CAGR) of 13%. ↩
-
Note: Smaller values include Product, Micro £67 million, MSP, Micro £28 million, Small £114 million, Reseller, Medium £25 million ↩
-
The research team also models regional estimates of cyber security employment and labour force estimates within the 2024 Cyber Security Skills in the UK research with Ipsos. Within this, vacancy data and estimated workforce data is used to estimate regional estimates of cyber workforce size (as a proportion of the UK). ↩
-
The Beauhurst platform tracks investments in these companies from 2006– 2023. ↩
-
https://www.beauhurst.com/research/equity-investment-market-update-h1-2023/ ↩
-
Please note that this analysis is undertaken in January 2024 (to capture full 2023 data). However, there is a caveat that Q4 data may be effectively “partial”, as this will be complete for publicly announced deals, but there is a lag for unannounced deals (i.e., deals that are made, but not announced publicly but are identified through filings with Companies House. SH01s (allotment of shares forms) are required to be submitted within one month of the transaction occurring, though it can sometimes take companies longer to file these). ↩