Gender pay gap report 1 April 2023 to 31 March 2024
Published 28 March 2025

© Crown copyright 2025
This publication is licensed under the terms of the Open Government Licence v3.0 except where otherwise stated. To view this licence, visit nationalarchives.gov.uk/doc/open-government-licence/version/3 or write to the Information Policy Team, The National Archives, Kew, London TW9 4DU, or email: psi@nationalarchives.gov.uk.
Where we have identified any third party copyright information you will need to obtain permission from the copyright holders concerned.
This publication is available at https://www.gov.uk/government/publications/gender-pay-gap-report-2023-to-2024/gender-pay-gap-report-1-april-2023-to-31-march-2024
Executive summary
The Competition and Markets Authority (CMA) has prepared this report as part of their legal requirement for public sector authorities to publish their gender pay gap (GPG) on an annual basis.
Since 2023, there have been the following changes in the CMA’s GPG:
- the mean ordinary GPG has reduced from 6.8% to 4.9%
- the median ordinary GPG has reduced from 5.9% to 4.1%
- the mean bonus GPG has increased from 5.6% to 6.4%
- the median bonus GPG has remained unchanged at 0.0%
Although there is still work to be done, the CMA continues to compare favourably across the Civil Service, where the overall ordinary mean GPG for 2023 to 2024 is 7.4%. The CMA is also significantly below the average Civil Service mean bonus GPG of 25.7% and median bonus GPG of 22.4%.
Ordinary GPG
The mean reduced by 1.9 percentage points (ppt) and the median reduced by 1.8ppt. The main driver for the reductions this year is increased representation of women particularly at senior grades, where the proportion of female Senior Civil Servants (SCS) increased from 41.5% in 2022 to 2023 to 47.5% in 2023 to 2024. In our lower grades for example, AO to grade 6, we now have 50.4% of female staff. Overall, we have equal representation of males (50%) and females (50%).
Bonus GPG
The mean increased by 0.8 ppt and the median remained unchanged. Recognising that a flat organisational award was paid to all eligible AO to Grade 6 staff, the greatest contributor to the mean increase is likely to be the bonus arrangements for SCS, whereby we follow the central SCS pay practitioner guidance.
Targeted action
We have continued to deliver against our Equality, Diversity and Inclusion Strategy 2020 to 2024 and this report outlines actions we have taken in this reporting period to reduce the GPG. Our work is aligned with continuing to improve our representation of women at a senior level and using our data to inform our actions.
Introduction
In 2017, the Government introduced legislation that made it statutory for organisations with 250 or more employees to report annually on their gender pay gap. Government departments are covered by the Equality Act 2010 (Specific Duties and Public Authorities) Regulations 2017, which underpin the Public Sector Equality Duty and require relevant organisations to publish their gender pay gap annually by 30 March.
This includes:
- the mean and median ordinary gender pay gaps
- the mean and median gender bonus gaps
- the proportion of men and women who received bonuses
- the proportions of men and women employees in each pay quartile
The gender pay gap shows the difference in the average pay between all men and women in a workforce. If a workforce has a particularly high gender pay gap, this can indicate there may be a number of issues to deal with, and the individual calculations may help to identify what those issues are. Where there is a positive percentage, this means that the average pay of male staff is higher than the average pay of female staff. The higher the percentage, the greater the gender pay gap.
The gender pay gap is different to equal pay. Equal pay deals with the pay differences between men and women who carry out the same jobs, similar jobs or work of equal value. It is unlawful to pay people unequally because of their gender.
The CMA supports the fair treatment and reward of all staff irrespective of gender.
This report fulfils the CMA’s statutory requirements under gender pay legislation, analyses the figures in more detail, sets out our progress to date and what we are doing to reduce the gender pay gap. The reporting period is 1 April 2023 to 31 March 2024 and the figures provided align to the gender pay gap figures published in the annual Civil Service statistics on 31 July 2024.
Organisational context
The CMA is an independent non-ministerial UK Government department and is the UK’s principal competition and consumer protection authority. We help people, businesses and the UK economy by promoting competitive markets and tackling unfair behaviour.
Our Equality, Diversity and Inclusion Strategy 2020 to 2024 describes how equality, diversity and inclusion are essential to the way that we operate, both as the UK’s competition authority and as an employer. To deliver our strategy, we have developed a series of action plans. Our final action plan (2022 to 2024) is focussed on 5 key themes:
- recruitment and ‘growing our own’
- career progression and development
- improving senior representation
- pay and reward
- promoting a culture of inclusivity
We have published reviews of our progress against our strategy, objectives and action plans in April 2021, September 2022 and October 2024.
The highlights of what has been delivered through this action plan and how it has supported reducing our pay gaps can be found in the action planning section of this report.
Organisational structure
The number of people (FTE) employed by the CMA at 31 March 2024 was 1,087.7.
For the purpose of the gender pay report though, and as defined by Regulation 2(1) of the Equality Act 2019 (Specific Duties and Public Authorities) Regulations 2017 and the government’s guidance for calculating the gender pay gaps, in this year’s report:
- 1,050 employees have been established to be in scope for calculation to determine the mean and median ordinary pay gaps, meaning in receipt of full pay on 31 March 2024
- 1,084 employees have been established to be in scope for the calculation to determine the gender mean and median bonus gaps, covering the 12-month period between 1 April 2023 and 31 March 2024
Of the 1,050 employees in scope for the ordinary pay gaps, 28 staff were based in Belfast, 26 in Cardiff, 16 in Darlington, 94 in Edinburgh, 837 in London and 49 in Manchester. Of note, the CMA increased its headcount by 303, 289 in grades AO to G6 and 14 in SCS grades as it expanded to take on new responsibilities and powers, particularly in Digital Markets.
The breakdown of grades at 31 March 2024, and percentage of men and women are shown in the following table.
Figure 1: Male or Female profile at each grade
| Civil Service grade | Total staff | Male | Female |
|---|---|---|---|
| AO | 34 | 50.0% | 50.0% |
| EO | 74 | 37.8% | 62.2% |
| HEO | 189 | 46.6% | 53.4% |
| SEO | 97 | 55.7% | 44.3% |
| Grade 7 | 283 | 49.4% | 50.5% |
| Grade 6 | 234 | 53.4% | 46.6% |
| SCS PB1 | 112 | 53.6% | 46.4% |
| SCS PB2 and PB3 | 27 | 48.2% | 51.9% |
| All staff | 1050 | 50.0% | 50.0% |
Overall, the breakdown of men and women is 50.0% men and 50.0% women. This is an increase in female representation since 2022 to 2023 when 48.8% of staff were female, which results from more males leaving than females and more females joining than males between 1 April 2023 and 31 March 2024, as outlined in the tables below.
Figure 2: Joiners profile between 1 April and 31 March 2024
| Civil Service grade | Total staff | Male | Female |
|---|---|---|---|
| AO | 25 | 12 | 13 |
| EO | 33 | 13 | 20 |
| HEO | 83 | 41 | 42 |
| SEO | 52 | 29 | 23 |
| Grade 7 | 62 | 27 | 35 |
| Grade 6 | 34 | 18 | 16 |
| SCS PB1 | 11 | 5 | 6 |
Figure 3: Leavers Profile between 1 April and 31 March 2024
| Civil Service grade | Total staff | Male | Female |
|---|---|---|---|
| AO | 18 | 10 | 8 |
| EO | 10 | 5 | 5 |
| HEO | 24 | 12 | 12 |
| SEO | 11 | 4 | 7 |
| Grade 7 | 38 | 20 | 18 |
| Grade 6 | 18 | 9 | 9 |
| SCS PB1 | 7 | 4 | 3 |
| SCS PB2 and PB3 | 4 | 4 | 0 |
| Total leavers | 130 | 68 | 62 |
Gender pay gap report
In accordance with the current requirements for reporting on the gender pay gap and the gender classifications provided by His Majesty’s Revenue and Customs (HMRC), our approach involves categorising gender into male and female within our data
In the context of this report, we have employed the terms ‘gender’, ‘male,’ and ‘female,’ understanding that they typically relate to biological sex. However, it’s important to acknowledge that for some individuals, these terms may not fully encapsulate their gender identity.
In addition, it should be noted that the following gender pay gap statistics have not included the additional non-consolidated one-off payments made to civil servants in 2023 of £1,500. The payments were not considered to fall within the scope of pay for the purpose of calculations and in any event were made outside the relevant pay period of March 2024 for the main pay gap statistics and are therefore excluded from those calculations. The payment has also been excluded from the bonus pay gap statistics as the payment was not by way of a bonus for these purposes and to treat it as such would serve to mask the true underlying bonus pay gap figures for 2023 to 2024.
Ordinary pay
Ordinary pay, expressed as hourly pay, is used to calculate the mean and median gender pay gaps. Ordinary pay includes basic pay, any allowances and any bonus payments made in March 2024. Salary sacrifice amounts are deducted from this value.
The calculation for the mean and median ordinary pay only includes ‘full pay relevant’ employees, as described in section 1.
The gender pay gap calculations are based on the number of individual employees, and not on full-time equivalents. This means that each part-time employee counts as one employee.
The following table shows the 2023 to 2024 mean gender pay gap (which is the difference between the average hourly pay between men and women) and median gender pay gap (which is the difference between the median hourly pay of men and women) in the CMA.
Figure 4: Mean and median ordinary GPG for the last 3 reporting periods
| Measure | 2023 to 2024 | 2022 to 2023 | 2021 to 2022 |
|---|---|---|---|
| Mean pay gap | 4.90% | 6.8% | 8.9% |
| Median pay gap | 4.10% | 5.9% | 6.3% |
Although there is still work to be done, the CMA continues to compare favourably across the Civil Service, where the median gender pay gap was 8.5% and the mean gender pay gap was 7.4% in 2023 to 2024.
Bonus pay
Bonus pay, which is also calculated as mean and median, is based on bonus payments paid to staff throughout the 2023 to 2024 financial year.
This calculation may include employees who are not ‘full pay relevant’ employees but will not include employees who left the CMA before 31 March 2024.
At the CMA, usually bonus pay includes any performance related pay (PRP). These are payments based on performance management outcomes for the previous financial year. In the case of staff in grades AO to Grade 6, these payments are negotiated annually with our recognised trade unions.
For the 2023 to 2024 pay award year, there continues to be no link between performance and pay. This means that there will be no performance – related payments based on performance ratings for the 2023 to 2024 performance year.
Instead, in recognition of the continuing high performance across the CMA in that period, we paid a flat non – consolidated payment of £1,125 to all eligible staff in the January 2024 payroll. This award was included in the bonus payments made during the 2023 to 2024 financial year and is therefore included in the bonus gap calculations.
For SCS staff, there are separate arrangements which are centrally set by government each year. SCS Bonus is included in the bonus calculations and is the biggest contributor to the increase in bonus gap.
The following table shows the 2023 to 2024 mean bonus gap (which is the difference between the average bonus pay between men and women) and the median bonus gap (which is the difference between the median of the bonus pay of men and women) in the CMA.
Figure 5: Mean and median Bonus GPG for the last 3 reporting periods
| Measure | 2023 to 2024 | 2022 to 2023 | 2021 to 2022 |
|---|---|---|---|
| Mean bonus gap | 6.4% | 5.6% | 26.6% |
| Median bonus gap | 0.0% | 0.0% | 0.0% |
Whilst, consideration needs to be given to the mean bonus gap, it is note-worthy that it still remains significantly below the average Civil Service mean bonus GPG of 25.7% and median bonus GPG of 22.4%.
Percentage of males and females receiving a bonus in 2024
In the 2023 to 2024 financial year, 69.3% of male staff received a bonus payment compared with 76.3 % in 2022 to 2023. 69.8% percentage of female staff received a bonus compared to 78.1% in 2022 to 2023. These changes reflect the overall decrease in the proportion of staff who received a bonus in 2023 to 2024 to 69.6% from 77.2% in 2022 to 2023.
Pay quartiles
The pay quartiles show the proportion of male and female staff across each of the quartiles. They are calculated through ranking all salaries from the highest to the lowest paid, in terms of hourly pay and dividing the list into quarters.
Figure 6: Distribution of males and females across the pay quartiles
| Pay quartiles | Male | Female |
|---|---|---|
| Lower quartile | 46.4% | 53.6% |
| Lower middle quartile | 48.1% | 51.9% |
| Upper middle quartile | 51.7% | 48.3% |
| Upper quartile | 53.8% | 46.2% |
| All | 50% | 50% |
The pay quartile distribution shows that the proportion of female staff in the lower and middle quartiles is higher than male staff, as women generally make up a higher proportion of our junior grades, particularly at the EO grade.
The proportion of female staff in the upper middle and upper quartiles are lower than male staff, as males make up a higher proportion of our senior grades, particularly at grade 6 and SCS level.
Overall, the breakdown of men and women is 50.0% men and 50.0% women.
Ordinary GPG analysis
In 2023 to 2024 we reduced our pay gap by 1.9ppt and the median pay gap has reduced by 1.8ppt, continuing the decline over recent years as outlined below.
Figure 7: Mean and median ordinary GPG for the last 3 reporting periods
| Measure | 2023 to 2024 | 2022 to 2023 | 2021 to 2022 |
|---|---|---|---|
| Mean pay gap | 4.90% | 6.8% | 8.9% |
| Median pay gap | 4.10% | 5.9% | 6.3% |
The primary reason likely to have contributed to the ordinary pay gaps decreasing, is the increase of the proportion of females in higher grades and balancing the representation of males and females across junior grades, to achieve gender parity.
Figure 8: Chart to show parity (50:50) across grades
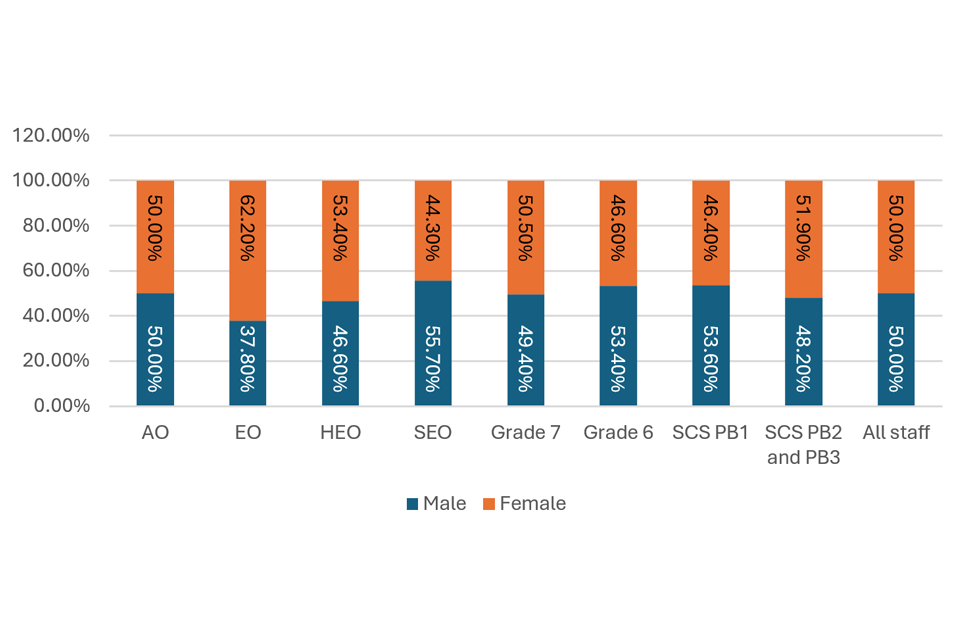
The chart shows that overall we have parity (50:50) of males and females in the organisation.
- we have parity at AO grade, but we have more males than females at SEO (55.7%) Grade 6 (53.4%) SCS PB1 (53.6%)
- we have more females than males in EO (62.2%) HEO (53.4%) Grade 7 (50.5%) and SCS PB2 and PB3 (51.9%)
This was through increasing the number of new joiners that were women; where 51.8% overall were women, and at SCS level, this was 57.1%.
Men accounted for 52.3% of all leavers, and at SCS level this was 72.7%. As a result, this combination of leavers particularly impacted the SCS level, whereby the proportion increased to 47.5% in 2023 to 2024 compared to 42.5% in 2022 to 2023 resulting in average pay for female employees increasing.
Whilst the increase in the percentage of women in SCS positions in the CMA is particularly positive, it is recognised that it is still slightly below the percentage of women in SCS positions across the wider civil service of 48.2%.
In addition, whilst it is also positive that we have reduced our gap, we acknowledge that there still is a gap, for which we consider there to be 2 main factors.
- Digital, Data and Technology (DDAT) allowances
- more men than women in Grades 6 to 7 and SCS PB1
DDAT allowances
Digital, Data and Technology allowances were introduced in the 2020 to 2021 financial year. These allowances are paid to eligible DDaT roles – defined by the Government Digital Service (GDS) who centrally own the framework. In 2023 to 2024, of those staff who received allowances 76.7% were men. This is an increase since 2023 to 2024, where it was 70.6%. 62% of the roles were at grade 7 or grade 6.
Grade 6 to 7 and SCSPB1
We have more men than women working at grades 6 to 7 and SCS PB1, which contributes to higher average pay.
Ordinary pay gaps by grade
Looking at the mean and median gender pay gaps by grade, the differences are considerably smaller than the overall figures for the CMA in 2023 to 2024 as shown below in Figure 4 below.
Figure 9: Mean and median ordinary GPG by grade
| Civil Service grade | 2023 to 2024 mean pay gap | 2022 to 2023 mean pay gap | 2023 to 2024 median pay gap | 2022 to 2023 median pay gap |
|---|---|---|---|---|
| AO | 0.31% | 0.7% | 0.00% | 2.5% |
| EO | 0.92% | 0.7% | 1.68% | 4.5% |
| HEO | -1.38% | -0.5% | 0.00% | -0.9% |
| SEO | 1.57% | 0.5% | 0.00% | 0.5% |
| Grade 7 | 1.73% | 0.4% | 2.28% | 1.7% |
| Grade 6 | 1.23% | 0.9% | 0.61% | 0.2% |
| SCS PB1 | 1.61% | -0.8% | 0.00% | 0.3% |
| SCS PB2 and PB3 | 1.91% | 2.9% | -0.44% | 1.9% |
| All staff | 4.9% | 6.8% | 4.10% | 5.9% |
Our median pay gaps have reduced across all grades except Grade 7s and Grade 6s but the mean pay gaps have seen more variation with reductions for AO, SCS PB2 and PB3 grades but small increases across other grades.
The primary reason for the variation across grades is the impact of new starters joining the organisation.
Starting salaries for new joiners are limited at the grade minimum up to the grade midpoint, which can have an effect of limiting pay differences between existing and new staff. However it also has the potential to negatively impact our pay gaps.
Whilst more women than men joined in grades EO, Grade 7, SCS PB1, 2 or 3, the pay differential between new starters and existing staff has caused the slight increases across grades EO, HEO, SEO, Grade 7. Grade 6 and SCS PB1.
Bonus GPG analysis
In 2023 to 2024, we have seen an increase in the mean bonus gap of 0.8ppt and the median bonus gap has remained at 0%, which has been the position over the last 3 years as outlined below.
Figure 10: Mean and median Bonus GPG for the last 3 reporting periods
| Measure | 2023 to 2024 | 2022 to 2023 | 2021 to 2022 |
|---|---|---|---|
| Mean bonus gap | 6.4% | 5.6% | 26.6% |
| Median bonus gap | 0.0% | 0.0% | 0.0% |
At the CMA, usually bonus pay includes any performance related pay (PRP). These are payments based on performance management outcomes for the previous financial year.
For performance year 2023 to 2024, it was agreed that there would not be a link between performance ratings and non-consolidated payments. A flat rate organisational award was paid instead, with colleagues joining in the last quarter of the performance year receiving a quarter payment.
For SCS staff, there are separate arrangements which are centrally set by government each year. 48.6% of SCS colleagues received bonus based on their individual performance. 49.3% were women and 48.6% were men. Whilst there has been an increase in the representation of women at SCS level, women received a slightly lower average bonus due to their time in role, and therefore lower average bonuses would contribute to the bonus gap.
Bonus gaps by grade
We have reduced the Bonus GPG across all grades, apart from at SCS PB1, where we have seen a small increase. This small increase has contributed to the overall increase of the mean bonus GPG from 5.6% in 2022 to 2023 to 6.4% in 2023 to 2024.
Figure 11: Mean and median bonus GPG by grade
| Civil Service grade | 2023 to 2024 mean bonus gap | 2022 to 2023 mean bonus gap | 2023 to 2024 median bonus gap | 2022 to 2023 median bonus gap |
|---|---|---|---|---|
| AO | 2.86% | -68.0% | 0.00% | -600.0%* |
| EO | 1.79% | 8.3% | 0.00% | 12.2% |
| HEO | 1.91% | -12.9% | 0.00% | 5.3% |
| SEO | 1.08% | -1.7% | 0.00% | 2.7% |
| Grade 7 | 0.02% | -4.9% | 0.00% | -10.5% |
| Grade 6 | 1.71% | 1.9% | 0.00% | 9.5% |
| SCS PB1 | 12.60% | 10.4% | 5.00% | 15.0% |
| SCS PB2 and PB3 | -0.31% | -19.5% | -5.26% | -19.8% |
| All staff | 6.4% | 5.6% | 0.0% | 0.0% |
Targeted action to reduce the gender pay gap
To deliver the final 2 years of our Equality, Diversity and Inclusion Strategy 2020 to 2024, we launched a detailed action plan, following engagement with internal stakeholders. The initiatives in the plan were intended to make a wide-reaching impact on equality, diversity and inclusion at the CMA, including having an impact on our pay gaps.
Our Equality, Diversity and Inclusion Action Plan 2022 to 2024 focussed on:
- recruitment and ‘growing our own’
- career progression and development
- improving senior representation
- pay and reward
- promoting a culture of inclusivity
Details of the full plan and the work that was delivered in 2023 to 2024 can be found in our 2023 to 2024 annual report.
Improving representation and leadership accountability
To continue to reduce our pay gaps we are seeking to improve our representation at a senior level and balance gender across other grades. Our work is therefore aligned with continuing to improve our representation of women at a senior level, using our data to inform our actions, and reviewing our approach to pay and performance.
Using our data to inform our actions
In support of our representation ambitions, we have agreed a holistic set of measures, incorporating Diversity Representation, Inclusion and Equity. This set of measures will help us evidence where we are making progress on inclusion, representation and closing our pay gaps.
We already measure the diversity in the CMA, but in addition to this, we have created a recruitment dashboard, which enables us to see the diversity of our talent pipeline. It also enables us to make more proactive decisions on how we improve the proportion of females that are applying and being recruited for roles in the CMA.
We have also introduced diverse interview panels, which includes a gender mixed panel. This ensures that different perspectives are taken into account, and candidates are able to visibly see representation, particularly women at a senior level.
Our future plans
We will next report on GPG by March 2026, for the period of 1 April 2024 to 31 March 2025, and in that period, we will focus on delivering the following actions as we complete the work on our existing EDI strategy and action plans.
Committing to being a diverse and inclusive organisation
We will communicate to the organisation our ambitions for diversity representation, across women, ethnic minorities, black, disability and our Lesbian, Gay, Bisexual, Other (LGBO) community, for grades AO to G6 and SCS. The ambitions have been centrally set using the UK Census (2021) and we will track progress quarterly.
Reviewing our end-to-end recruitment process
It is important to us that we ensure our recruitment process is inclusive and therefore we will commission an external review of all our recruitment processes.
Retaining our staff
This is critical in maintaining our representation, and continuing to reduce our pay gaps, therefore we will continue to deliver our existing development programmes as well as review where we have any gaps to enable us to achieve our ambitions, and to improve representation, particularly in SCS roles.
EDI priorities 2025 to 2026
Our existing EDI strategy and plans expire at the end of March 2025, and therefore we will be starting work to refresh our objectives and priorities.
Declaration
We confirm that data reported by the CMA is accurate and has been calculated according to the requirements and methodology set out in the Equality Act 2010 (Specific Duties and Public Authorities) Regulations 2017.