Ofqual gender pay gap report 2024
Updated 27 March 2025
Applies to England
Executive summary
Ofqual’s Gender Pay Gap (GPG) report is a high-level view and analysis of pay within the organisation and shows the difference in the average pay between all men and all women in the workforce.
-
The Annual Civil Service Employment Survey (ACSES) data, which was published in July 2024 by the Cabinet Office, calculated Ofqual’s gender pay gap figures, and the methodology used annual salaries as of 31 March 2024 to calculate hourly pay.
-
The mean pay gap figure for 2024 is 18.1%, which is a 7.5% increase on the previous year.
-
The median pay gap figure is 17.3%, which is a 3.2% increase on the previous year.
-
While women are represented across all quartiles, 78.4% of the lower paid quartile are women, which is a 5.5% increase on the previous year. In contrast 49.4% of those in the upper quartile are women which is a decrease of 2.98%. Both the increase at the lower end of the quartiles and the decrease at the upper end have contributed to the overall gender pay gap increase for 2024.
-
The mean bonus gap figure for 2024 is 4.2%, which is a 2.3% decrease on the previous year. The median bonus gap is 0.0%, which is an 8.3% decrease from the previous year.
Introduction
Organisational context
Ofqual is a non-ministerial department which regulates qualifications, examinations, and assessments in England.
Parliament created Ofqual to:
- secure standards in qualifications so they give a reliable and consistent indication of knowledge, skills and understanding
- promote the development and implementation of national assessments that give a reliable and consistent indication of achievement
- promote public confidence in qualifications and national assessments
- promote public awareness and understanding of the range and benefits of regulated qualifications
- secure that qualifications are provided efficiently and represent value for money
Ofqual first exceeded the 250-employee threshold for reporting in 2021. The headcount of Ofqual’s workforce as of 31 March 2024 was 353. Ofqual remains a relatively small organisation in comparison with other government departments and it is, therefore, important to note that any small changes to the organisational structure with regard to staffing can have a large impact on the gender pay gap reporting statistics, both positively and negatively.
This report provides information on Ofqual’s gender pay gap for the year 2023 to 2024, with data to 31 March 2024 and comparable information for the previous year where relevant.
Approach to diversity and inclusion
Building a diverse and inclusive workforce that reflects the people we serve is one of the Civil Service’s top workforce priorities. Ofqual aims for a diverse workforce at all levels including Senior Civil Service (SCS) posts and has robust monitoring in place at each stage of the recruitment and selection process to aid this and allow us to understand underrepresented groups that should be addressed. Since reporting commenced in 2021, female representation in the organisation has increased from 59.5% to 66.6%.
Organisational structure
This report includes data relating to Ofqual employees only.
Ofqual’s pay grades range from Administrative Officer to Senior Civil Servants. Grades vary according to the level of responsibility that individuals have, and each grade has a set pay range as per the table on page 6. Ofqual’s gender split as of 31 March 2024 was 33.4% male staff and 66.6% female staff. 96.3% of Ofqual’s employees are Midlands based.
The table below shows the breakdown of men and women represented in each grade:
| Grade | Number of men (% of total workforce) | Number of women (% of total workforce) | % of women in each grade |
|---|---|---|---|
| SCS | 14 (4.0%) | 5 (1.4%) | 26.3% |
| G6 | 14 (5.0%) | 22 (6.2%) | 61.1% |
| G7 | 38 (10.8%) | 60 (17.0%) | 61.2% |
| SEO | 24 (6.8%) | 57 (16.1%) | 70.4% |
| HEO | 21 (5.9%) | 66 (18.7%) | 75.9% |
| EO | 3 (0.8%) | 20 (5.7%) | 87.0% |
| AO | 4 (1.1%) | 5 (1.4%) | 55.6% |
Gender pay gap report
The gender pay gap is the difference in the average earnings between all men and women in an organisation.
From April 2017, employers with 250 or more employees must publish information on their gender pay gap. The pay gap must be reported on in 6 different ways:
- the mean gender pay gap
- the median gender pay gap
- the mean gender bonus gap
- the median gender bonus gap
- the proportion of men and women who received bonuses
- the proportion of men and women according to quartile pay bands
The mean gender pay gap is the difference between the mean hourly rate of pay of male full-pay relevant employees and that of female full-pay relevant employees.
The median gender pay gap is the difference between the median hourly rate of pay of male full-pay relevant employees and that of female full-pay relevant employees.
The gender pay gap is different to equal pay. Equal pay deals with the pay differences between men and women who carry out the same jobs, similar jobs, or work of equal value. It is unlawful to pay people unequally because they are a man or a woman.
The existence of a Gender Pay Gap may not equate to the existence of an equal pay problem, but it may be a trigger for further investigation about why the gap exists.
For the purpose of this report, hourly rates have been calculated in line with the Annual Civil Service Employment Survey requirements and regulations as follows:
- a calculation of March pay for each employee
- a calculation of March hours for each employee
- a calculation of the gender pay gap compliant hourly wage
The table summarises the 2024 gender pay and bonus gap between men and women, comparing the mean and median values to those from 2023:
| Difference between men and women | Mean | Mean % change from 2023 | Median (middle) | Median % change from 2023 |
|---|---|---|---|---|
| Gender pay gap | 18.1% | +7.5% | 17.3% | +3.2% |
| Gender bonus gap | 4.2% | -2.3% | 0.0% | -8.3% |
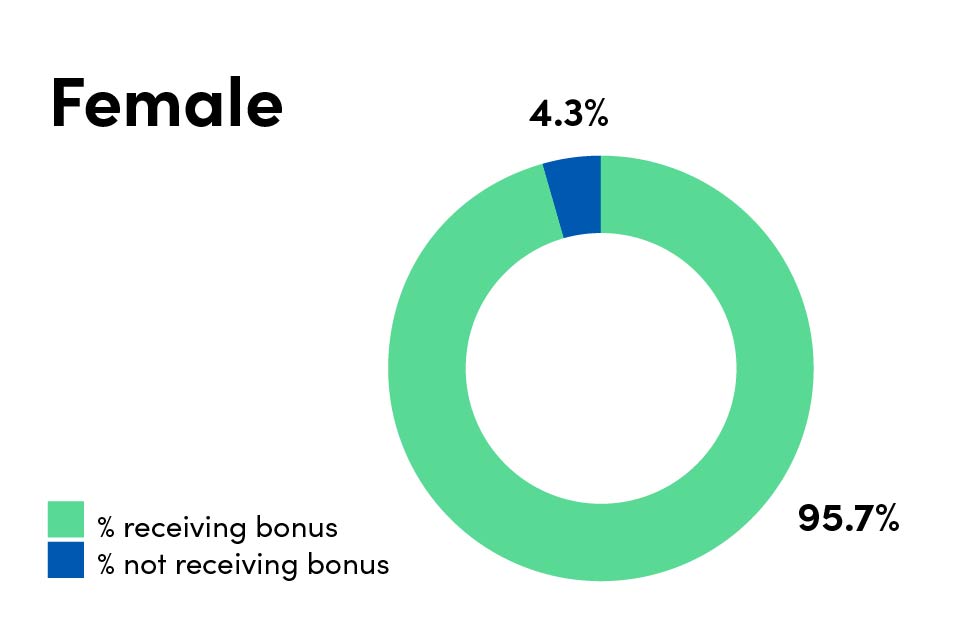
Pie chart showing the percentage of women who received a bonus in 2023 and those who did not. 95.7% of women received a bonus and 4.3% did not.
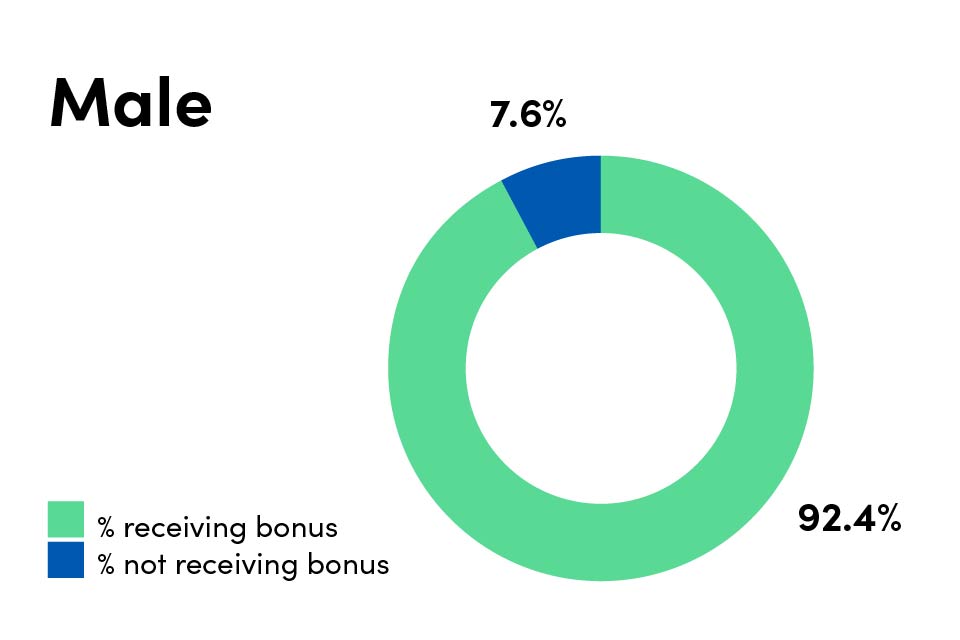
Pie chart showing the percentage of men who received a bonus in 2023 and those who did not. 92.4% of men received a bonus and 7.6% did not.
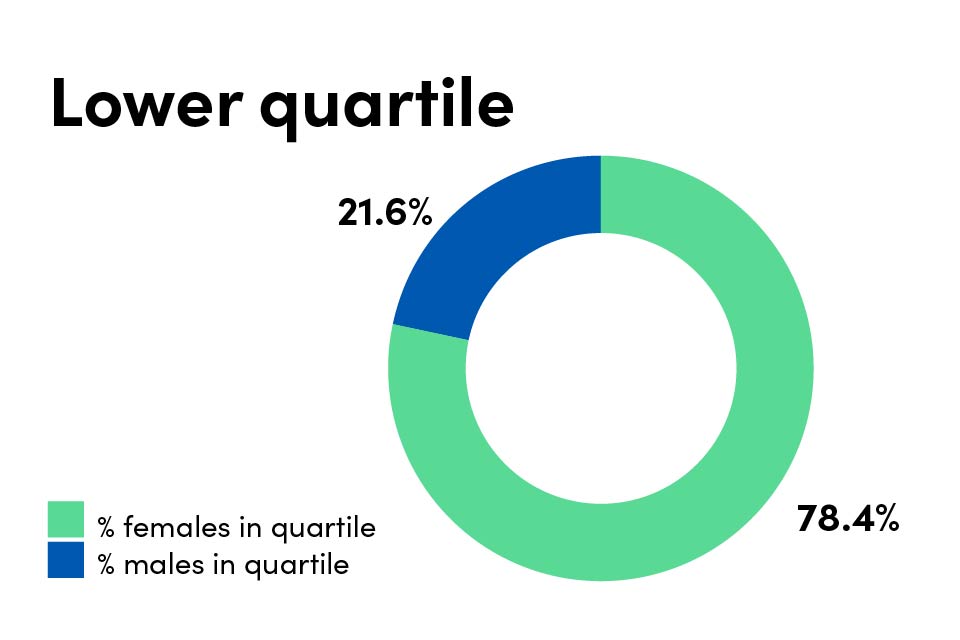
Pie chart showing Ofqual’s lower pay quartile broken down by male and female employees. 78.4% in the lower quartile are female and 21.6% are male.
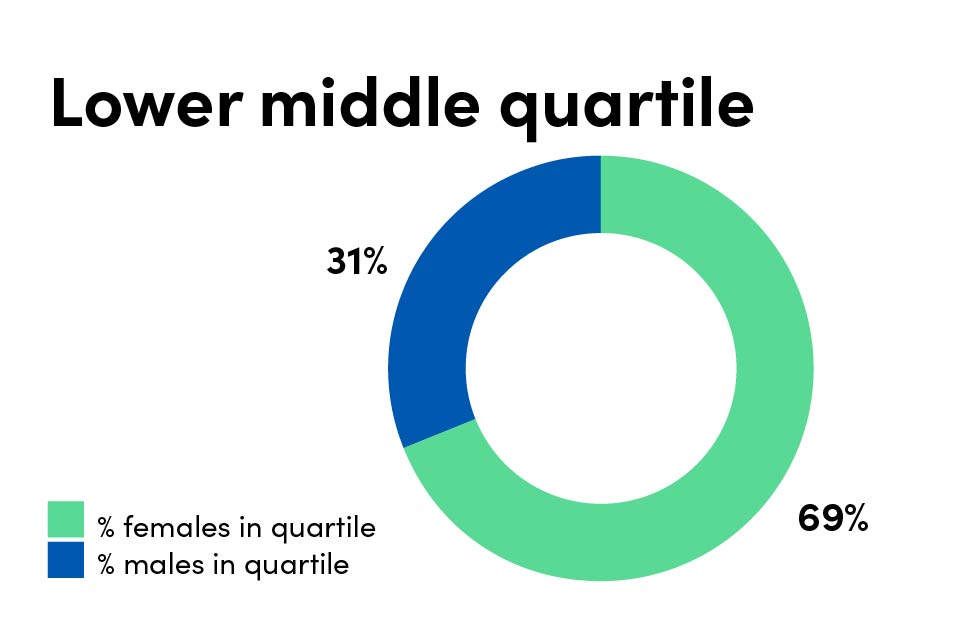
Pie chart showing Ofqual’s lower middle pay quartile broken down by male and female employees. 69% in the lower middle quartile are female and 31% are male.
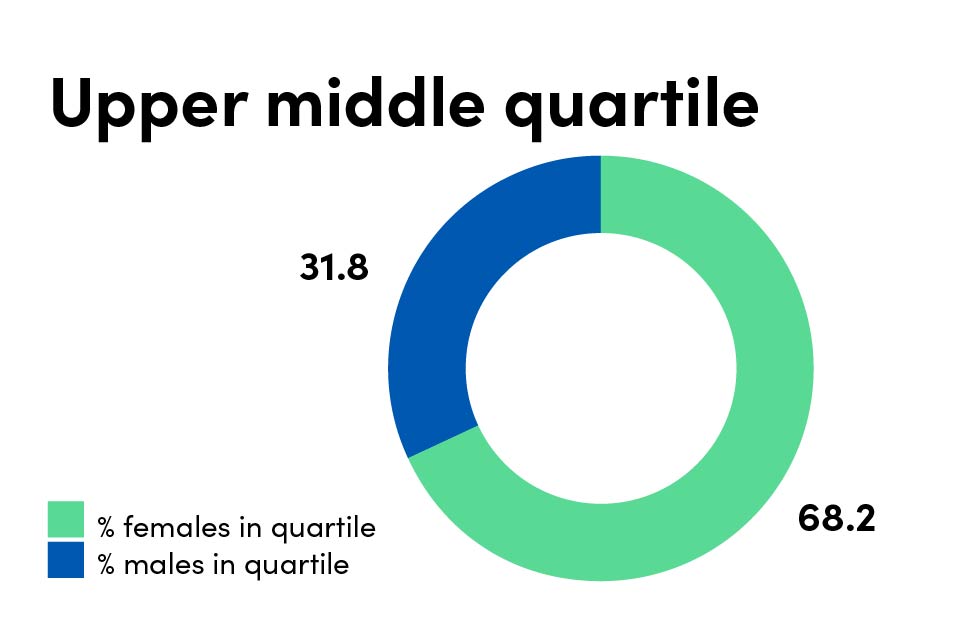
Pie chart showing Ofqual’s upper middle pay quartile broken down by male and female employees. 68.2% in the upper middle quartile are female and 31.8% are male.
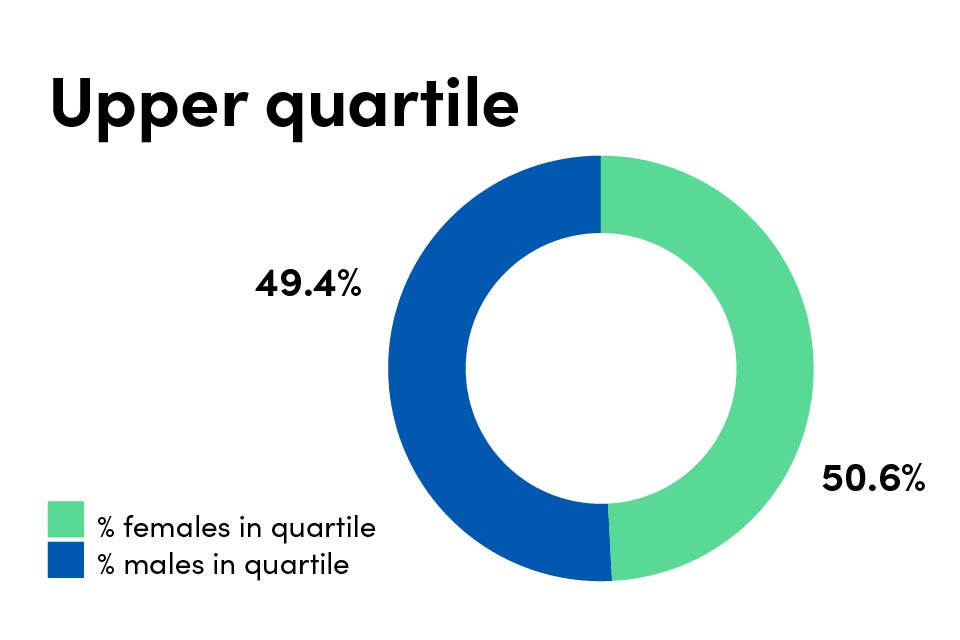
Pie chart showing Ofqual’s upper pay quartile broken down by male and female employees. 50.6% in the upper quartile are female and 49.4% are male.
The median and mean gender pay gap for the Civil Service is 8.5% and 7.4%, down from 9.6% and 8.1% in 2023 respectively[footnote 1].
Pay ranges
Ofqual aims to appoint new external staff into post on the minimum salary for the grade. For internal promotion purposes, individuals are eligible to have their pay adjusted to reward promotion. This is based on the higher of the following:
-
the pay band minimum of the higher grade
-
existing basic salary +10% (providing it is at or below the pay band maximum for the current grade)
Any variation to this must be approved by the Executive Director Finance and Operations and consideration during this process is given to comparative roles in the organisation alongside the gender profile for the grade. Pay on appointment must not exceed the maximum for the grade.
There is no incremental progression through the salary range but pay may increase if an annual consolidated pay award is made. In the 2023 to 2024 pay award, Ofqual issued a 4.5% increase to all staff in grades AO to G6. In addition to this, 0.5% of the pay bill was made available to staff in grades at SEO and below. This meant that staff at those grades received a 4.5% pay award and an additional consolidated lump sum amount, resulting in an average pay award percentage increase greater than 4.5%.
Ofqual grades and pay bands as of 31 March 2024 were as follows:
| Grade | Minimum £ | Maximum £ |
|---|---|---|
| Administrative Officer (AO) | £20,085 | £21,624 |
| Executive Officer (EO) | £23,793 | £27,540 |
| Higher Executive Officer (HEO) | £32,250 | £37,536 |
| Senior Executive Officer (SEO) | £39,532 | £45,798 |
| Grade 7 | £48,925 | £59,085 |
| Grade 6 | £65,539 | £72,930 |
| SCS1 | £75,000 | £117,800 |
| SCS2 | £97,000 | £162,500 |
| SCS3 | £127,000 | £208,100 |
Grading structure
The following table illustrates the percentages of Ofqual’s grading structure where the postholder is female and compares the year-on-year change:
| Grade | 2024 | 2023 | Difference |
|---|---|---|---|
| AO | 55.6% | 71.4% | -15.8% |
| EO | 87.0% | 77.8% | +9.2% |
| HEO | 75.9% | 73.8% | +2.1% |
| SEO | 70.4% | 62.5% | +7.9% |
| G7 | 61.2% | 55.2% | +6.0% |
| G6 | 61.1% | 65.5% | -4.4% |
| SCS | 26.3% | 42.1% | -15.8% |
| Total | 66.6% | 63.6% | +3.0% |
The number of women at EO, HEO, SEO and G7 has increased by 9.2%, 2.1%, 7.9% and 6.0% respectively in the last 12 months. The proportion of women in AO, G6 and SCS has decreased by 15.8%, 4.4% and 15.8%.
Overall, the percentage of women employed at Ofqual has increased by 3% with the organisation reporting at 12.1% higher than Civil Service average of 54.5%[footnote 2].
Ofqual employee gender profile
The table below provides the Ofqual employee gender profile for 2024 and 2023:
| Gender | 2024 | 2023 |
|---|---|---|
| Female | 66.6% | 63.6% |
| Male | 33.4% | 36.4% |
Over the period of 2023 to 2024 we have seen an increase in the proportion of female staff joining the organisation (3%), this is 0.6% higher than the previous reporting period.
Analysis of the pay gap at Ofqual
While there are more women than men in all grades, except SCS, there is a larger proportion of women in grades EO to SEO and, therefore, significantly more women than men in the lower pay quartiles.
There has been a pay gap increase in favour of men since the last reporting period of 7.5% based on the mean data and 3.2% based on median data. The decrease in the number of women at Grade 6 and SCS is a significant factor in the increase of the mean pay gap.
2024 Pay and bonus gap
| Reporting organisation | Pay gap mean | Pay gap median | Bonus gap mean | Bonus gap median |
|---|---|---|---|---|
| Ofqual | 18.1% | 17.3% | 4.2% | 0.0% |
2023 Pay and bonus gap
| Reporting organisation | Pay gap mean | Pay gap median | Bonus gap mean | Bonus gap median |
|---|---|---|---|---|
| Ofqual | 10.6% | 14.1% | 6.5% | 8.3% |
2024 Distribution of women through each pay quartile
| Reporting organisation | Lower | Lower middle | Upper middle | Upper |
|---|---|---|---|---|
| Ofqual | 78.4% | 69.0% | 68.2% | 49.4% |
2023 Distribution of women through each pay quartile
| Reporting organisation | Lower | Lower middle | Upper middle | Upper |
|---|---|---|---|---|
| Ofqual | 72.94% | 66.67% | 61.18% | 52.38% |
Analysis of the bonus gap
The bonus gap for 2024 is 4.2% (mean) and 0.0% (median) in favour of men.
The calculation for the bonus gap is based on In Year Awards which are non-consolidated cash awards focusing on organisational performance.
In making an award for bonus payments, a reference period is used as the basis for calculations alongside a set criterion which pro-rates awards based on working patterns and excludes periods of probation, long-term sickness, and family leave.
There are several points to consider when reviewing the bonus gap. These include:
- a higher proportion of women were affected by pro-rating as there was a higher proportion of women working part time hours in comparison with men
- a larger number of women joined the organisation during the reference period and were therefore subject to a probationary period at the time of the bonus award
- a higher proportion of women were affected by pro-rating due to absence in comparison with men
Notwithstanding the above there has been an overall increase of 5.5% of women in receipt of a bonus in 2024.
2024 Percentage of men and women receiving a bonus
| Reporting organisation | 2024 men | 2024 women | 2023 men | 2023 women |
|---|---|---|---|---|
| Ofqual | 92.4% | 94.1% | 96.0% | 88.6% |
Actions undertaken since the last reporting period
Since the last publication Ofqual has taken the following steps in response to Gender Pay Gap analysis:
- continued review of recruitment practices and processes with an emphasis on starting salaries
- focus on EDI committee members shadowing recruitment campaigns to ensure the process is non-biased
- review of pay bands including minimums and maximums
- continued review of pay anomalies across the organisation with a particular focus on gender
- deep dive into the drivers for the gender pay gap in conjunction with Ofqual’s Research directorate
Further actions to be taken
Ofqual will continue to monitor the gender pay gap and will use the 2024 to 2025 pay remit process to consider any anomalies that require addressing while ensuring EDI remains a key focus throughout the organisation.
Focus groups have been set up with all women at Grade 6 to explore whether there are progression barriers which may prevent career development into SCS roles.
Declaration
We confirm that data reported by the Office of Qualifications and Examinations Regulation (Ofqual) is accurate and has been calculated according to the requirements and methodology set out in the Equality Act 2010 (Specific Duties and Public Authorities) Regulations 2017.
Name: Charlie Henning
Job title: Director of People and Culture

