Inspection profiles of the largest private and voluntary providers of children's homes and independent fostering agencies March 2020
Updated 9 October 2024
Applies to England
Summary
This release provides information on private and voluntary providers of children’s homes and independent fostering agencies (IFAs). These 2 provision types account for the majority of private and voluntary placements for children and young people in care.
The release focuses on the largest of these private and voluntary providers: the 10 companies that own the most children’s homes and the 6 companies that offer the most fostering placements through the IFAs they own. A breakdown of the market share owned by these companies is included.
The release provides information on the inspection profiles of the largest providers and of all private and voluntary children’s homes and IFAs nationally. It does not feature any other characteristics of these settings, or the wider factors that local authorities consider when placing a child.
The inspection profiles included show a snapshot of full inspections as at 31 March 2020, with data based on private and voluntary children’s homes and IFAs that had been inspected as at 31 March 2020 with their reports published as at 30 April 2020. Some settings may have improved or declined since this date. Settings which are new and have yet to have their first full inspection are not included within the inspection profiles.
Due to coronavirus (COVID-19), Ofsted suspended all routine inspections of social care providers on 17 March 2020. Therefore, we did not complete the inspection cycle and we completed fewer inspections than in previous years as a result. For more information, see the Ofsted guidance and information page relating to COVID-19.
The largest providers of children’s homes
Within this release, the largest providers were determined by looking at how many children’s homes are owned by the ‘top company’ within an organisation’s ownership chain (as listed on Companies’ House). As many of these ‘top companies’ own multiple organisations that provide children’s homes, the total number of homes owned by the ‘top company’ reflects the sum of homes owned by all these organisations collectively. Details of the 10 ‘top companies’ and the organisations within their ownership chain are shown in table 1.
Table 1: Ownership chain of the 10 ‘top companies’ that own the most children’s homes
| Top company (total number of children’s homes owned by the top company) | Social care organisations owned by the top company (number of children’s homes owned by each organisation) |
|---|---|
| CareTech Holdings Plc (191) | Cambian Childcare Ltd (156) Roc Northwest Ltd (13) Caretech Community Services Limited (7) Cambian Autism Services Limited (4) Roc Family Support Ltd(2) Greenfields Adolescent Development Limited (2) Branas Isaf (holdings) Limited (2) Cambian Asperger Syndrome Services Limited (1) Rosedale Children’s Services Limited (1) Delam Care Limited (1) Cambian Signpost Limited (1) Cambian Whinfell School Ltd (1) |
| Keys Group Limited (G Square Healthcare Private Equity Llp) (98) | Keys Care Ltd (19) Keys Group Progressive Care & Education Limited (12) Keys Nhcc Ltd (10) Keys Education Ltd (9) Keys Educational Services Limited (7) Keys Child Care Limited (7) Keys Direct Care Limited (7) Unique Care Homes Support Limited (5) Keys BR Limited (5) Keys ACE Limited (4) Keys Cwc Ltd (4) Keys Specialist Residential Children’s Services Ltd (3) Keys Stepping Stones Limited (2) Keys KIN Ltd (2) Keys Active 8 Care Ltd (1) Keys QTC Limited (1) |
| The Priory Group (Partnerships in Care Uk 1 Ltd) (62) | Priory Education Services Limited (41) Castle Homes Care Ltd (12) Priory New Education Services Limited (3) Castle Homes Limited (3) Partnerships In Care 1 Limited (2) Quantum Care UK Limited (1) |
| The Outcomes First Group (Sscp Spring Topco Limited) (52) | Hillcrest Children’s Services Ltd (14) Hillcrest Children’s Services (2) Ltd (13) Pathway Care Solutions Ltd (15) Hopscotch Solutions Limited (2) Options Autism (5) Limited (1) Options Autism (4) Ltd (1) Pathway Care Solutions Group Limited (1) Acorn Norfolk Limited (1) Knossington Grange School Ltd (1) Underley Schools Limited (1) Longdon Hall School Limited (1) Options Autism (1) Ltd (1) |
| Horizon Care and Education Ltd (47) | Horizon Care And Education Group Limited (38) Horizon Care and Education Ltd (4) Horizon Care Limited (3) Educare Adolescent Services Limited (2) |
| Hexagon Care Services Limited (Hcs Group Limited) (37) | Hexagon Care Services Limited (37) |
| Sandcastle Care Ltd (Sc Topco Limited) (37) | Sandcastle Care Ltd (37) |
| The Partnership of Care Today (35) | The Partnership Of Care Today (35) |
| Esland Group Holdings Ltd (30) | Esland North Limited (25) Esland South Limited (5) |
| Homes2Inspire Ltd (The Shaw Trust Limited) (27) | Homes 2 Inspire Ltd (27) |
As at 31 March 2020, there were 2,029 private and voluntary children’s homes actively operating in England, an increase of 153 homes since 31 March 2019. The 10 largest providers owned 616 (30%) private and voluntary children’s homes collectively, an increase of 55 homes since 31 March 2019. Despite this increase, the proportion of homes run by the 10 largest providers has stayed the same, at 30% of all private and voluntary children’s homes nationally.
CareTech Holdings Plc (191 homes) was the single largest provider, owning almost double the number of children’s homes than the next largest provider, Keys Group Limited (G Square Healthcare Private Equity Llp) (98). The 191 homes owned by CareTech Holdings Plc account for 31% of homes owned by the 10 largest providers and 9% of all private and voluntary children’s homes nationally.
The proportion of all private and voluntary children’s homes owned by the 10 largest providers is shown in figure 1. The data used in this chart is shown in table 2.
Figure 1: Proportion of all private and voluntary children’s homes owned by the 10 largest providers
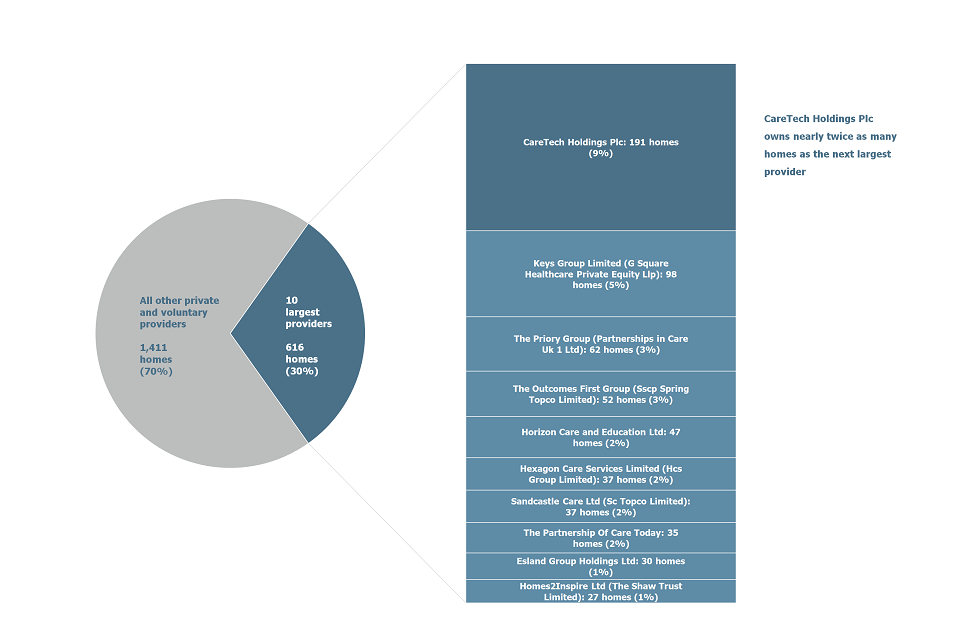
Table 2: Proportion of all private and voluntary children’s homes owned by the 10 largest providers
| Provider | Number of homes owned | Percentage of homes owned by all private and voluntary providers |
|---|---|---|
| 10 largest providers | 616 | 30 |
| CareTech Holdings Plc | 191 | 9 |
| Keys Group Limited (G Square Healthcare Private Equity Llp) | 98 | 5 |
| The Priory Group (Partnerships in Care Uk 1 Ltd) | 62 | 3 |
| The Outcomes First Group (Sscp Spring Topco Limited) | 52 | 3 |
| Horizon Care and Education Ltd | 47 | 2 |
| Hexagon Care Services Limited (Hcs Group Limited) | 37 | 2 |
| Sandcastle Care Ltd (Sc Topco Limited) | 37 | 2 |
| The Partnership Of Care Today | 35 | 2 |
| Esland Group Holdings Ltd | 30 | 1 |
| Homes2Inspire Ltd (The Shaw Trust Limited) | 27 | 1 |
| All other private and voluntary providers | 1,411 | 70 |
Comparing the top 10 providers of children’s homes to the national view of private and voluntary organisations
Across private and voluntary children’s homes nationally, the proportion of good and outstanding homes increased by 1 percentage point from 79% as at 31 March 2019 to 80% as at 31 March 2020. The proportion of good and outstanding children’s homes among the 10 largest provider chains remained slightly above the national figure at 82%. This is the same percentage as among the 10 largest providers in 2019.
The average inspection profile of the 10 largest providers compared to that of all voluntary and private children’s homes as at 31 March 2020 is shown in figure2. The data used in this chart is shown in table 3.
Figure 2: Proportion of children’s homes judged to be good and outstanding among the 10 largest provider chains and other private and voluntary owned children’s homes as at 31 March 2020
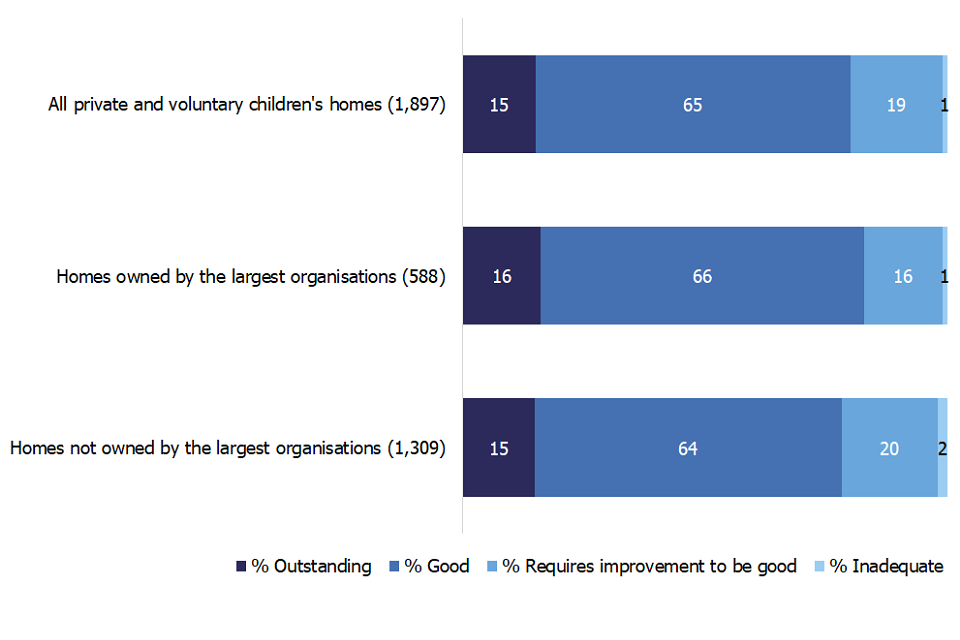
Table 3: Proportion of children’s homes judged to be good and outstanding among the 10 largest provider chains and other private and voluntary owned children’s homes as at 31 March 2020
| Large provider name (total number of homes) | Outstanding (%) | Good (%) | Requires improvement to be good (%) | Inadequate (%) |
|---|---|---|---|---|
| All private and voluntary children’s homes (1,897) | 15 | 65 | 19 | 1 |
| Homes owned by the largest organisations (588) | 16 | 66 | 16 | 1 |
| Homes not owned by the largest organisations (1,309) | 15 | 64 | 20 | 2 |
Figures in brackets indicate the number of homes, that had been inspected as at 31 March 2020, owned by each company.
Where the number of inspections is small, percentages should be treated with caution.
Percentages may not sum to 100 due to rounding.
Inspection profiles of the largest providers of children’s homes
The inspection profile of the 10 largest providers and that of all voluntary and private children’s homes as at 31 March 2020 is shown in figure 3. The data used in this chart is shown in table 4. Across all private and voluntary owned children’s homes nationally, 80% were judged good or outstanding. The inspection profiles of the largest providers were not substantially different to the national average. This is a change from 31 March 2019, where 8 of the 10 largest providers had above average proportions of good and outstanding children’s homes.
Figure 3: Inspection profiles of the 10 largest private and voluntary organisations that own children’s homes as at 31 March 2020
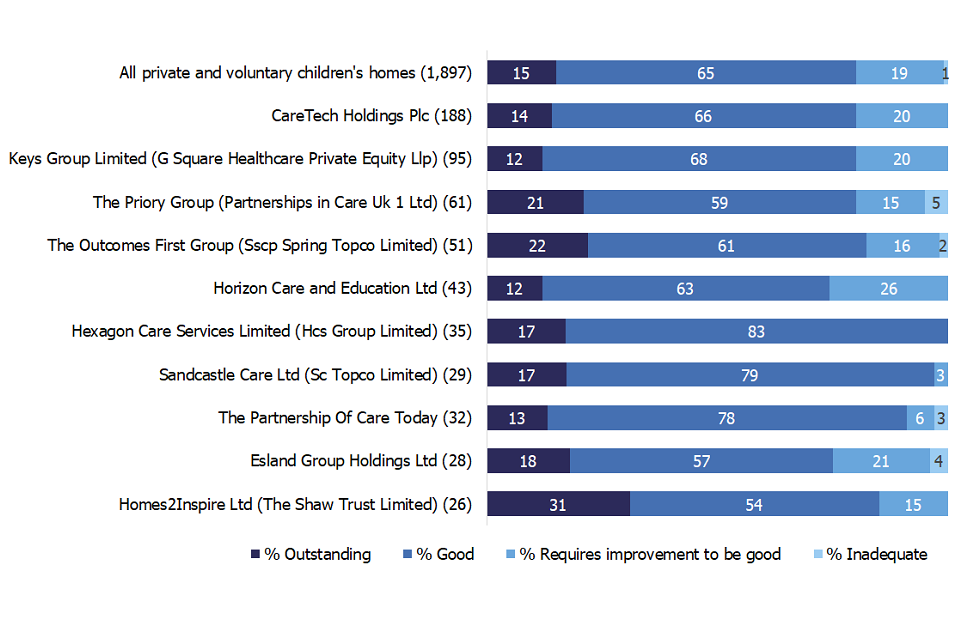
Table 4: Inspection profiles of the 10 largest private and voluntary organisations that own children’s homes as at 31 March 2020
| Large provider name (total number of homes) | Outstanding(%) | Good (%) | Requires improvement to be good (%) | Inadequate (%) |
|---|---|---|---|---|
| All private and voluntary children’s homes (1,897) | 15 | 65 | 19 | 1 |
| CareTech Holdings Plc (188) | 14 | 66 | 20 | 0 |
| Keys Group Limited (G Square Healthcare Private Equity Llp) (95) | 12 | 68 | 20 | 0 |
| The Priory Group (Partnerships in Care Uk 1 Ltd) (61) | 21 | 59 | 15 | 5 |
| The Outcomes First Group (Sscp Spring Topco Limited) (51) | 22 | 61 | 16 | 2 |
| Horizon Care and Education Ltd (43) | 12 | 63 | 26 | 0 |
| Hexagon Care Services Limited (Hcs Group Limited) (35) | 17 | 83 | 0 | 0 |
| Sandcastle Care Ltd (Sc Topco Limited) (29) | 17 | 79 | 3 | 0 |
| The Partnership Of Care Today (32) | 13 | 78 | 6 | 3 |
| Esland Group Holdings Ltd (28) | 18 | 57 | 21 | 4 |
| Homes2Inspire Ltd (The Shaw Trust Limited) (26) | 31 | 54 | 15 | 0 |
Figures in brackets indicate the number of homes, that had been inspected as at 31 March 2020, owned by each company.
Companies are ordered based on the total number of homes they own; not the number of homes they own that had been inspected as at 31 March 2020.
Where the number of inspections is small, percentages should be treated with caution.
Percentages may not sum to 100 due to rounding.
The largest providers of independent fostering agency places
Within this release, the largest providers were determined by looking at the total number of IFA places provided by the ‘top company’ within an organisation’s ownership chain (as listed on Companies’ House). As many of these ‘top companies’ own multiple organisations that provide IFA places, the total number of places provided by the ‘top company’ reflects the sum of IFA places owned by all these organisations collectively. Details of the 6 ‘top companies’ and the organisations within their ownership chain are shown in table 5.
The 6 largest providers are those which had capacity for more than 1,000 foster children as at 31 March 2020.
Table 5: Ownership chain of the 6 ‘top companies’ that provide the most IFA places
| Top company (total number of IFA’s owned by the top company; total number of IFA places provided by the top company) | Social care organisations owned by the top company (number of IFAs owned by each organisation; number of IFA places provided by each organisation) |
|---|---|
| The Outcomes First Group (Sscp Spring Topco Limited) (21; 6,304 places) | The National Fostering Agency Ltd (5; 2,918 places) Fostering Solutions Ltd (4; 1,395 places) Jay Fostering Limited (1; 319 places) Family Placement.com Limited (1; 231 places) Acorn Care & Education Ltd (1; 226 places) Alliance Foster Care Limited (1; 209 places) Pathway Care (South West) Limited (1; 192 places) Heath Farm Children’s Services (1; 167 places) Brighter Futures Foster Care Limited (1; 163 places) Children First Fostering Agency Limited (1; 151 places) Alpha Plus Fostering Limited (1; 122 places) Child Care Bureau Limited (1; 106 places) Hillcrest Children’s Services (2) Ltd (1; 54 places) Reach-Out Care Ltd (1; 51 places) |
| Nutrius Uk Topco Limited (26, 5,235 places) | Foster Care Associates Limited (9; 2,600 places) Fostering People Limited (1; 887 places) Orange Grove Fostercare Ltd (6; 709 places) Isp (5; 574 places) Active Care Solutions Limited (1; 137 places) Fosterplus Limited (2; 133 places) Integrated Services Programme (1; 98 places) Clifford House Fostering Limited (1; 97 places) |
| Compass Community Ltd (6; 3,125 places) | Compass Fostering North Limited (1; 826 places) Compass Fostering Central Limited (1; 685 places) Compass Fostering South Limited (1; 681 places) Compass Fostering London and Eastern Limited (1; 465 places) Compass Fostering Eastern Limited (1; 274 places) Compass Fostering West Limited (1; 194 places) |
| Alderbury Holdings Ltd (3; 1,376 places) | Nexus Fostering Ltd (1; 900 places) Blue Sky Fostering Limited (1; 421 places) Help Me Grow Fostering Services Ltd (1; 55 places) |
| Capstone Foster Care Limited (6; 1,357 places) | Capstone Foster Care (South East) Ltd (2; 491 places) Capstone Foster Care (South West) Limited (1; 291 places) Capstone Foster Care (North) Ltd (1; 244 places) Excel Fostering Limited (1; 233 places) Fostercare UK Ltd (1; 98 places) |
| CareTech Holdings Plc (4; 1,196 places) | By the Bridge Limited (1; 641 places) By the Bridge North West Limited (1; 356 places) Park Foster Care Ltd (1; 123 places) Fostering Support Group Limited (1; 76 places) |
As at 31 March 2020, there were 300 private and voluntary IFAs actively operating in England, offering a total of 36,890 fostering places for children and young people.
The 6 largest providers offered a total of 18,593 fostering places collectively (half of all places nationally). They owned 66 IFAs in total, just over one fifth of all IFAs.
The 2 largest providers of fostering places were The Outcomes First Group (Sscp Spring Topco Limited) (6,304) and Nutrius UK Topco Limited (5,235), who provided over 2,100 more fostering places than the next largest provider, Compass Community Ltd (3,125). The top 2 providers owned 47 IFAs collectively, offering a total of 11,539 fostering places. This was 62% of all fostering places offered by the 6 largest providers and 31% of all places offered by private and voluntary IFAs nationally.
The proportion of fostering places provided by the 6 largest providers is shown in figure 4. The data used in this chart is shown in Table 6.
Figure 4: Proportion of all fostering places provided by the 6 largest providers
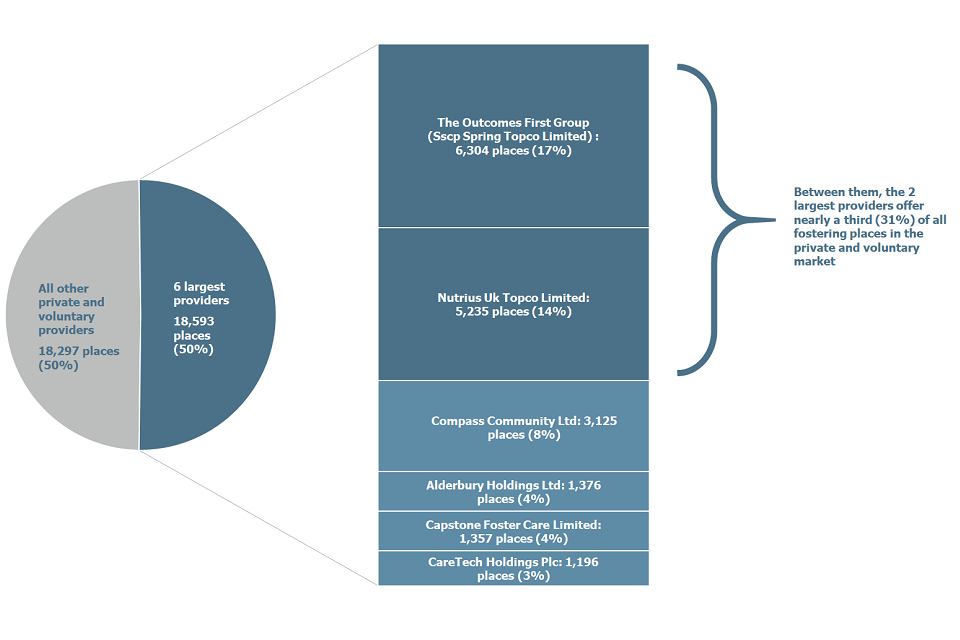
Table 6: Proportion of all fostering places provided by the 6 largest providers
| Provider | Number of IFA places provided | Percentage of places provided by all private and voluntary providers |
|---|---|---|
| 6 largest providers | 18,593 | 50 |
| The Outcomes First Group (Sscp Spring Topco Limited) | 6,304 | 17 |
| Nutrius Uk Topco Limited | 5,235 | 14 |
| Compass Community Ltd | 3,125 | 8 |
| Alderbury Holdings Ltd | 1,376 | 4 |
| Capstone Foster Care Limited | 1,357 | 4 |
| CareTech Holdings Plc | 1,196 | 3 |
| All other private and voluntary providers | 1,411 | 70 |
Comparing the top 6 providers of independent fostering agency places to the national view of private and voluntary organisations
As at 31 March 2020, the proportion of good and outstanding IFAs nationally was 93%. This is 5 percentage points lower than among the 6 largest provider chains (98%).
The average inspection profile of the 6 largest providers compared to that of all voluntary and private IFAs as at 31 March 2020 is shown in figure 5. The data used in this chart is shown in table 7.
Figure 5: Proportion of IFAs judged to be good or outstanding among the 6 largest provider chains and other private and voluntary owned IFAs as at 31 March 2020
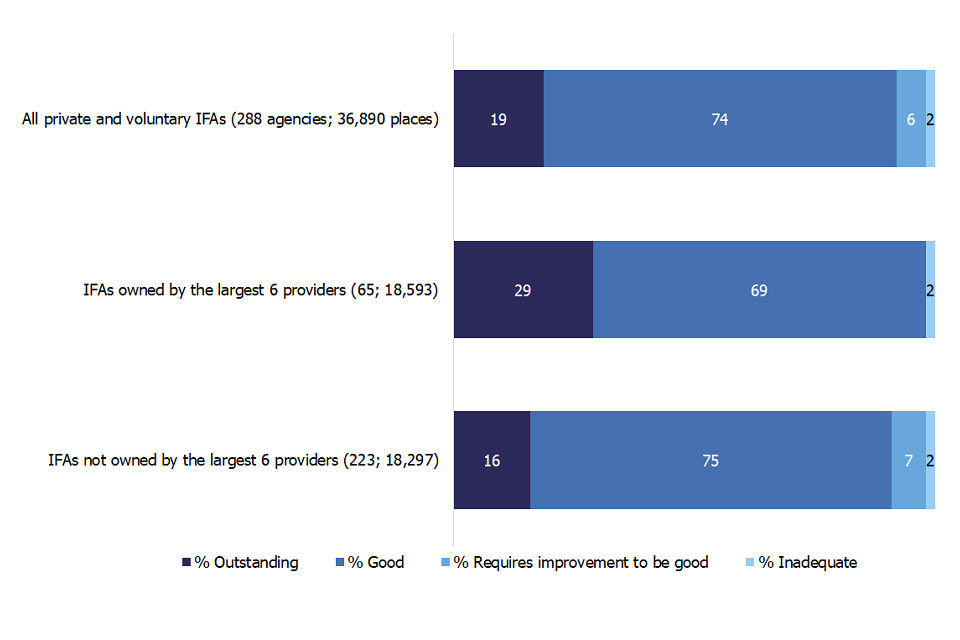
Table 7: Proportion of IFAs judged to be good or outstanding among the 6 largest provider chains and other private and voluntary owned IFAs as at 31 March 2020
| Large provider name (total number of IFAs; total number of places) | Outstanding(%) | Good(%) | Requires improvement to be good (%) | Inadequate (%) |
|---|---|---|---|---|
| All private and voluntary IFAs (288 agencies; 36,890 places) | 19 | 74 | 6 | 2 |
| IFAs owned by the largest 6 providers (65; 18,593) | 29 | 69 | 0 | 2 |
| IFAs not owned by the largest 6 providers (223; 18,297) | 16 | 75 | 7 | 2 |
Figures in brackets indicate the number of IFAs, that had been inspected as at 31 March 2020, owned by each company and the total number of fostering places provided by each company.
Where the number of agencies is small, percentages should be treated with caution.
Percentages may not sum to 100 due to rounding.
Companies among the largest providers of both children’s homes and IFA places
Two top companies appear within the largest provider lists for both children’s homes and IFA places. These companies are:
- CareTech Holdings Plc
- The Outcomes First Group (Sscp Spring Topco Limited)

