Rates of pelvic inflammatory disease (PID) diagnoses in England (2014 to 2023): an outcome of STIs and other factors
Updated 27 March 2025
Applies to England

© Crown copyright 2025
This publication is licensed under the terms of the Open Government Licence v3.0 except where otherwise stated. To view this licence, visit nationalarchives.gov.uk/doc/open-government-licence/version/3 or write to the Information Policy Team, The National Archives, Kew, London TW9 4DU, or email: psi@nationalarchives.gov.uk.
Where we have identified any third party copyright information you will need to obtain permission from the copyright holders concerned.
This publication is available at https://www.gov.uk/government/publications/pelvic-inflammatory-disease-in-england/rates-of-pelvic-inflammatory-disease-pid-diagnoses-in-england-2014-to-2023-an-outcome-of-stis-and-other-factors
Main messages
The main messages from this report are that:
-
from 2014 to 2023, in 15 to 44 year old women, more pelvic inflammatory disease (PID) diagnoses were made in hospital inpatients than in either sexual health services (SHSs) or general practice (GP) clinics
-
in hospital inpatients, PID diagnosis rates in 15 to 44 year old women increased gradually from 2014 to 2019, dropped in 2020, then resumed the increasing trend; in SHSs and GPs, PID diagnosis rates decreased from 2014 to 2023, with a marked drop during 2020
-
in 2023, PID diagnosis rates were 238 per 100,000 population in hospital inpatient settings (26,454 diagnoses), 67 per 100,000 population in SHSs settings (7,499 diagnoses), and 107 per 100,000 person-years in GP settings (3,500 diagnoses)
-
the distribution of PID diagnosis rates by age group differed between settings: in hospital inpatients, rates were highest in the older age groups studied, 30 to 34 and 35 to 44; in SHSs, rates were highest in the 20 to 24 and 25 to 29 age groups; in GPs, rates were relatively similar across all age groups over 20
-
among 15 to 24 year old women, diagnoses of PID at SHSs declined in all sub-groups defined by co-diagnosis with chlamydia (CT-PID), gonorrhoea (GC-PID), or neither (NS-PID), since 2014; however, GC-PID fluctuated and declined notably less
Background
Pelvic inflammatory disease (PID) is a spectrum of clinical disorders involving inflammation of the upper reproductive tract. This includes inflammation of the uterus, fallopian tubes, ovaries, or adjacent peritoneum. Sexually transmitted infections (STIs) such as Chlamydia trachomatis (‘chlamydia’), Neisseria gonorrhoea (‘gonorrhoea’) and Mycoplasma genitalium can ascend the genital tract and cause PID (1).
PID can also be caused by the insertion of an intrauterine device, or by bacteria found naturally in the vagina (1). Symptoms lack both sensitivity and specificity and can be confused with lower abdominal pain from other causes (1). PID increases the risk of further harms such as ectopic pregnancy and tubal factor infertility (1,2,3). PID is diagnosed in a range of clinical settings, with variations in diagnostic and coding practices.
The National Chlamydia Screening Programme (NCSP) was introduced in 2003. It aimed to reduce the transmission and harms of chlamydia through early detection and treatment. It worked by screening sexually active people under 25 years of age during the peak years of chlamydia transmission (4,5). In 2021, the NCSP re-focused on reducing the harms of chlamydia infection in women (5). PID is the most frequent harm of chlamydia and is on the pathway to the more severe, rarer harms. The UK Health Security Agency (UKHSA) and its predecessors have reported previous findings in a Health Protection Report published in 2015, investigating PID trends in hospital inpatients and general practice (GP) clinics from 2000 to 2013 (6); another study analysed PID trends in sexual health services (SHSs) from 2009 to 2019 (7).
We have collated available data on diagnoses of PID in different settings to inform evaluation of the NCSP. However, as most PID diagnoses do not identify the cause, this data is more widely applicable as a measure of female reproductive tract health.
Methodological notes
This analysis used 3 datasets, each from a different clinical setting. Data from hospital inpatient care was obtained from the Hospital Episode Statistics (HES) admitted patient care (APC) dataset, from all hospitals in England. Data from all SHSs in England was obtained from the GUMCAD STI Surveillance system (GUMCAD). Data from a subset of English GP clinics was obtained from the Clinical Practice Research Datalink (CPRD) Aurum dataset. The March 2024 CPRD Aurum extract, used in this analysis, contains data from 19.86% of UK general practices (8).
PID is diagnosed and recorded differently across the three settings. In HES APC, international classification of diseases (ICD-10) codes are used. In GUMCAD, SNOMED codes are reported. If a PID code is reported on the same day as a chlamydia or gonorrhoea diagnosis, it is converted into chlamydial-associated PID (CT-PID) or gonococcal-associated PID (GC-PID). All other episodes are converted into non-specific PID (NS-PID), and together these subgroups sum to all PID. In CPRD Aurum, a combination of SNOMED, Read, and local EMIS® codes are used. These CPRD codes were classified as ‘definite’, ‘probable’ and ‘possible’ PID based on assessment and clinical review, as seen in French and others (9). Definite and probable PID were combined and used in this report for comparison with diagnoses in other settings.
Records were de-duplicated to 1 episode of PID per 42-day period per individual within each dataset to avoid double-counting diagnoses. This 42-day period is in line with the standard episode length used for STI surveillance in GUMCAD (10,11).
PID diagnosis rates were calculated per 100,000 population for SHSs and hospital inpatient diagnoses using ONS mid-year population estimates (12). For GP clinic diagnoses, rates were calculated per 100,000 person-years using the age-specific person-years within the CPRD dataset, which represents a subset of the primary care population.
Results
Trends in PID diagnosis rates by clinical setting, 2014 to 2023
Figure 1 shows trends in PID diagnosis rates in 15 to 44 year old women from 2014 to 2023. The rates of hospital inpatient diagnoses were highest. The PID diagnosis rates in SHSs and GPs were initially similar before the rate in SHSs dropped lower than in GPs from 2016 onwards. In 2023, PID diagnosis rates were 238 per 100,000 population in hospital inpatient settings (26,454 diagnoses), 67 per 100,000 population in SHS settings (7,499 diagnoses), and 107 per 100,000 person-years in GP settings (3,500 diagnoses).
In hospital inpatient data, PID diagnosis rates increased gradually from 2014 to 2019, before dropping 23% in 2020. Rates have since increased but have not reached 2019 rates by 2023. A different trend was observed in SHSs and GP clinics. In both, rates decreased gradually from 2014 until 2020, when SHSs rates dropped by 31% and GP rates by 20%. Since 2020, rates have stayed relatively stable in both settings, fluctuating slightly. Overall, from 2014 to 2023 in 15 to 44 year olds, the PID rate in hospital inpatients increased by 1%, in SHSs decreased by 54%, and in GP clinics decreased by 28%.
Figure 1. PID diagnosis rates in 15 to 44 year old women by clinical setting, 2014 to 2023 England
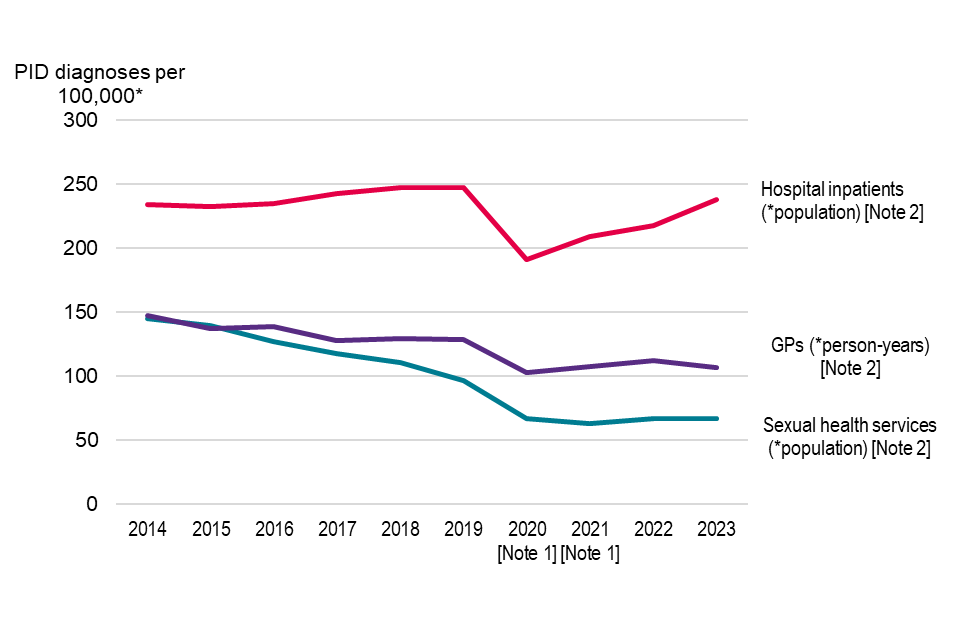
Note 1: Figures reported in 2020 and 2021 are notably lower than previous years due to the disruptions to services during the national response to the COVID-19 pandemic.
Note 2: PID diagnosis and coding practices vary across clinical settings. Hospital inpatient settings use ICD-10 codes; sexual health services (SHSs) use SNOMED codes; and general practice (GP) settings use a combination of SNOMED, Read and local EMIS® codes, classified as definite or probable PID for the purpose of this analysis.
Source: UKHSA analysis of sexual health services data from the GUMCAD STI Surveillance System, hospital inpatient data from Hospital Episode Statistics, and general practice data from the Clinical Practice Research Datalink Aurum.
Variation in PID diagnosis rates by age group and clinical setting
The age distribution of PID diagnosis rates varied across clinical settings. Figure 2 presents the most recent year of data, 2023. It shows the rate of diagnoses in hospital inpatients was lower in younger age groups and higher in older age groups. PID diagnosis rate in hospital inpatients was highest in the 30 to 34 and 35 to 44 age groups (312 and 304 per 100,000 population, respectively). In SHSs, diagnosis rates were highest in the 20 to 24 and 25 to 29 age groups (120 and 96 per 100,00 population, respectively), and lower in the youngest and older age groups. In GPs, diagnosis rates in those over 20 were relatively similar, with the youngest age group seeing lower rates. These differences largely reflect the underlying age structure of overall attendances in these settings (data not shown).
Figure 2. PID diagnosis rates in women by age group and clinical setting, 2023 England
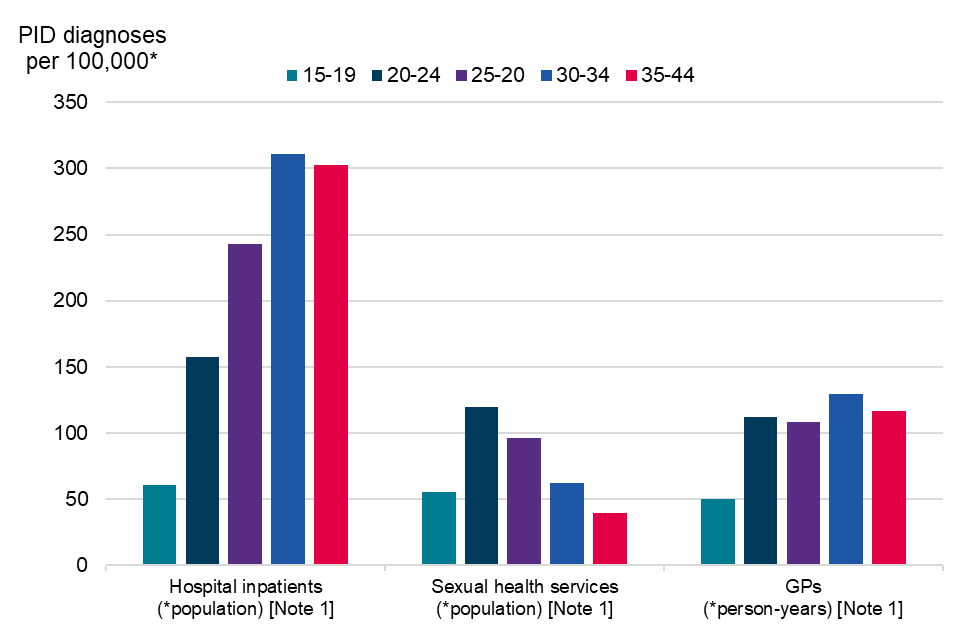
Note 1: PID diagnosis and coding practices vary across clinical settings. Hospital inpatient settings use ICD-10 codes; sexual health services (SHSs) use SNOMED codes; and general practice (GP) settings use a combination of SNOMED, Read and local EMIS® codes, classified as definite or probable PID for the purpose of this analysis.
Source: UKHSA analysis of sexual health services data from the GUMCAD STI Surveillance System, hospital inpatient data from Hospital Episode Statistics, and general practice data from the Clinical Practice Research Datalink Aurum.
Trends of different PID subgroups in sexual health services (SHSs), 2014 to 2023
In data from SHSs, PID can be sub-classified into CT-PID, GC-PID and NS-PID. The 15 to 24 age group is the target group of chlamydia screening. Figure 3 shows the trends in different subgroups of PID in 15 to 24 year old SHS attendees. The majority of diagnoses were not associated with a concurrent STI diagnosis (NS-PID). CT-PID rates had lower but similar trends to NS-PID over time. Since 2014, NS-PID decreased by 60% and CT-PID by 66%. GC-PID rates were the lowest and decreased by only 20% since 2014, with fluctuation. All PID subgroups dropped similarly in 2020. Since 2020, NS-PID has gradually decreased and CT-PID and GC-PID have fluctuated.
Figure 3. PID diagnosis rates in 15 to 24 year old women at sexual health services (SHSs) by PID subgroup – Chlamydial-associated (CT-PID); Gonococcal-associated (GC-PID); and non-specific (NS-PID) – in England, 2014 to 2023
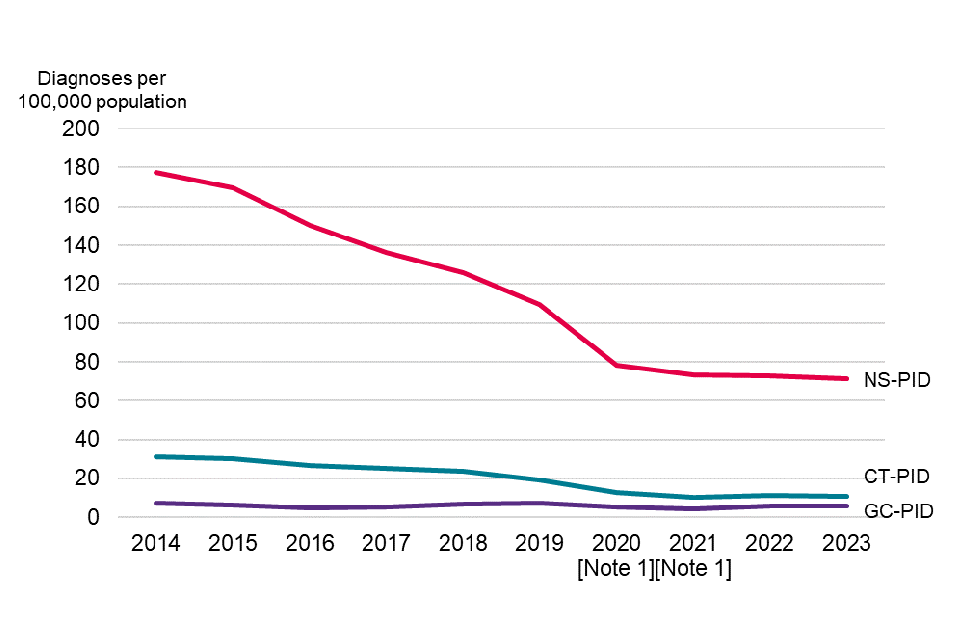
Note 1: Figures reported in 2020 and 2021 are notably lower than previous years due to the disruption of services during the national response to the COVID-19 pandemic.
Source: UKHSA analysis of sexual health services data from the GUMCAD STI Surveillance System.
Discussion
Between 2014 and 2023, in 15 to 44 year old women, declines were seen in PID diagnoses at SHSs and GP surgeries. Increases were seen in hospital inpatient settings. This could indicate a shift in PID cases between clinical settings. However, it is important to consider that populations using these services may be different, and the age distribution of PID diagnoses differs between settings. Due to the complex causal pathways of PID, including non-STI related causes, a direct comparison between services should consider differences and be undertaken with care.
In SHSs, all PID in those 15 to 44 years old declined by 54% between 2014 and 2023; in 15 to 24 year olds, NS-PID declined by 60%, and CT-PID declined by 66%. The decrease in PID rate in SHSs since 2019 may partially reflect fewer face-to-face attendances.
In 2023, among 15 to 44 year-old women, the observed diagnosis rates were, approximately, 1 in 420, 1 in 1500, and 1 in 930 for diagnoses in hospitals, at SHSs and in a subset of GP settings, respectively.
Differences between settings may be partly due to variations in diagnostic and coding practices.
Evaluation of STI control strategies that aim to reduce PID, such as the NCSP, requires careful consideration of how to measure and interpret this outcome.
External datasets information
CPRD analysis
This study (CPRD Approved Study Protocol number: 23_003497) is based in part on data from the Clinical Practice Research Datalink obtained under licence from the UK Medicines and Healthcare products Regulatory Agency. The data is provided by patients and collected by the NHS as part of their care and support. The interpretation and conclusions contained in this study are those of the authors alone.
Hospital Episode Statistics (HES) analysis
This UKHSA study made use of HES data with the permission of the NHS England.
References
1. BASHH (2019). ‘United Kingdom National Guideline for the Management of Pelvic Inflammatory Disease (2019 Interim Update)’.
2. Hillis and others (1993). ‘Delayed care of pelvic inflammatory disease as a risk factor for impaired fertility’. American Journal of Obstetrics and Gynecology: volume 168 number 5, pages 1,503 to 509.
3. Taylor and others (2011). ‘Microbial correlates of delayed care for pelvic inflammatory disease’. Sexually Transmitted Diseases: volume 38 number 5, pages 434-8.
4. Department of Health (2004). ‘Choosing Health: making healthier choices easier. Chapter 6: A health-promoting NHS’.
5. Public Health England (2021). ‘Changes to the National Chlamydia Screening Programme: Information on the changes’.
6. Public Health England (2015). ‘Rates of pelvic inflammatory disease in England, 2000-2013’. Health Protection Report volume 9, number 22.
7. Davis and others (2021). ‘What do diagnoses of pelvic inflammatory disease in specialist sexual health services in England tell us about chlamydia control?’. Journal of Infectious Diseases: volume 224, number 12 (supplement 2), pages 113 to 120.
8. CPRD (2024). ‘CPRD Aurum March 2024 dataset’.
9. French and others (2011). ‘Estimation of the rate of pelvic inflammatory disease diagnoses: trends in England, 2000-2008’. Sexually Transmitted Diseases volume 38, number 3, pages 158 to 162.
10. Savage and others (2014). ‘Improving surveillance of sexually transmitted infections using mandatory electronic clinical reporting: the genitourinary medicine clinic activity dataset, England, 2009 to 2013’. Eurosurveillance: volume 29, number 19, page 48.
11. Hughes G, Nichols T, Peters L, Bell G, Leong B, Kinghorn G (2013). ‘Repeat infection with gonorrhoea in Sheffield, UK: predictable and preventable?’. Sexually Transmitted Infections: volume 89, number 1, pages 38 to 44.
12. ONS (2024). ‘Estimates of the population for England and Wales: mid 2011 to mid-2023 detailed time series edition’.