Additional information on assumptions used to develop decarbonising transport scenarios
Updated 12 January 2023
Background
Decarbonising transport: a better, greener Britain was published in July 2021.
The majority of the analysis for the document, including National Transport Model (NTM) runs, was undertaken in 2021.
This note provides further information on how the scenarios in decarbonising transport were constructed. It covers:
- approach to constructing decarbonising transport greenhouse gas projections
- policy savings assumptions
- high and low demand scenarios in the NTM
Approach to constructing decarbonising transport greenhouse gas projections
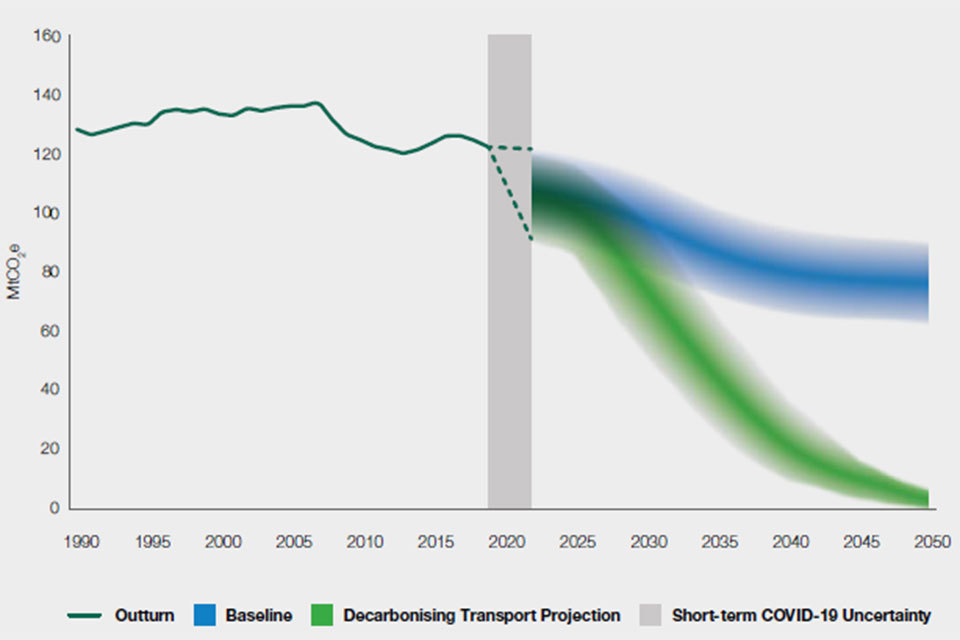
Decarbonising transport published the following greenhouse gas (GHG) projection for domestic emissions.

Chart 1: Decarbonising transport domestic transport GHG emission projections.
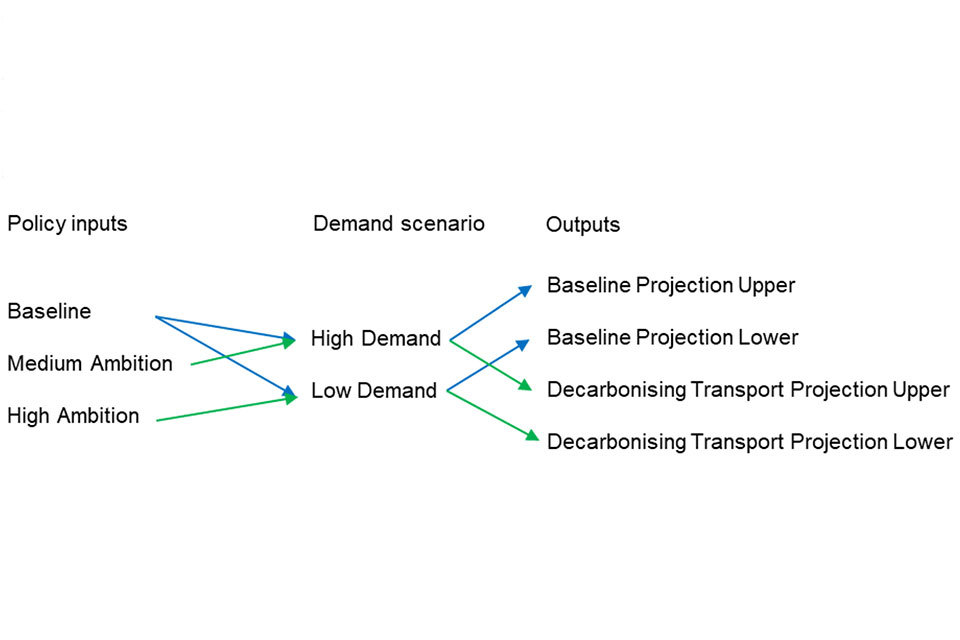
Baseline and policy projections were created for the decarbonising transport projection in the following way:
- Define baseline, medium and high ambition policy inputs.
- Define low and high demand scenarios.
- Combine policy inputs and demand scenarios.
The policy inputs and demand scenarios were combined in the following way:
For the baseline:
- upper bound – combines baseline policy ambition with high demand scenario
- lower bound – combines baseline policy ambition with low demand scenario
For the decarbonising transport projection:
- upper bound – combines medium policy ambition with high demand scenario
- lower bound – combines high policy ambition with low demand scenario
Uncertainty ranges are then placed around projections, depending on the data available. Car and van uncertainty was produced in the NTM, using evidence from the common analytical scenarios. Non-road transport and heavy goods vehicle (HGV) and bus uncertainty was estimated based on the historical volatility of emissions in that sector.

Chart 2: Flow diagram for creating decarbonising transport domestic transport scenarios.
Policy savings assumptions
The following list provides an overview of the policy assumptions used in the modelling.
Baseline assumptions:
- all scenarios are compared against a baseline of current firm and funded policies, which deliver significant decarbonisation
Medium ambition policy assumptions:
- future CO2 regulation sales for cars, vans, HGVs, buses and coaches
- assumes 70% of car sales are ultra low emission vehicles (ULEV) by 2030
- car and van fiscal incentives to support ULEV uptake in the short run
- 4000 zero emission bus scheme
- rail electrification programme in line with the Traction Decarbonisation Network Strategy (TDNS)
- net zero domestic aviation by 2040
- long run investment in cycling and walking
- Renewable Transport Fuel Obligation (RTFO) increase of up to 2.5%
- domestic shipping emissions reduced close to zero by 2050
High ambition policy assumptions:
- most ambitious CO2 regulation sales for cars, vans, HGVs, buses and coaches
- assumes 100% of car sales ULEV by 2030
- car and van fiscal incentives to support ULEV uptake in the short run
- 4000 zero emission bus scheme
- rail electrification programme in line with TDNS
- net zero domestic aviation by 2040
- long run most ambitious investment in cycling and walking
- RTFO increase of up to 5%
- domestic shipping emissions reduced close to zero by 2040
- increasing car occupancy
- increasing the efficiency of HGV and van logistics
- expanding HGV efficient driver training (see note 1)
- expanding the Emissions Trading Scheme (ETS) to cover road transport fuels from 2028 (see note 1)
- accelerating fleet turnover of petrol and diesel vehicles from 2028 (see note 1)
Note 1: as set out in the decarbonising transport document, depending on progress in the sector at some points we may require additional targeted action (such as steps to reduce use of the most polluting cars and tackle urban congestion) to enable these targets to be met. We will regularly review progress against our targets, continue to adapt and take further action if needed to decarbonise transport. These are illustrations of the type of further action that could be taken if required.
The chart below highlights carbon savings in the medium and high ambition policy scenarios.

Chart 3: Carbon savings in the medium and high ambition policy savings.
Note 2: carbon savings in the medium ambition scenario assume high demand and are estimated against a high demand baseline, and savings in the high ambition scenario assume low demand and are estimated against a low demand baseline. As baseline emissions in the medium ambition scenario are assumed to be higher than in the high ambition scenario, carbon savings in the medium ambition scenario can exceed those in the high ambition scenario.
High and low demand scenarios in the NTM
The NTM was used to project transport demand.
To test the robustness of the policies in an uncertain future, we used a scenario approach for this analysis. We have 2 possible futures of travel demand based on key uncertainties. Each of these demand scenarios includes their own assumptions about the future.
Low travel demand
This scenario investigates lower trip rates due to behavioural change combined with the impacts of lower gross domestic product (GDP) and higher fuel prices. This assumes that the impact of the coronavirus (COVID-19) pandemic in 2020 on travel behaviour continues and trip rates do not return to pre-pandemic levels.
The GDP is based on the Office for Budget Responsibility (OBR) downside medium term forecast and OBR long term forecast annual growth rate.
The fuel assumptions were created using the BEIS Fossil Fuel Price Assumptions (FFPA) ranges. These two assumptions affect the demand for light goods vehicle (LGV) and HGV traffic as well as depressing personal travel car demand.
High travel demand
This scenario explores the possible impacts of a high travel demand on a decarbonising transport policies ability to decarbonise.
This scenario uses the technology assumption that connected autonomous vehicles (e.g. self-driving cars) are introduced and is based on the technology scenario from Road Traffic Forecasts 2018 (RTF18).
Given the self-driving nature of connected autonomous vehicles, all members of society are assumed able to use a car, which is modelled by increasing the percentage of the population with driving licences to 100% by 2046. This also allows more trips from the 75+ cohort, as they are not disenfranchised from road travel.
It also sees the value of time (VOT) fall by 25%, this means that people are more willing to travel in car as the experience is expected to be nicer without the requirement to drive.
This technology scenario makes an assumption about the impact on car occupancy that connected autonomous vehicles will have. The scenario assumes that people are less willing to share and the average car occupancy will decrease.
The GDP is based on the OBR upside medium term forecast and OBR long term forecast annual growth rate.
The fuel assumptions were created using the BEIS FFPA ranges. These two assumptions affect the demand for LGV and HGV traffic as well as incentivising personal travel car demand.
A summary of the assumptions is also provided in a table below.
Table: High and low demand scenario assumptions used in the NTM.
| Low travel demand | High travel demand | |
|---|---|---|
| GDP | Nov 2020 OBR FSR downside and EFO long run determinants | Nov 2020 OBR FSR upside and EFO long run determinants |
| Fuel Price | TAG + adjustment from BEIS FFPA | TAG + adjustment from BEIS FFPA |
| Population | NTEM 7.2 | NTEM 7.2 |
| Employment | NTEM 7.2 | NTEM 7.2 |
| Behaviour – trip rates in 2020/21 | Reduction of trip rates by -38% and -24% (from baseline) in 2020 and 2021 respectively | NTEM 7.2 |
| Behaviour – trip rates in 2022+ | -15% (from baseline) in 2022 and then extrapolated trip rates assumptions out to 2050 (similar to Scenario 6 in RTF18) |
NTEM 7.2 Trips from 65+ cohort increase in-line with unemployed adults by 2046 as per RTF18 Technology Scenario |
| Driving licence | Lower rates for younger generations as per Scenario 6 in RTF18 | Increased rates from 2031 to 100% by 2046 as per RTF18 Technology Scenario |
| Other | VOT fall by 25% by 2050. Car occupancy drops from ~1.55 to ~1.2 (both as per RTF18 Technology Scenario) |
