Universal Credit and the patterns of rent balances in the Social Rented Sector - analytical report
Published 7 October 2024

© Crown copyright 2024
This publication is licensed under the terms of the Open Government Licence v3.0 except where otherwise stated. To view this licence, visit nationalarchives.gov.uk/doc/open-government-licence/version/3 or write to the Information Policy Team, The National Archives, Kew, London TW9 4DU, or email: psi@nationalarchives.gov.uk.
Where we have identified any third party copyright information you will need to obtain permission from the copyright holders concerned.
This publication is available at https://www.gov.uk/government/publications/universal-credit-and-the-patterns-of-rent-balances-in-the-social-rented-sector-social-researchrent-analysis/universal-credit-and-the-patterns-of-rent-balances-in-the-social-rented-sector-analytical-report
Background
A report of research carried out by the Department for Work and Pensions (DWP) in conjunction with eight Social Rented Sector landlords (Curo, Dudley Metropolitan Borough Council (MBC), GreenSquare Group, Northwards Housing, Notting Hill Genesis Housing Group, Tai Tarian, Together Housing Group and Your Homes Newcastle) in England and Wales.
The DWP would like to thank all the landlords for their help and advice in compiling this report, and their commitment to working with DWP to understand how Universal Credit (UC) works for their tenants.
A report of research carried out by the Department for Work and Pensions in conjunction with eight social landlords (Curo, Dudley Metropolitan Borough Council (MBC), GreenSquare Group[footnote 1], Northwards Housing[footnote 2], Notting Hill Genesis Housing Group, Tai Tarian, Together Housing Group and Your Homes Newcastle) in England and Wales.
We would also like to thank Adam Robinson and Andy Brittan (DWP).
© Crown copyright 2024.
You may re-use this information (not including logos) free of charge in any format or medium, under the terms of the Open Government Licence. To view this licence, visit [The National Archives, Open Government Licence] (http://www.nationalarchives.gov.uk/doc/open-government-licence), write to the Information Policy Team, The National Archives, Kew, London TW9 4DU or email: psi@nationalarchives.gov.uk.
This document/publication is also available on our website at: https://www.gov.uk/government/collections/research-reports
If you would like to know more about DWP research, please email: Socialresearch@dwp.gov.uk.
First published October 2024
ISBN 978-1-78659-738-0
Views expressed in this report are not necessarily those of the DWP or any other Government Department.
Executive summary
The analysis of rent balances was based on rent records provided by 8 Social Rented Sector landlords operating across 6 Regions in England and Wales. We analysed rent account histories for 15,750 of their tenants who we linked to UC administrative data. In this report “Rent balance” is defined in relation to a tenant’s rent account and includes those tenants whose rent balances are in credit as well as those in arrears.
The data collected covers the period early 2014 to February 2019 and so captures the early period of UC roll out and therefore predates the COVID-19 pandemic, and associated societal changes including job losses, furlough, and changes to benefit rates.
People often claim UC following a change in circumstance, such as losing a job or separating from a partner or gaining a rent liability, that can have financial impacts. Some tenants that make regular and timely payments on their rent account and are claiming UC may be considered to be in book arrears. This is due to the difference between when their rent is charged (usually weekly or 4-weekly), and when UC is paid.
Analysis overall shows that on average, tenants had arrears equivalent to 2.8 to 3.5 weeks of rent at 48 weeks before their UC claim date; this then rose to 4.4 to 5.5 weeks of rent by the claim date. Arrears then initially increased more quickly, peaking between 7.0 to 8.0 weeks of rent around 8 to 12 weeks after the claim date. They then start to decline and by 52 weeks after the claim date they were equivalent to 5.8 to 6.7 weeks.
A year into the UC claim all 3 cohorts fell to approximately 1 week of the rent balance at the UC claim date.
The proportion of tenants that pay their rent in full or overpay (to reduce arrears) declines in the 12 weeks before the UC claim date. From 12 weeks after the claim date, there is a greater proportion of over payers compared to 48 weeks before the claim date, as action is taken to reduce arrears.
The 60% of tenants that never had a Managed Payment to Landlord (MPTL) in place in UC had the lowest rent arrears almost 1 year before their UC claim which then increased and peaked at 3.9 weeks of arrears, before declining to 3.2 weeks a year after the UC claim. For the remaining 40% of tenants, arrears tended to be higher when there was a shorter period between the UC claim date and the introduction of a MPTL.
Tenants with a longer gap between being a Housing Benefit (HB) claimant and making a claim to UC tended to have higher arrears immediately prior to the UC claim; and a higher peak in arrears after they made a UC claim.
Tenants that claimed UC having not been a recipient of a DWP benefit in the two months before the claim date, had higher rent arrears on average than those that previously received a DWP benefit.
On average, tenants with earnings tended to have a similar rent balance before making a UC claim as those with no earnings. Then during their first month on UC, they tended to accrue arrears more slowly than those without earnings. Subsequently arrears declined at a similar pace for those with and without earnings.
1. Introduction
UC was initially introduced in 2013 and was expanded gradually until 2018 as part of the Government’s strategy to reform the system of benefits for working-age claimants. It is now available everywhere in Great Britain. UC replaces the following six benefits and tax credits: Housing Benefit (HB), Income-based Jobseeker’s Allowance (JSA), Income Support, Income-related Employment and Support Allowance (ESA), Child Tax Credit and Working Tax Credit. Unlike its predecessors, UC is calculated and paid on a monthly basis, and requires claimants to have an online UC account to manage their claim.
The data collected covers the period 2014 to early 2019 and while it captures the early period of UC roll out it therefore predates the COVID-19 pandemic, and associated societal changes including job losses, furlough, and changes to benefit rates. The report includes data covering the period of the expansion of UC to UC Full Service.
A number of organisations expressed interest in obtaining more information on the effect of UC on the pattern of rent arrears.
Information on rent arrears is not routinely collected by DWP. The Department only collects information from claimants that is needed to calculate their UC award. So it collects and verifies evidence on the amount of rent, but does not collect the claimant’s rent payment history.[footnote 3]
In order to improve our understanding of rent payments, the DWP and 8 Social Rented Sector (SRS) landlords have carried out a joint project. With measures to preserve individual anonymity, claimants’ UC administrative data were linked to their rent payment records. This information was then used to assess the pattern of rent arrears prior to and after the UC claim. Our key findings of this work are set out in this report.
There are several constraints to the inferences that can be drawn from the report, since:
a. The data was not a fully representative sample of all UC claimants:
-
it is based on a relatively small sample [footnote 4]
- the 8 landlords cover different regions and landlord types, but they are not a statistically representative sample of all SRS landlords
- it did not include any claimants from the Private Rented Sector (PRS)
- we have only included new claimants to UC and claimants who have naturally migrated to UC from a benefit that UC replaces, due to a change in their circumstances. Claimants are not part of the Move to UC pilot which started in July 2019 [footnote 5]
b. Rent data was extracted at different times, because landlords joined the project at different times. Hence each landlord had uniquely timed data extracts - see Table 2.3.
c. UC had a staggered geographic rollout programme which means the volume of claimants on UC is different for each of the 8 landlords - see Table 2.3.
d. There is no counterfactual [footnote 6] group to show what would have happened in a benefit system where UC did not exist - see Section 2.2.
Figure 1.1 shows how the UC caseload has increased over time. The rent account data was taken between May 2018 and February 2019 over which period the SRS caseload, where a payment was in place, increased from 236 thousand to 485 thousand. By August 2021 the SRS caseload was 1.3 million.
Figure 1.1 Increase in Universal Credit caseload over time
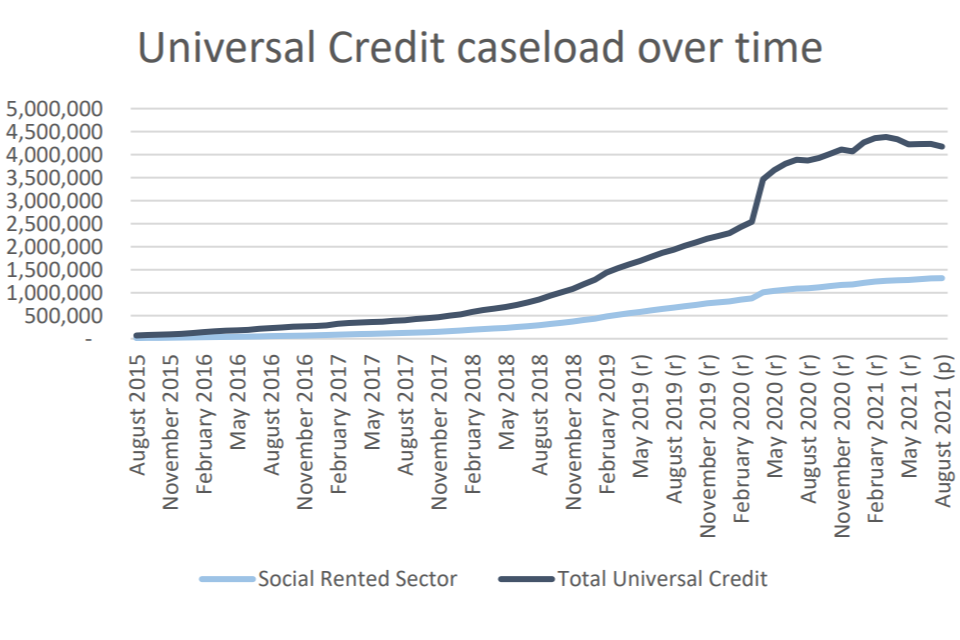
Source: Stat Xplore
1.1 Universal Credit
Universal Credit supports people who are on a low income or out of work and helps to ensure that they are better off in work than on benefits. UC is an integrated, income-related, working-age benefit providing households with a personal allowance topped up by additional components, which recognise the needs of claimants with children, housing costs, disability and health conditions that limit work, and caring responsibilities, and is paid monthly in arrears.
Universal Credit Live Service was initially introduced in 2013 and was expanded gradually. By May 2016 it was available in every local authority in Great Britain. It closed to new claims from 1 January 2018 and closed to existing claimants by March 2019. Full service is the final system that offers UC to the full range of claimant groups which was rolled out nationally by December 2018. New claims are made on GOV.UK with most accounts managed through an online account.
The aim of UC is to tackle the problems of poor work incentives and complexity within the previous system of benefits and tax credits. As published in the Universal Credit Evaluation Framework the overarching aims are to:
-
encourage more people into work and to make even small amounts of work pay and be seen to pay
-
smooth the transition into work by offering a single benefit that removes the distinction between being in and out of work
-
offer a simpler support, with one system replacing multiple systems, therefore reducing administration costs and the propensity for fraud and error
-
tackle poverty both through increased take-up since the system will be simpler and from increased reward from employment for the customer
1.1.1 Help with housing costs under Universal Credit
In most cases UC is a single, monthly payment which is paid directly into the claimant’s bank account and includes all eligible housing costs. This means that claimants are responsible for paying their own rent.
Couples living in the same household usually receive one monthly payment between them which can be paid into a joint account or a single account in either person’s name. Any other adults living in the same household who are claiming UC are paid separately.
When a new claim for UC includes rented housing costs, housing support payments are usually paid as part of a single UC payment. Since April 2018, if HB had ended because of a new UC claim, an additional payment of two weeks’ worth of HB is paid to provide support during the transition to UC. This is known as a Transition to UC Housing Payment.
Alternative payment arrangements (APAs) are available for claimants who may struggle to manage their monthly payments. They are considered on a case by case basis at the start or at any point during a UC claim. The need for an APA can be identified by the claimant, landlord, work coach or case manager.
An APA can be a more frequent payment, a split payment of an award between partners or a MPTL. MPTLs allow direct payment of housing costs to be made to landlords. SRS landlords can request managed payments using the Universal Credit Landlord Portal or the Apply for a Direct Rent Payment (ADRP) online service. The ADRP service is also available to Private Rented Sector landlords.
Rent arrears deductions can be made from a claimant’s UC award if at least two months’ rent arrears have accrued. Rent arrears deductions are only available for the property where the claimant currently resides and are not available for historic arrears from any properties they previously lived in. This deduction safeguards vulnerable claimants who could be at risk of homelessness.
1.1.2 Payment frequency
The payment frequency of HB depends on the type of SRS landlord Table 1.1 shows that for the majority of SRS tenants there are two different HB payment intervals depending on the type of SRS landlord.
Table 1.1 Frequency and destination of Housing Benefit payment
| Social Landlord | Payment frequency | Recipient |
|---|---|---|
| Housing Association | 93% of claimants are paid HB 4 weeks in arrears | Less than 7% of claimants are paid HB directly |
| Local Authorities | 90% of landlords are paid HB in advance on a weekly basis | A negligible proportion of claimants are paid HB directly |
Source: SHBE, November 2019 – all claimants in the SRS (not just the eight landlords)
Before the introduction of UC, there were a little over 2 million HB working-age claimants in the SRS with around 60% in Housing Associations (HA) and 40% in Local Authority (LA) accommodation including Arm’s-Length Management Organisations (ALMOs). ALMOs provide housing services on behalf of Local Authorities.
1.1.3 Changes to housing support under UC
The period covered by this report includes data from 2014 until February 2019 for the latest extract, which pre-dates some important changes. There have been a number of changes to the UC housing process over the period including Trusted Partner status for landlords, the development of the Landlord Portal, and the streamlining of rent verification processes as summarised in Table 1.2.
Table 1.2 UC Housing processes
| a. Introduced Trusted Partner status | March 2017 |
|---|---|
| b. Introduced Landlord Portal | March 2017 |
| c. Changes to the rent verification processes | March 2017 |
| d. Removal of 7-day waiting period | February 2018 |
| e. Two-week Transition to UC Housing Payment | April 2018 |
| f. Enhancements to the UC monthly statements | November 2019 |
1.1.4 Benefit uprating and other policy changes
This report looks at the rent balances of UC claimants since early 2014. Alongside general economic and social factors that affect a claimant’s financial position, policy changes during this period include:
-
most working-age benefits and tax credit elements were subject to a four-year freeze, covering the period 2016/17 to 2019/20 which ended in April 2020. This followed a three-year period (2013/14-2015/16) when increases were limited to 1 per cent. The four-year freeze was announced in the 2015 Summer Budget and legislated for by the Welfare Reform and Work Act 2016. This freeze covered the various allowances, premiums and Local Housing Allowance (LHA) rates (for claimants renting in the PRS) for HB claimants and the UC equivalents.
-
The Welfare Reform and Work Act (2016) also introduced rules around the levels of rent charged by registered providers of social housing (Local Authorities and Housing Associations) in England from 1 April 2016. This required registered providers to reduce the majority of social rents by 1 per cent per annum over four years. A maximum rent was set for new tenancies, up to the social rent rate defined in the Act. Exemptions from the social rent reduction rules were also provided for certain types of providers such as those designated as specialised supported housing or temporary social housing. In addition, different rent setting policies were applied in Scotland and Wales.
-
benefit cap reduction – the benefit cap is a limit on the total amount of income from certain benefits that a household can receive. This limit was reduced in November 2016 and tiered according to whether a claimant lives within Greater London or elsewhere.
1.2 Causes of changes in rent balances
“Rent balance” is defined in relation to a tenant’s rent account. A tenant in arrears, due to a build-up of rent that is owed to the landlord, is defined as having a positive rent balance; a tenant with a surplus on their rent account is defined as having a negative rent balance. There are a number of possible specific causes of rent arrears in UC, which themselves are influenced by underlying factors outside the scope of this report. For instance, specific causes may include:
a. Previously accrued arrears
Claimants may have accrued arrears before the start of their UC claim - see Section 3.1.
b. A one-off switch in benefit payment frequency
SRS landlords charge rents on a weekly basis. The payment interval of housing support differs between HB and UC and partly depends upon the type of SRS landlord. This can lead to a one-off contribution to rent arrears when moving from HB to UC also known as book arrears - see Section 3.3.3.
c. Delays in UC payment
In April 2020, the provisional figures from Stat-Xplore showed that around 95% of SRS tenants who are new UC claimants with the housing element receive their payments on time with another 3% receiving some payment on time[footnote 7]. For the claimants that experienced a delay in the payment of housing costs, this may contribute to their non-payment of rent. These delays may be caused in processing by DWP, but could also be because the recipient has not submitted the correct information on time. Payment timeliness has generally improved during the period that the rent balance data was collected from landlords.
d. Short term accumulation of arrears
UC is paid monthly in arrears; claimants may accrue rent arrears if their rent accounts are debited weekly. This will result in a monthly ‘saw-tooth’ pattern of gradually accumulating arrears and then decline due to a rent payment. These arrears should be short term in nature if the recipient pays their rent on receipt of their UC payment - see Section 3.3.3.
e. Claimant non-payment or delayed payment
Arrears may accrue where a tenant on UC does not pay all of their rent or does not pay their rent on time.
The linked rent and benefit administration dataset we have created does not allow us to isolate the relative size of all of these factors. However, it does allow us to estimate the size of arrears prior to the UC award and gives an indication of the impact of short-term arrears due to changes in payment timings.
1.3 Key research questions
To quantify and understand how a tenant’s rent balance changes as they move on to UC, the report will answer the following questions:
1. What is the rent balance pattern before and after the UC claim?
To help understand the trends in rent balances we break the analysis down by landlord and by different cohorts, which we track over the period before and after the UC claim date.
2. How are rent arrears patterns affected by specific factors?
To help understand the possible impact of UC on a tenant’s rent balance, we show time series broken down by whether a tenant:
- was previously a HB claimant
- had earnings when they made their UC claim
- had their rent paid by a Managed Payment to their Landlord (MPTL)
1.4 Qualitative report
Tenants’ perspectives are captured in a separate qualitative report see Section 3.2 of Universal Credit and the patterns of rent balances in the Social Rented Sector: Social Research.
The report Universal Credit and the patterns of rent balances in the Social Rented Sector: Social Research explores the experiences of UC and the perspective of tenants in managing their rent payments. It is based on 42 in-depth telephone interviews that were conducted with tenants of 7 of the landlords participating in the rent balances research and with one landlord focus group. The aims of this strand of research were to explore:
- Why are tenants already in arrears and / or why do they go into arrears when they claim?
- Why do tenants delay making their claim, what are the consequences and how do they support themselves?
- What are tenant’s understanding of UC?
- What additional support is needed to prevent tenants from getting into arrears?
The interviews were conducted in two stages, with the first taking place between April and June 2019, and the second taking place between November 2019 and January 2020.
Participants were recruited based on an agreed sampling frame. A full outline of the achieved quotas is in the qualitative report.
Data Protection and confidentiality
Data matching was carried out in accordance with the General Data Protection Regulation (GDPR).
The DWP staff who carried out the analysis had access only to anonymised DWP, HMRC and landlord data. Landlord and DWP data was shared under Data Sharing Agreements and was used solely for analytical purposes.
2. Methodology
This chapter details the method that was used to combine rent records with administrative data.
The SRS landlords
Eight SRS landlords took part in this project based across 6 regions in England and Wales:
- 5 Housing Associations (HAs)
- 1 Local Authority (LA)
- 2 Arm’s-Length Management Organisations (ALMO)
Table 2.1 below lists the 8 landlords and shows the number of properties managed ranged from 9,000 to 64,000. At the time of the data extracts, the number of UC claimants who were renting from each landlord was between 800 and 5,000. Taken together these SRS tenants represented around 3% of all UC SRS households in Great Britain in February 2019[footnote 8].
Table 2.1: The landlords sharing their rent data
| Landlord | Type | Region | Properties | First UCFS Rollout date |
|---|---|---|---|---|
| Curo | HA | South West | 13,000 | May 2016 |
| Dudley MBC | LA | West Midlands | 27,250 | July 2017 |
| GreenSquare Group[footnote 9] | HA | South West | 12,000 | May 2017 |
| Notting Hill Genesis | HA | London & South East | 64,000 | November 2015 |
| Northwards Housing | ALMO[footnote 10] | North West | 13,000 | October 2017 |
| Tai Tarian | HA | Wales | 9,000 | October 2017 |
| Together Housing | HA | North West | 38,000 | June 2016 |
| Your Homes Newcastle | ALMO | North East | 26,700 | May 2016 |
2.2 The tenant dataset
2.2.1 Constructing the dataset
We constructed a tenant dataset from the 8 landlords’ rent payment data. Using measures to preserve anonymity, each tenant’s rent records were linked with their DWP administrative UC and if there was no match the record was excluded. The administrative datasets are listed in Annex A.
There was one data extract from each participating landlord.
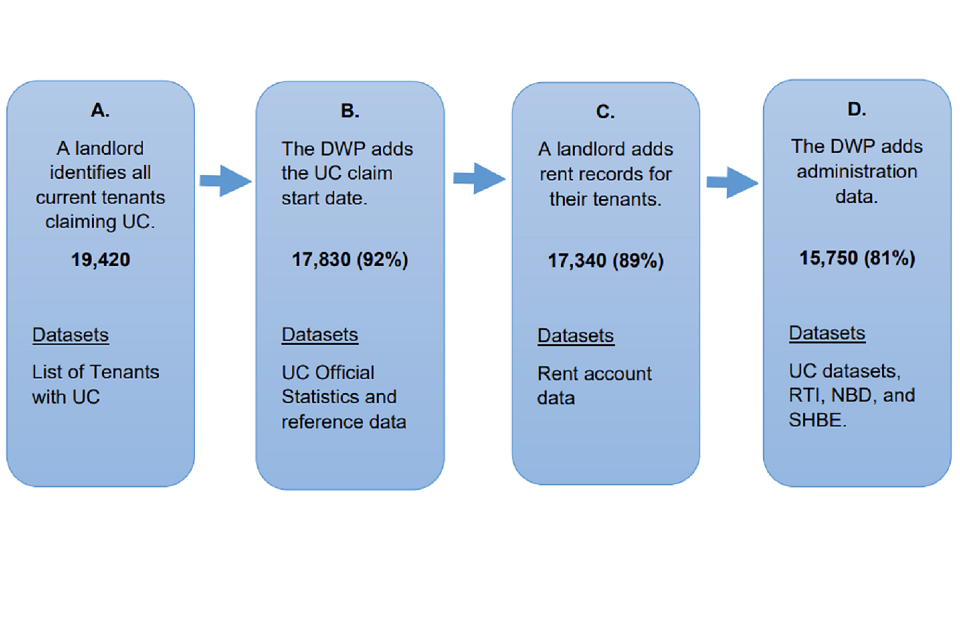
Figure 2.1 shows the data flow during the compilation process:
a. The landlords identified 19,420 current tenants with a known UC claim at the time of their extracts.
b. Of these, 17,830 (92% of 19,420) could be linked to the DWP administrative data by their National Insurance umber (NINo) to identify the exact date of the UC claim. Unmatched records were due to missing NINos.
c. The landlords then returned the rent account data for 17,340 (89% of 19,420) of those tenants.
d. Any rent records that did not have a UC payment for each month since their initial UC claim were removed reducing the dataset to 15,750 (81% of 19,420) tenants. We used tenants who had a full set of corresponding benefit awards. This was the maximum number of tenants available for analysis.
Figure 2.1: Dataset construction
2.2.2 Ensuring robust comparison
For longitudinal analysis, we segmented tenants into successive cohorts based on the financial year they made their UC claim, as shown in Table 2.2 below.
| Cohort | Start date | End date |
|---|---|---|
| 1 | 1 April 2014 | 31 March 2015 |
| 2 | 1 April 2015 | 31 March 2016 |
| 3 | 1 April 2016 | 31 March 2017 |
| 4 | 1 April 2017 | 31 March 2018 |
| 5 | 1 April 2018 | 31 March 2019 |
Figure 2.2 shows the breakdown of the claims by whether they were Universal Credit Live Service (UCLS), or Universal Credit Full Service (UCFS) and which cohort they belong.
To control the composition of the dataset for analysis, we only used results for tenants with a full set of weekly records during a period of analysis either side of their UC claim date.
In choosing the length of the period of analysis, we have aimed to ensure that this:
a. does not bias results by including tenants that join a cohort late, or leave early.
b. is long enough to highlight the key features and trends of the observed pattern of rent balances
c. is short enough to avoid being unduly influenced by extraneous factors
As a result, we chose periods with a varying number of weeks before and after the UC claim. For example, in Figure 3.8 the dataset includes 10,750 tenants with rent records a minimum of 17 weeks before and after the UC claim.
Figure 2.2 – Claim date for all tenants by whether UCLS or UCFS
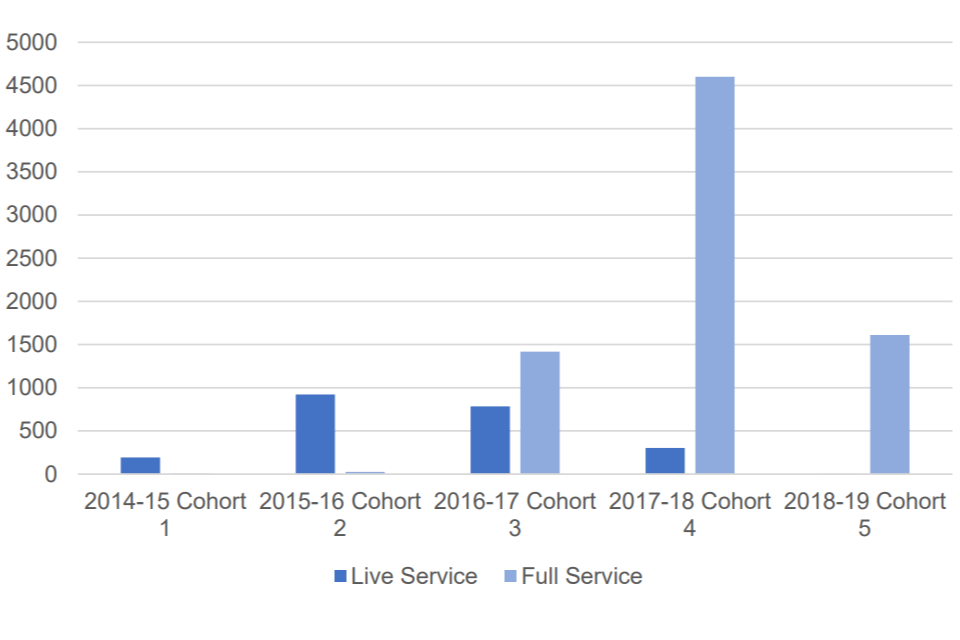
The earliest UC records within the dataset are from early 2014 when new claims were exclusively UCLS but volumes were small. From 2016 onwards, UCFS started to roll-out. The staggered UCFS rollout schedule means the length of time we can track UCFS claims varies between landlords. Table 2.3 lists the rollout date and data extract date by landlord.
Table 2.3: Key dates by landlord
| Landlord | Date of first UCFS rollout to a local JCP | Data up until |
|---|---|---|
| Curo | May 2016 | May 2018 |
| Dudley MBC | July 2017 | January 2019 |
| GreenSquare Group | May 2017 | October 2018 |
| Northwards Group | October 2017 | October 2018 |
| Notting Hill Genesis | November 2015 | October 2018 |
| Tai Tarian | October 2017 | July 2018 |
| Together Housing | June 2016 | November 2018 |
| Your Homes Newcastle | May 2016 | January 2019 |
For example, the majority of Tai Tarian tenants were on UCFS for a maximum of 8 months when the data was extracted; whereas a greater number of Dudley MBC tenants claimed UC for much longer periods. To capture tenants from all landlords, we needed to choose a relatively narrow tracking period before and after a UC claim date.
Tenant numbers per cohort vary between landlords. For example, a landlord may initially have low numbers of tenants claiming UCLS which are boosted when UCFS is rolled out in their area.
Table 2.4 shows the tenant numbers across all cohorts and landlords. To be included in the table, tenants needed to have complete records from 17 weeks before their UC claim date until 17 weeks afterwards.
Table 2.4: Number of tenants per cohort
| Landlord | 2014/15 (partial year) | 2015/16 | 2016/17 | 2017/18 (partial year) | 2018/19 | Total |
|---|---|---|---|---|---|---|
| L1 | 0 | 30 | 30 | 320 | 0 | 39 |
| L2 | 80 | 200 | 160 | 200 | 70 | 710 |
| L3 | 80 | 370 | 340 | 900 | 510 | 2,200 |
| L4 | 20 | 70 | 310 | 410 | 120 | 930 |
| L5 | 0 | 160 | 890 | 1,770 | 170 | 3,000 |
| L6 | 0 | 120 | 130 | 1,060 | 660 | 1,970 |
| L7 | 0 | 30 | 70 | 420 | 140 | 650 |
| L8 | 60 | 80 | 520 | 270 | 0 | 920 |
| Total | 240 | 1,060 | 2,450 | 5,350 | 1,670 | 10,750 |
The variation in tenant numbers across cohorts precludes the use of producing results on rent balances as a mean average of tenants across the dataset. It also prevents the use of a weighted average as the composition of the dataset is not stable across all cohorts. This approach provides a balanced picture across landlords and reduces the risk that trends simply reflect shifts in the composition of landlords over time.
So instead we have taken a two-step approach to the production of headline results:
- we have taken averages of rent balances for the 8 individual landlords, and
- we have then taken the simple (unweighted) average of these landlord averages
See Annex B for further explanation.
2.3 Relative Rent Balance[footnote 12]
There are variations in the average rent charged across the 8 landlords. For example, rents in London are higher than elsewhere in England and Wales. To ensure that we have a consistent comparative measure we have not used the cash value of tenant’s rent, but the relative rent balance. We have defined this as a multiple of a tenant’s current weekly rent for that week. So for example:
- a relative rent balance of 1 means that a tenant currently has exactly one week’s worth of rent outstanding on their rent account
- a relative rent balance of 0 means that a tenant has no rent outstanding and no credit on their rent account
- a relative rent balance of minus one (-1) means that a tenant is currently in credit on their rent account by one week’s rent
This approach puts the rent balance on a similar footing for all landlords irrespective of differing property sizes and locations. For example, we can compare the following properties:
- a 1-bedroom flat in a city location with a rent of £100 per week with a tenant who has arrears of £500 produces a positive relative rent balance of +5. It is positive since they are in arrears
- a 2-bedroom house in a non-city location with rent £115 per week with tenants who are in credit by £575 produces a negative relative rent balance of -5. It is negative since they are in credit
In parts of the report we have presented rent balance charts using a 4-week moving average in order to identify the main trends. This helps smooth out the saw-tooth pattern of arrears explained further in Section 3.3.3.
2.4 Presentation of results
As mentioned above, headline results are produced in terms of average figures across the 8 landlords.
The 2 key measures used in this publication are:
1. Mean average rent balance:
(i) a single point-in-time measurement taken in one rent week, for example, at the UC claim date
(ii) multiple point-in-time measurements or trends of tenants who rent continuously during a defined period
These measurements were taken for specific sub-groups, such as HB and non-HB claimants, individual landlords and different UC payment methods.
2. Mean average of landlord averages – an average of landlord averages for annual cohorts
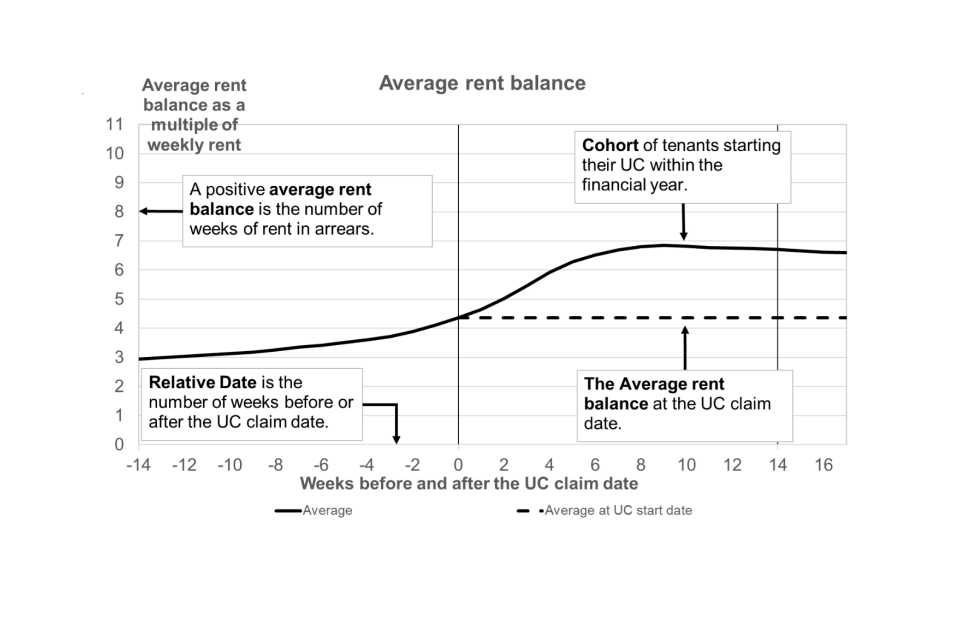
Figure 2.3 provides an explanation of the rent balance charts used in this report for an illustrative cohort.
Figure 2.3 - Chart definitions
3. Results
This chapter provides a summary which focuses on:
- how the rent balance varies at different points during a UC claim
- how often a tenant makes a rent payment
- what proportion of rents are paid by a tenant
- rent balance trends across landlords and cohorts
- rent balance split by whether a tenant had:
- a Managed Payment to Landlord
- claimed HB before UC
- claimed a non-housing benefit
- earnings at the claim start
3.1 The balance at the UC claim date
The average value of all rent balances will be affected by those in credit and those with larger rent arrears.
Figure 3.1 shows the frequency distribution of the relative rent balance measured at the UC claim date and indicates the 3 different types of average:
- the most frequent interval (the mode) was for tenants to have between 0 and 1 weeks of arrears
- the mid-point of the dataset distribution (the median) was 2.6 weeks of arrears
- the average level of arrears (the mean) was 5.0 weeks
The differences between the mode, median and mean indicate that the dataset is skewed, in this case towards tenants with higher rent arrears.
Figure 3.1: The distribution of rent balance at the time of the Universal Credit claim [footnote 13]
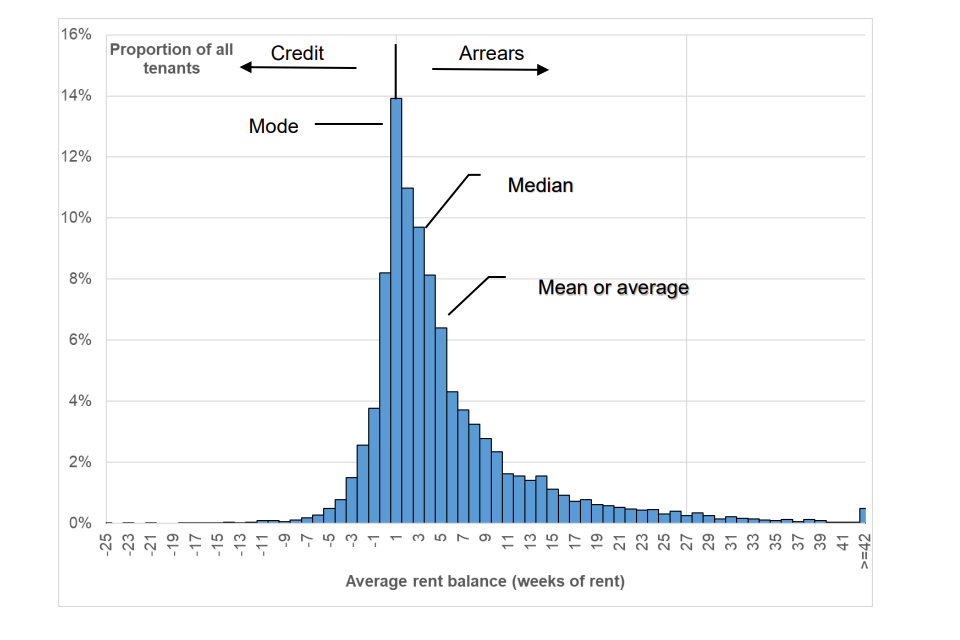
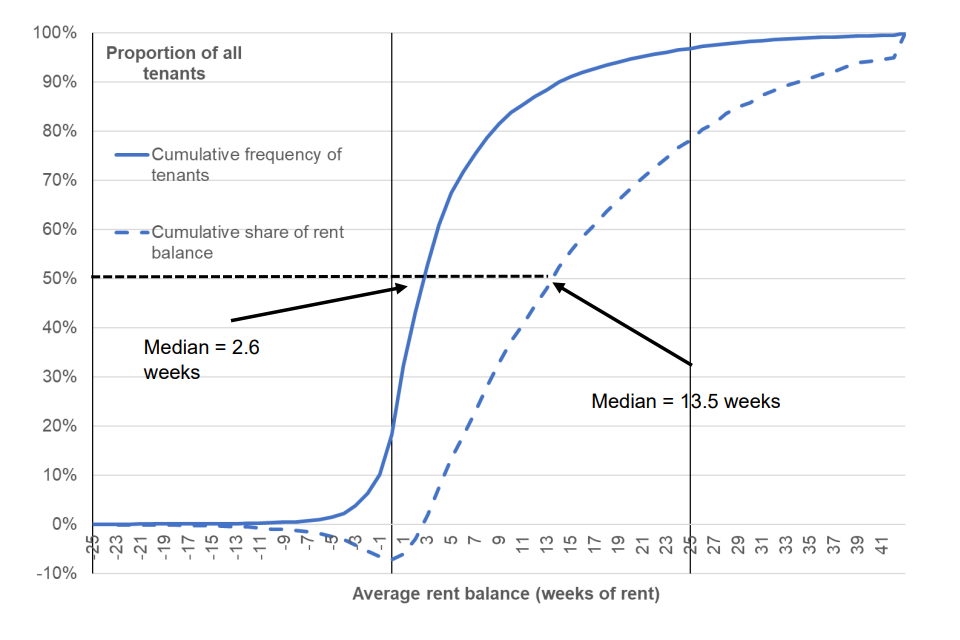
Figure 3.2 shows two curves in relation to the UC claim date.
a. the cumulative frequency of tenants (solid line) shows the cumulative percentage of tenants on the y-axis for a given rent balance on the x-axis b1. the cumulative share of rent balance (dashed line) shows the cumulative share of total rent balance on the y-axis for a given rent balance on the x-axis
The median of the cumulative frequency of tenants is 2.6 weeks from Figure 3.1 hence 50% of the sample have a rent balance below this, and 50% above. The median of total rent arrears is 13.4 weeks meaning that 50% of total arrears are below 13.4 weeks, and 50% of arrears are above.
- this shows that although the number of tenants with high levels of rent arrears is small, their contribution to a landlord’s total arrears is disproportionately large
- for example, tenants with 42 weeks or more of rent arrears represents 0.5% of all tenants and 5% of all rent balances in cash terms
Figure 3.2: The cumulative frequency of tenants and their contribution to the total relative rent balance at UC claim date
Rent payment amounts
This section looks at whether a tenant pays their rent charge in full, or has overpaid or underpaid in any given period.
The analysis uses tenants with continuous rent records from almost a year before their UC claim to a year afterwards which reduces the sample to 9,690 tenants. The two charts split these between whether they live in:
- Housing Association properties – 4,560 tenants
- Local Authority/ALMO – 5,140 tenants
In Figure 3.3 the trend for HA tenants are:
-
from 12 to 48 weeks before the UC claim date there is a stable pattern; almost three-quarters of tenants paid all their rent; around 10% overpaid and 16% underpaid
-
the pattern shifts in the 12 weeks immediately before a UC claim is made; those underpaying approximately doubled to 30%, largely because of a reduction in those that pay their rent exactly
-
in the 12 weeks after the UC claim there are more under payers, 46%, than those paying the exact amount, 42%
-
12-24 weeks after the UC claim there is a sharp reduction in tenant’s underpaying, though it does not reduce to levels seen before the UC claim. Payments are broadly stable between 12 to 48 weeks after the UC claim
Figure 3.3: Payment compliance of Housing Association tenants before and after their UC claim
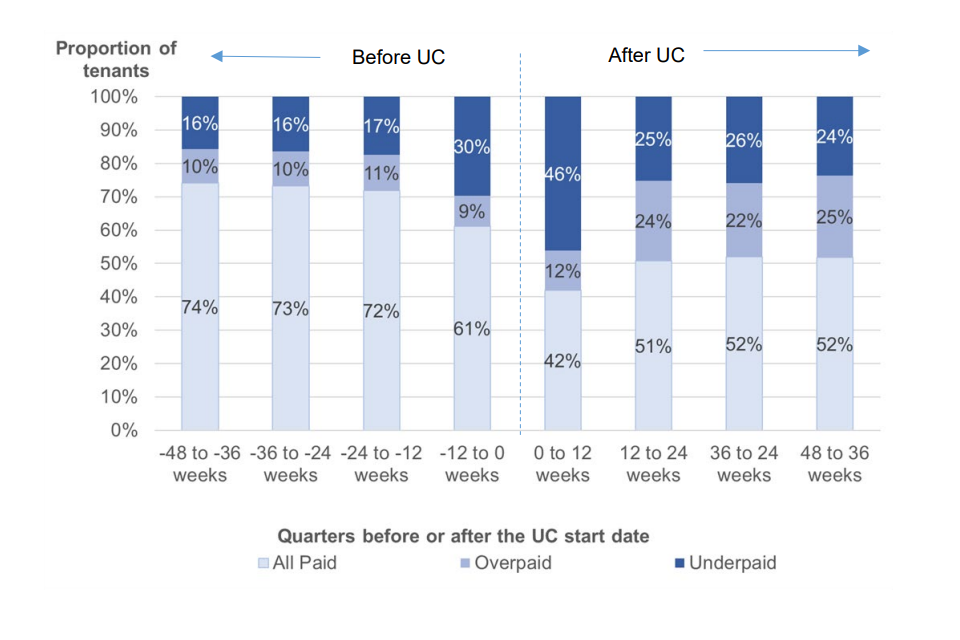
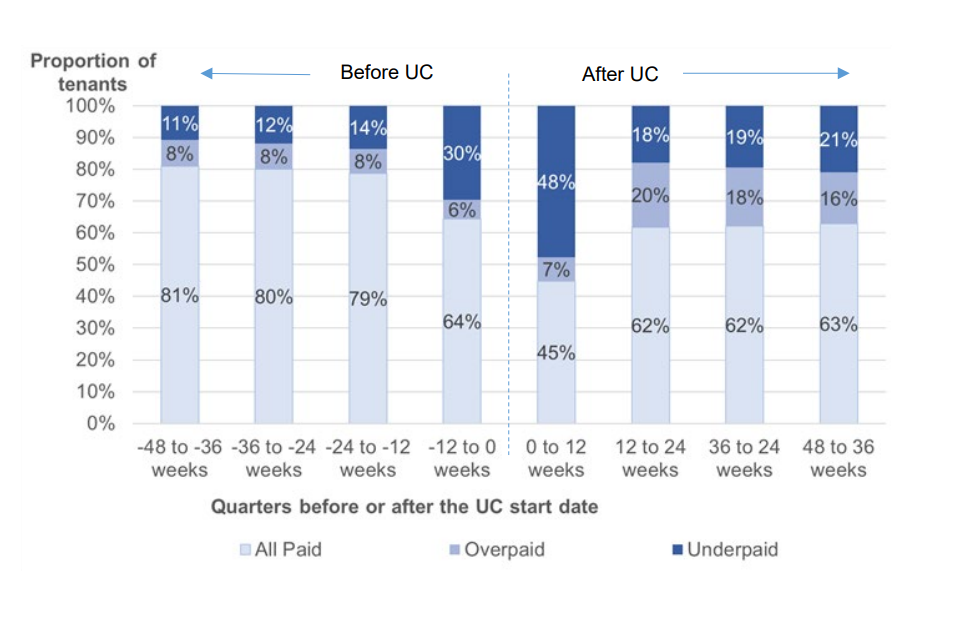
Figure 3.4 shows that LA/ALMO tenants that pay or overpay their rent represent a larger proportion throughout the period compared to HA tenants. Both housing types show an increase in underpayments immediately before and after the UC claim, which stabilises at a higher level than that observed 12 to 48 weeks before the UC claim.
Figure 3.4: Payment compliance of Local Authority and ALMO tenants before and after their UC claim
3.3 Rent balance trend
In this section we present the weekly trends of the relative rent balance in the period leading up to a tenant’s UC claim date and then after their claim.
3.3.1 Trends across cohorts
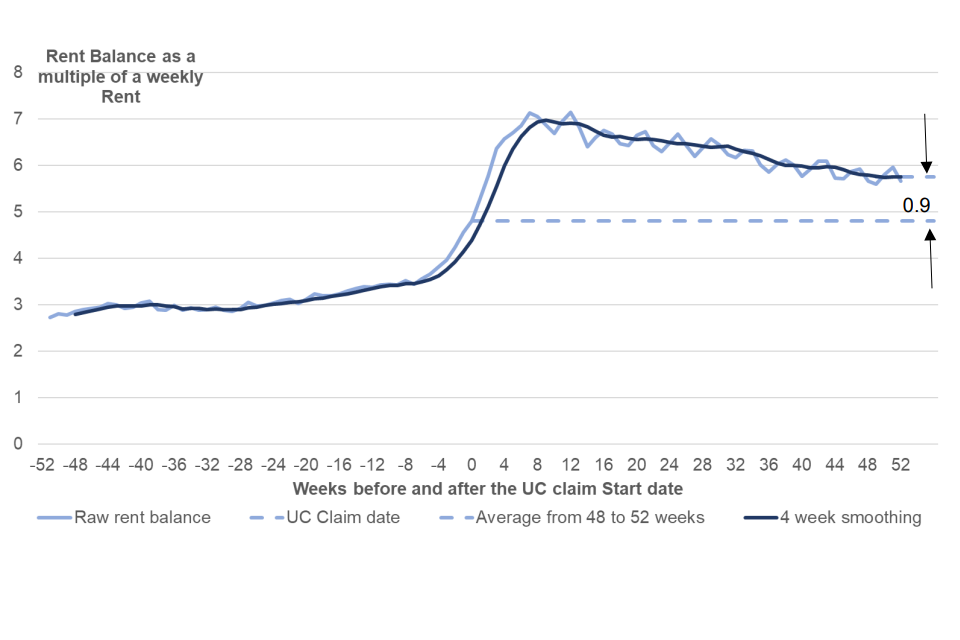
Figure 3.5, Figure 3.6 and Figure 3.7 present time series for 6 landlords. Two landlords were not included in the analysis as they had insufficient tenants claiming continuously for a year before and after their UC claim. For the remaining landlords the charts show that:
-
the raw data has a cyclical pattern due to rent being charged weekly, while UC is paid every month. The data has been smoothed using a 4-weekly average so it is easier to interpret
-
the 4 week moving average rent balance at the UC claim date shows a broadly similar trend across all 3 cohorts
-
rent balances before UC: later cohorts tend to have a lower rent balance
-
after the UC claim: for successive cohorts the average rent balance peaks at a lower level and remains lower in any week of the UC claim
-
all 3 cohorts show that after one year the rent balance reduced to within 1 week of the arrears observed at the UC claim
-
on average, tenants had arrears equivalent to 2.8 to 3.5 weeks of rent at 48 weeks before their UC claim date; this then rose to 4.4 to 5.5 weeks of rent by the claim date. Arrears then initially increased more quickly, peaking between 7.0 to 8.0 weeks of rent around 8 to 12 weeks after the claim date. They then start to decline and by 52 weeks after the claim date they were equivalent to 5.8 to 6.7 weeks
Figure 3.5: 2015/16 rent balance [footnote 14] for six landlords
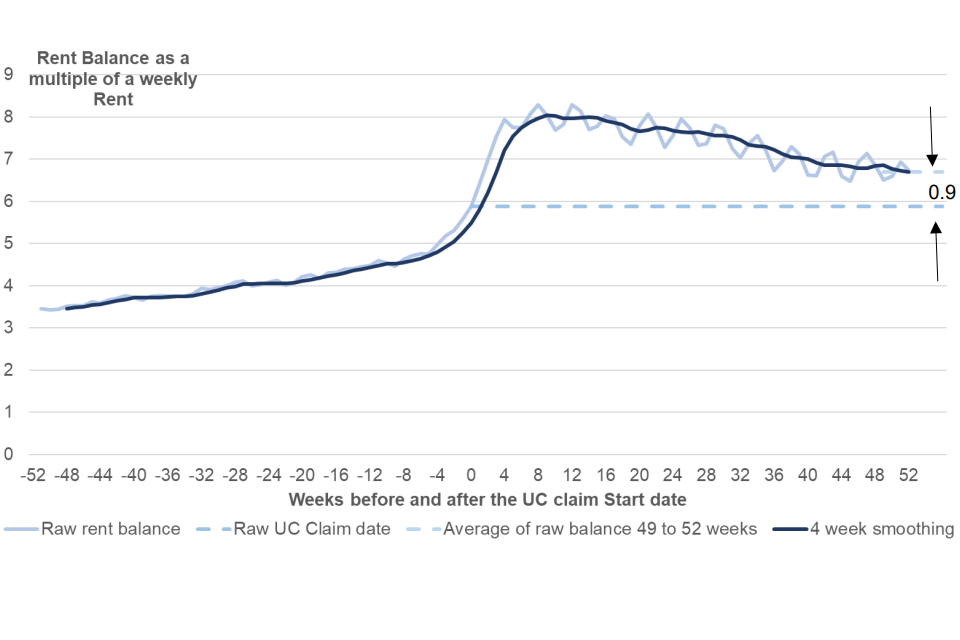
Figure 3.6: 2016/17 rent balance [footnote 15] for six landlords
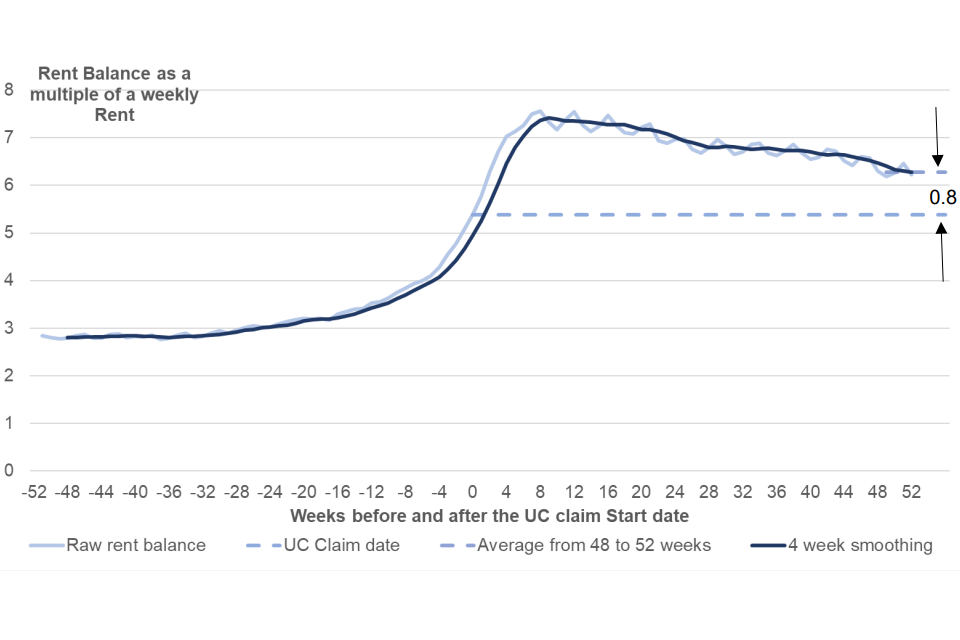
Figure 3.7: 2017/18 rent balance[footnote 16] for six landlords
Trends for all landlords over three cohorts are shown in Annex B.
3.3.2Trend across landlords
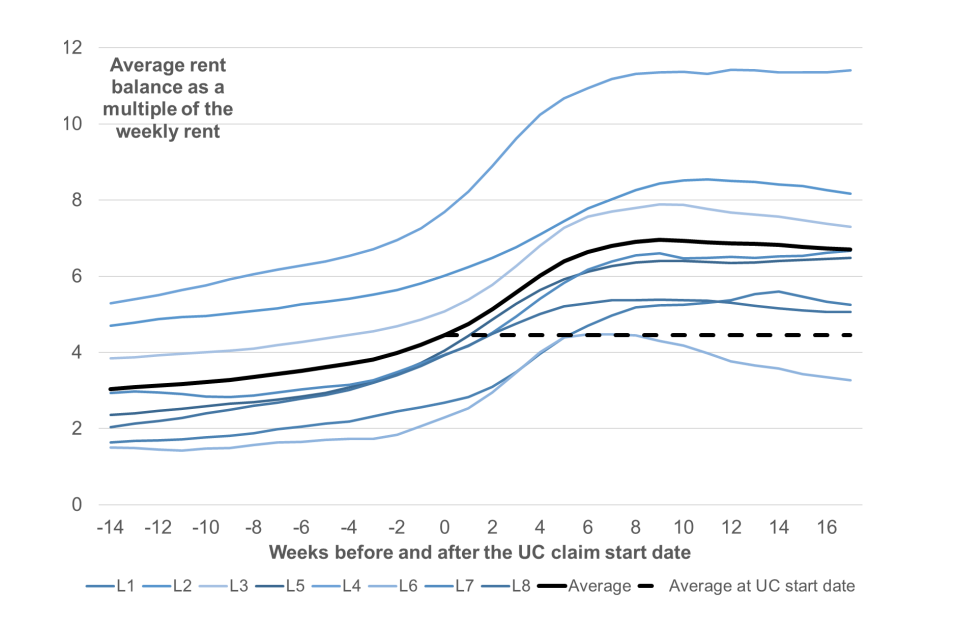
Figure 3.8 shows a single representative annual cohort for tenants with a UC claim date in the financial year 2016/17. It illustrates the similarity of trends in average tenants’ rent balance before and after a UC claim across all 8 landlords.
Across the 8 landlords the amount of data we have after the UC claim varies. The choice of 17 weeks before and after in Figure 3.8 ensures all 8 landlords are captured.
The solid black line represents the average across the landlords. The dashed line indicates the level of pre-existing arrears at the UC claim date. It shows:
- tenants had an average of 3.0 weeks of arrears around 14 weeks before their UC claim
- arrears have broadly flattened off 9 weeks after the UC claim, although some landlords have started to trend downwards. After 17 weeks, arrears are at 6.6 weeks of rent, a reduction of 0.2 weeks from the peak
- the arrears trend is broadly consistent across cohorts and landlords
Figure 3-8: Average rent balance for 8 landlords who had tenants with a UC claim date during 2016/17[footnote 17][footnote 18]
3.3.3 One-off and short-term arrears
Here, we explain the existence of a step change that exists in the rent balance trend charts.
We look at the change in rent balances that occur when a tenant moves on to UC. If rent charges are unchanged between HB and UC, but payments vary then there are two types of arrears:
-
A one-off switch in benefit payment frequency this arises with a migration from HB to UC as the new benefit is paid monthly in arrears, 1 week after the end of each month compared to weekly or four weekly under HB.
-
Short term fluctuating arrears may occur when rent is charged more frequently than the housing support payment. For example, rent is charged weekly while payments are often 4-weekly for HB, or monthly for UC.
To highlight these effects, we use an illustrative example of a tenant in arrears who pays their rent in full when their housing support is paid. We show this separately for LA/ALMO and HA tenants due to the different periodicity of HB payments.
This example is a simplification, as it does not take account of the range of tenant behaviour including tenants applying to UC later than needed and any changes in the rent payment amount or its regularity but it is illustrative of impact of changing payment periods.
Example 1: A tenant was not in arrears and has rent charges of £100 per week and HB payments of £100 per week. Upon receiving UC, their rent charges remain the same and they remain compliant. Total annual UC housing support is the same as HB across the year, but paid as £433.33 every month. The tenant pays their rent when they receive their UC payment, 1 week after their first month on UC and monthly thereafter.
Local Authorities/ALMOs
Under HB there are circumstances where short term arrears do not occur. For example, LAs and ALMOs charge rent weekly on a Monday which coincides with the payment of the HB award and so immediately offsets the rent charge.
Figure 3.9 illustrates the changes in the net rent balance when the tenant in example 1 moves from HB to UC. It assumes zero arrears under HB. The estimated step change occurs when the tenant moves on to UC, which leads to an approximate 2.5 weeks increase in their rent balance. Tenants in receipt of HB with a UC claim date after April 2018 will have received a further payment due to the Transition to UC payment. The moving average is not flat as in each month there are 4 or 5 weeks of charges while housing support delivered through UC is fixed at payments of 4.33 weeks. Actual rent balance has a saw-tooth effect up to 1.7 weeks around the moving average.
Figure 3.9: Simple LA/ALMO tenant moving HB to UC
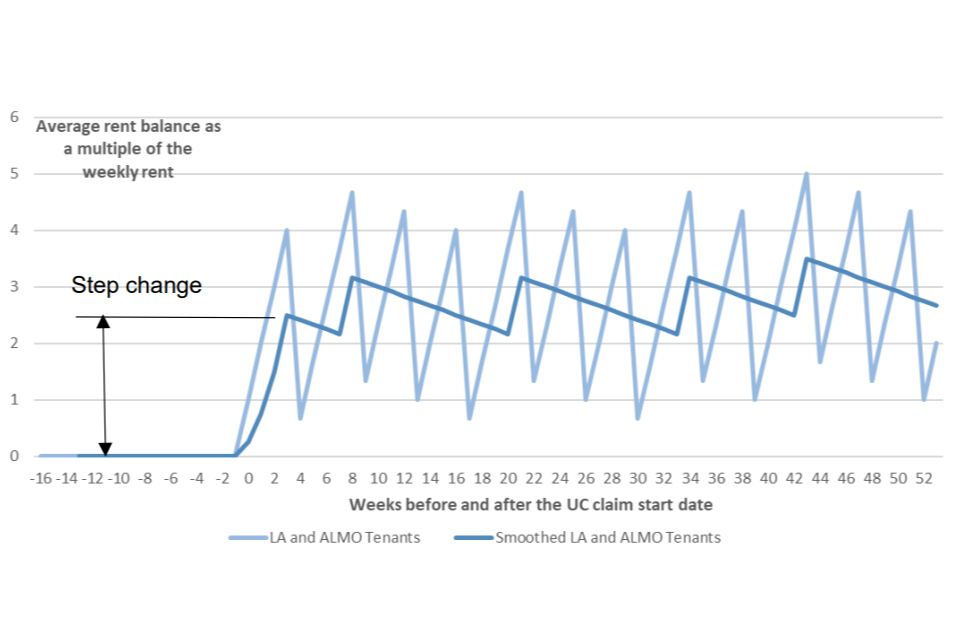
Figure 3.10 shows the distribution of the average payment interval for LA/ALMO tenants with data for the 6-month period before and after a UC claim. Almost 60% of pre-UC rent payments are weekly with the majority of other payment intervals being 2 or 4-weekly. After moving on to UC, there was an almost 50 percentage point reduction in tenants paying weekly.
Figure 3.10: Distribution of the average payment interval for all LA/ALMO tenants
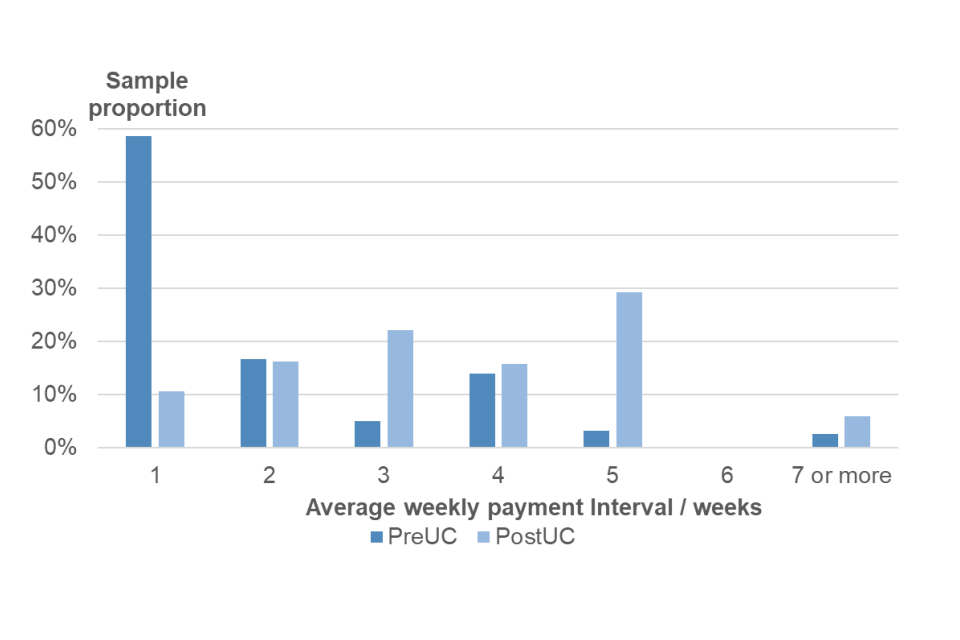
The LA/ALMO tenants have payment intervals of up to 27 weeks of rent. The average payment interval for tenants before their claim is 2.0 weeks, and around 3.6 weeks afterwards which is an increase of 1.6 weeks. This is likely to lead to an increase in average rent balance.
Housing Associations
Figure 3.11 shows an equivalent example to Figure 3-9 but for a Housing Association tenant. The example shows a tenant with zero arrears, who is initially paying their weekly rent charge aligned with their 4-weekly HB payment. When they move on to UC, there is a 1-week step change due to the one-off change in payment frequency. Tenants in receipt of HB with a claim date after April 2018 will have received a further payment due to the Transition to UC payment. The incremental impact on the rent balance is smaller than it is for LAs because the change in frequency of benefit payment is smaller. The fluctuation of the rent balance around the moving average is also up to +/- 1.7 weeks.
Figure 3.11: Simple HA tenant moving from HB to UC
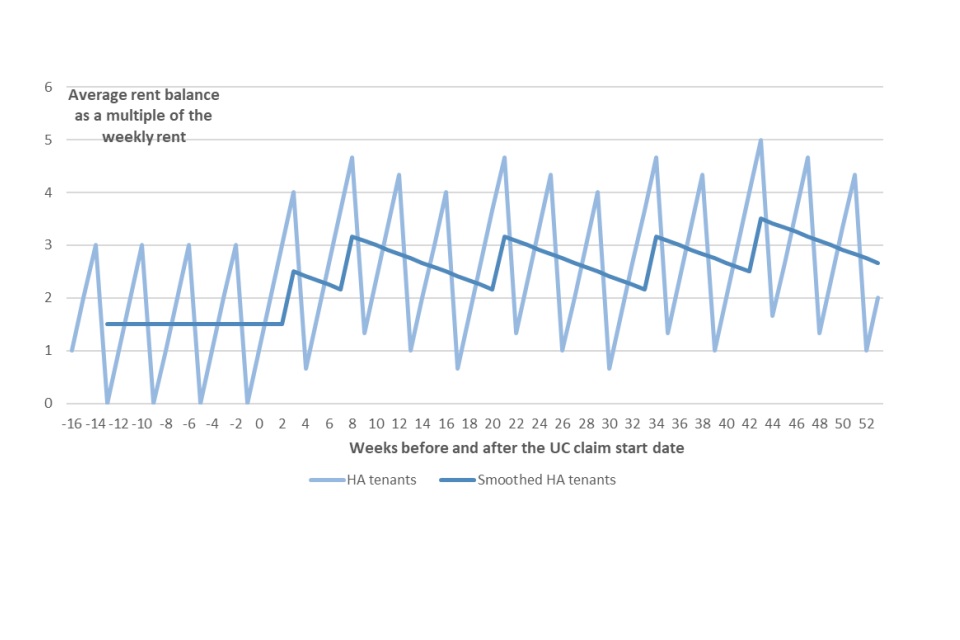
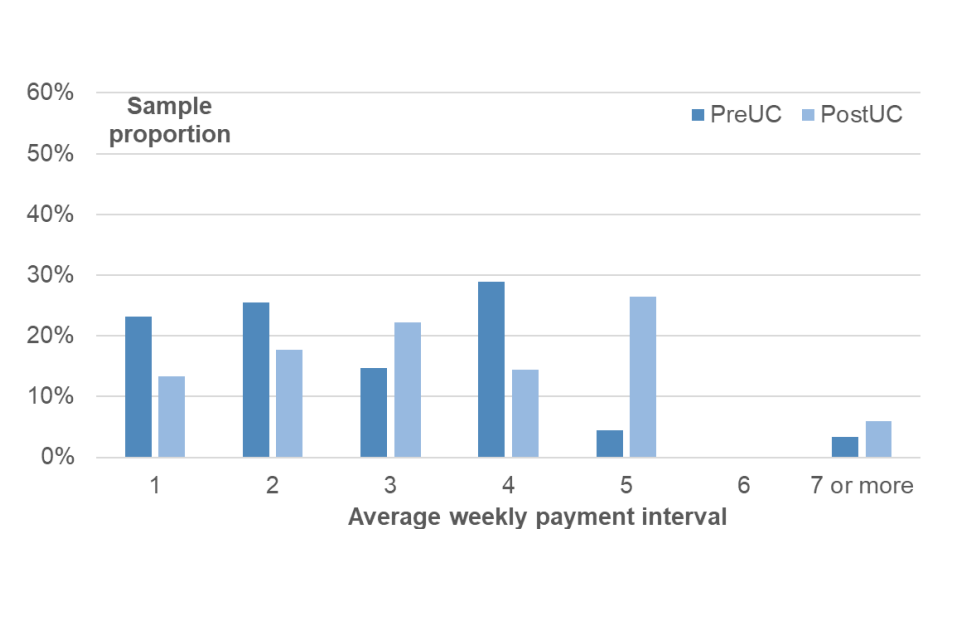
Figure 3.12 shows the distribution of the average payment interval for HA tenants in the 6 months before and after their UC claim. The chart shows that ‘pre-UC’ payment intervals mostly ranged from 1 to 4 weeks which accounted for almost all of HA tenants.
Before UC the average payment period was 2.8 weeks. This increased by 0.6 weeks to 3.4 weeks in the post UC period.
Figure 3.12: Distribution of the average payment interval for all Housing Association tenants
3.4 Usage of Managed Payments to Landlords
Landlords and tenants may request a payment of the UC housing element directly from DWP using a MPTL; which is a form of Alternative Payment Arrangement (APA)[footnote 19]. It is possible for landlords to request the full housing element even when its value has been tapered away in the UC award calculation.
An MPTL is typically activated when either there are 2 or more months of arrears due, or that a tenant has underpaid their rent over the last 2 months, or that they are vulnerable as defined by tier 1 and 2 factors[footnote 20].
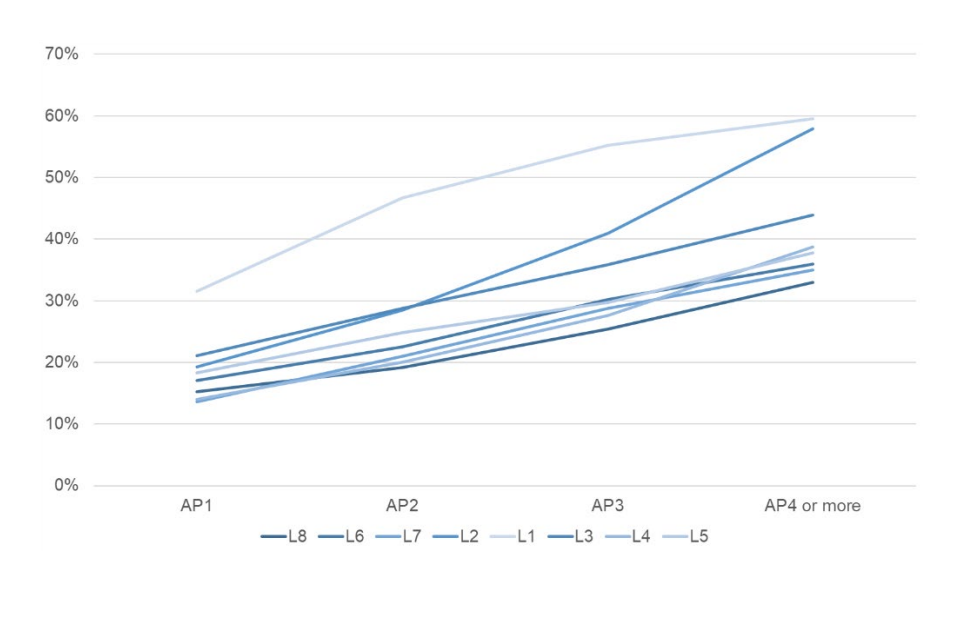
Figure 3-13 looks at the cumulative introduction of MPTLs for tenants who have rented at least continuously 6 months before and after their UC claim. There are two landlord groups based on their MPTL usage after 4 months or more:
-
group 1 – Introduced MPTLs more quickly than other landlords resulting in around 60% of their UC tenants having one
-
group 2 – A lower proportion of tenants receive an MPTL, roughly 30-45% of UC tenants and they are brought into use more slowly
Figure 3.13: Cumulative MPTL usage across all landlords[footnote 21]
Tenants by MPTL status
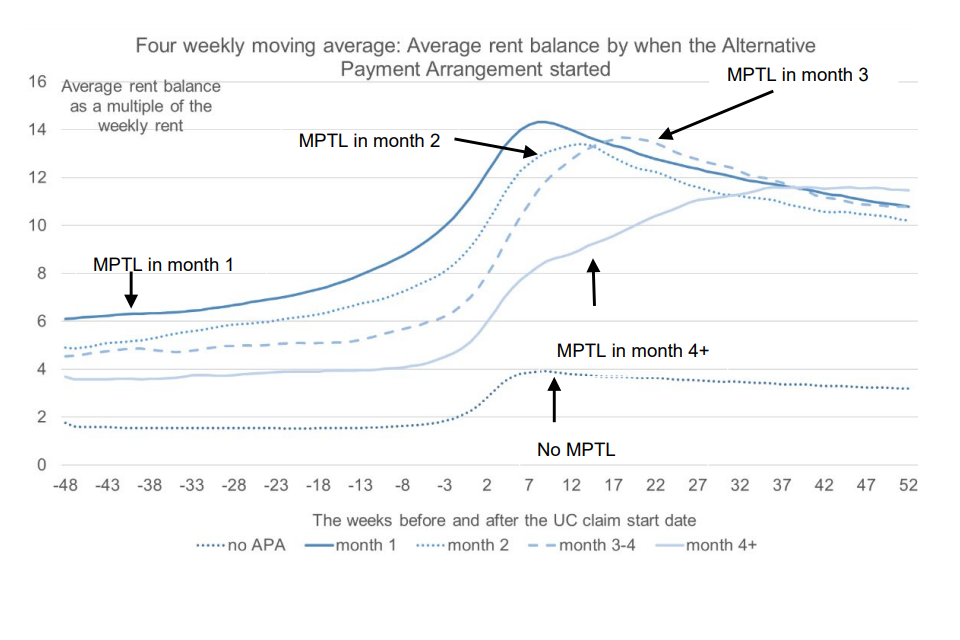
Figure 3.14 shows the variation of MPTL usage in different months across the 8 landlords.
-
there appears to be a link between the month a tenant had an MPTL implemented and when the rent balance peaks and stabilises. Also, tenants with an MPTL in their first month of their UC claim, had the highest rent arrears at the claim stage and 48 weeks before their claim
-
tenants with MPTLs applied in later months follow a similar pattern, in that rent arrears peak shortly after the MPTL is applied and decline afterwards. There may be an informal agreement between landlord and tenant for arrears reductions in addition to, or instead of, the MPTL
-
tenants without a MPTL at the claims start or up to 48 weeks later represent 60% of the dataset. This group had the lowest rent arrears throughout the period shown i.e. before their UC claim, at the point of claim and after their claim. Their rent balance is stable until around 4 weeks before their UC claim date. It then increases and peaks at 3.9 weeks of rent, and then gradually declines and is 3.2 weeks of rent a year after the UC claim
Figure 3.14: MPTL usage across all landlords before and after the UC claim.[footnote 22]
3.6 Moving on to UC
All tenants in our dataset have either naturally migrated from HB because their circumstances have changed, or have made a new claim to UC.
Table 3.1 segments the tenant dataset for all landlords by when a tenant last received HB before their UC claim. Just under a third of all tenants had not received HB within 6 months before their UC claim. Almost 60% of all tenants received HB up to 2 months before their UC claim and includes those who would have naturally migrated from HB to UC. Only 8% of tenants received HB within 3-4 months prior to claiming UC with a further 5% receiving HB 5-6 months beforehand.
Table 3.1: HB receipt before the UC claim
| Tenant segment – the number of months of last HB receipt before UC claim | Average proportion of tenants |
|---|---|
| 0-2 months | 58% |
| 3-4 months | 8% |
| 5-6 months | 5% |
| No HB claim in 6 months before UC claim | 29% |
| All Tenants | 100% |
Figure 3.15 shows the rent balance trend for all 4 groups from Table 3.1. For those who did not receive HB, their rent balance increased gradually before their UC claim, by which time they had a rent balance of 6.2 weeks. Eight weeks after their claim their rent balance peaked at 7.8 weeks. For those who received HB up to 2 months before their UC claim, which includes those who would have naturally migrated from HB to UC, their rent arrears peaked the lowest at 6.4 weeks of rent 16 weeks after their UC claim.
The tenants with an HB record have points A, B and C marked on Figure 3.15. These indicate the points at which tenants last received HB and appear to coincide with the upturns in rent balance:
A. represents the latest point in the tracking period that tenants who received HB within 5-6 months could have received HB B. is the equivalent for HB received within 3-4 months C. is the equivalent for HB received within 0-2 months
Figure 3.15: Moving onto UC (Points A, B and C are defined in the text immediately above)[footnote 23]
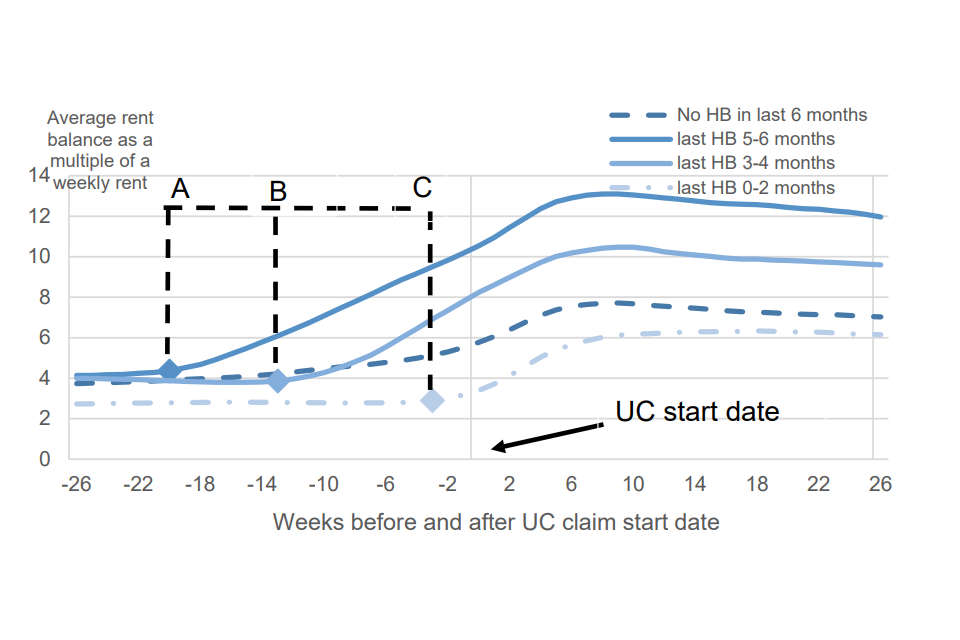
Tenants with a longer gap between their HB and UC claims tended to have higher arrears before the UC claim; and a higher peak in arrears after they made a UC claim.
Table 3.2 shows the rent balance at the UC claim date and after one year. Rent balances were typically lower for tenants with a smaller gap between HB and UC.
Table 3.2: Rent Balance after 48 weeks on UC
| Weeks after UC start date | No HB in last 6 months | last HB 5-6 months | last HB 3-4 months | last HB 0-2 months |
|---|---|---|---|---|
| 0 weeks | 5.8 | 10.5 | 8.2 | 3.4 |
| 52 weeks | 6.5 | 10.9 | 8.9 | 5.6 |
Previous benefits claimed
In Figure 3.16, we segment the tenant dataset by DWP benefits received at the time of their UC claim (defined as being paid up to 2 months before their UC claim). The benefits used are as follows: Income Support (IS); Employment and Support Allowance (ESA); Carer’s Allowance (CA); Jobseeker’s Allowance (JSA); and either Personal Independence Payment (PIP) or Disability Living Allowance (DLA).
Figure 3.16: Rent Balance split by previous benefit using 4 week moving average[footnote 24]
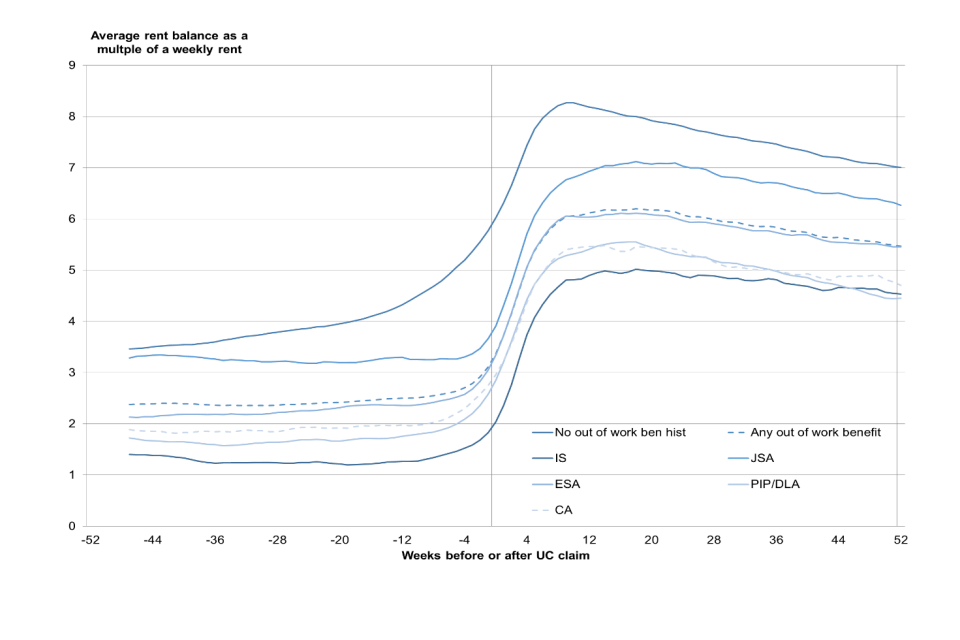
Note: No out of work benefits means none within 2 months of the UC claim date.
Tenants without a DWP benefit record within two months of their UC claim date had:
-
higher rent balances at the start of the tracking period, which increased further before their UC claim
-
after 1 year on UC, they still had the highest rent balance; although they had reduced their rent balances to less than 1 week above the level observed when they moved on to UC
For tenants that received a benefit 2 months prior to their UC claim:
- initially had a rent balance that was 1.4 to 3.3 weeks in arrears at 47 weeks before their UC claim
- rent balance remained stable or increased slowly until around 12 weeks before a UC claim. Broadly speaking, the ordering of average arrears for each DWP benefit remained stable before and after the UC claim
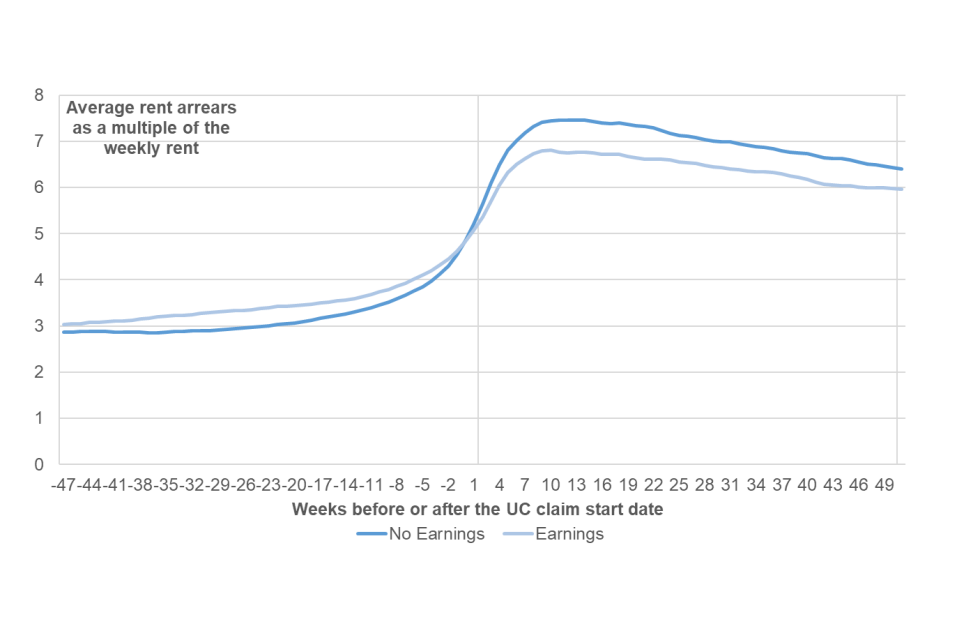
3.8 Tenants with earnings
Figure 3.17 shows results broken down by whether they were earning at the UC claim date, which accounted for one-third of the dataset. Earnings status was determined by earnings captured on the Real Time Information (RTI) data and so excludes self-reported earnings, and income from self-employment.
In the run-up to claiming UC, those tenants with earnings had a similar rent balance level to those without earnings. If a tenant was earning during their first month, they tended to accrue arrears at a slower rate than those who were not employed.
Tenants without earnings have a rent balances that peaked at higher levels. The rent balance of those without earnings was around half a week higher than those with earnings 1 year after the UC claim.
Please see Universal Credit and the patterns of rent balances in the Social Rented Sector: Social Research for additional information on earners.
Figure 3.17: Rent Balance split by whether a tenant was employed or not using 4-week moving average
4. Key messages
This report analyses rent balances for UC claimants in the Social Rented Sector in the period April 2014 to February 2019. The UC caseload has grown markedly since then including as a consequence of the COVID-19 pandemic.
-
the analysis of rent balances was based on rent records provided by 8 Social Rented Sector landlords operating across 6 Regions in England and Wales. We analysed rent account histories for 15,750 of their tenants who we linked to UC administrative data. In this report “Rent balance” is defined in relation to a tenant’s rent account and includes those tenants whose rent balances are in credit as well as those in arrears
-
on average, tenants had arrears equivalent to 2.8 to 3.5 weeks of rent at 48 weeks before their UC claim date; this then rose to 4.4 to 5.5 weeks of rent by the claim date. Arrears then initially increased more quickly, peaking between 7.0 to 8.0 weeks of rent around 8 to 12 weeks after the claim date. They then start to decline and by 52 weeks after the claim date they were equivalent to 5.8 to 6.7 weeks
-
some trends are impacted by changes in payment frequency, the impacts depend on individual circumstance and the type of landlord but could add 1.0-2.5 weeks of arrears, even where tenants continue to pay their rent in full after they receive their benefit payment
- the proportion of tenants that pay their rent in full or overpay (to reduce arrears) declines in the 12 weeks before the UC claim date. From 12 weeks after the claim date, there is a greater proportion of over payers compared to 48 weeks before the claim date, as action is taken to reduce arrears
- the 60% of tenants who at no point have a Managed Payment to Landlord (MPTL) in place in UC had the lowest rent arrears 48 weeks before their UC claim which peaked at 3.9 weeks of arrears, before declining to 3.2 weeks, a year after the UC claim. For the remaining 40% of tenants, arrears tend to be higher where there is a shorter period between the UC claim date and the introduction of a MPTL
- tenants with a longer gap between their HB and UC claims tended to have higher arrears before the UC claim; and a higher peak in arrears after they made a UC claim
- almost 60% all tenants received HB up to 2 months before their UC claim, which includes those who would have naturally migrated from HB to UC. Their rent arrears were the lowest peaking at 6.4 weeks of rent 16 weeks after their UC claim. Around 8% of all tenants received HB within 3-4 months prior to claiming UC with a further 5% receiving HB 5-6 months beforehand. The remaining 29% of tenants did not receive HB within 6 months of their UC claim
- tenants who were not in receipt of a DWP benefit in the two months before their UC claim generally had higher rent balances that increased further before their UC claim
- tenants with earnings tended to have a similar rent balance before making a UC claim to those with no earnings. Then during their first month on UC, they tended to accrue arrears more slowly than those without earnings. Subsequently arrears declined at a similar pace for those with and without earnings
- These results are not fully representative of all UC claimants. This is because, for example, it is a small dataset which does not include those living in the Private Rented Sector. Also there is no counterfactual for a similar group of claimants claiming HB so we can not directly attribute any changes in rent balances to the introduction of UC
Annex A - Data Sources
The rent balance analysis uses a bespoke dataset created from a number of data sources; we have linked rent payment data from 8 SRS landlords with tax records from HMRC and DWP benefit administrative data. The datasets used are listed below:
- extracts of rent payment data from each SRS landlord
-
HMRC RTI data[footnote 25]
-
DWP:
- Single Housing Benefit Extract (SHBE)
- National Benefit Database (NBD)
- Personal Independence Payment (PIP)
- three Universal Credit (UC) datasets - Live Service (UCLS), Full Service (UCFS) and Official Statistics dataset (UCOS)
Annex B – Additional Charts
For cohort analysis, we have chosen to present trends of the average of individual landlord tenant averages supplemented by charts showing the trends for individual landlords.
When using this approach, there is a danger that combined results may mask more nuanced trends at an individual landlord level. The table below illustrates this point by showing APA levels for two hypothetical landlords. APA usage in 2017/18 was higher for both landlords, however the combined average was higher in 2016/17. Hence it is possible to draw different conclusions from looking at combined results only. For this reason, Annex B shows landlord level results.
Table B1: Example - Averages of averages
| Year | Landlord A | Landlord A | Landlord B | Landlord B | Combined | Combined |
|---|---|---|---|---|---|---|
| 2016/17 | 24/48 | 50% | 366/582 | 63% | 390/630 | 62% |
| 2017/18 | 240/411 | 58% | 90/140 | 64% | 330/551 | 60% |
Tenant averages for each landlord
The two charts avoid the problems outlined above with tenant averages.
The three vertical lines for each landlord represent three consecutive cohorts, for the financial years 2015/16, 2016/17 and 2017/18. The three differently shaped markers on each vertical line indicate rent arrears at:
- 52 weeks before the UC claim date
- UC claim date
- 52 weeks before the UC claim date
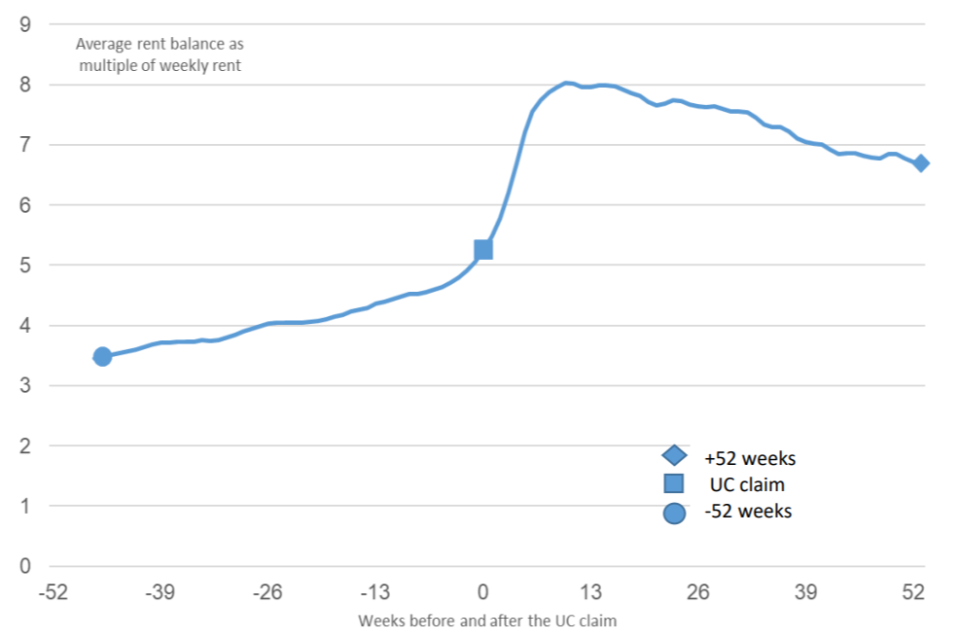
Figure B1 shows the location of the three measurements on the rent balance chart for one of the annual cohorts.
Figure B1: Location of three data points for each annual cohorts
Figures B2 and B3 show that pre-existing arrears 52 weeks before the claim, as shown by the circle marker, decrease from the first to last cohort with the exception of one landlord.
For 5 landlords rent balance levels 52 weeks after the UC claim decreased between 15/16 and 17/18. One landlord (L2) increased over the same period.
Figure B2: Three annual cohorts showing the raw rent balance changed for landlords L2 – L5
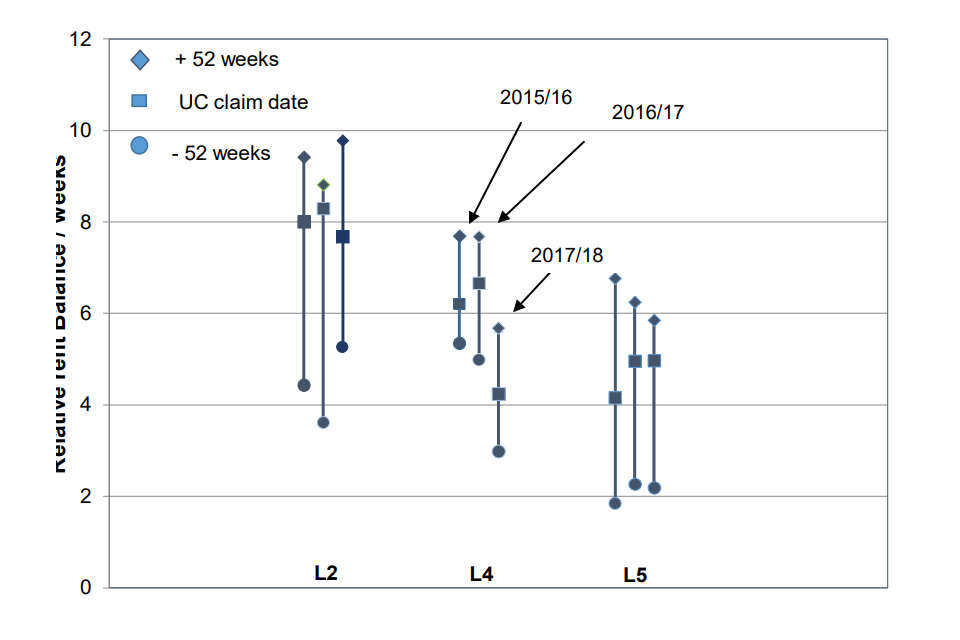
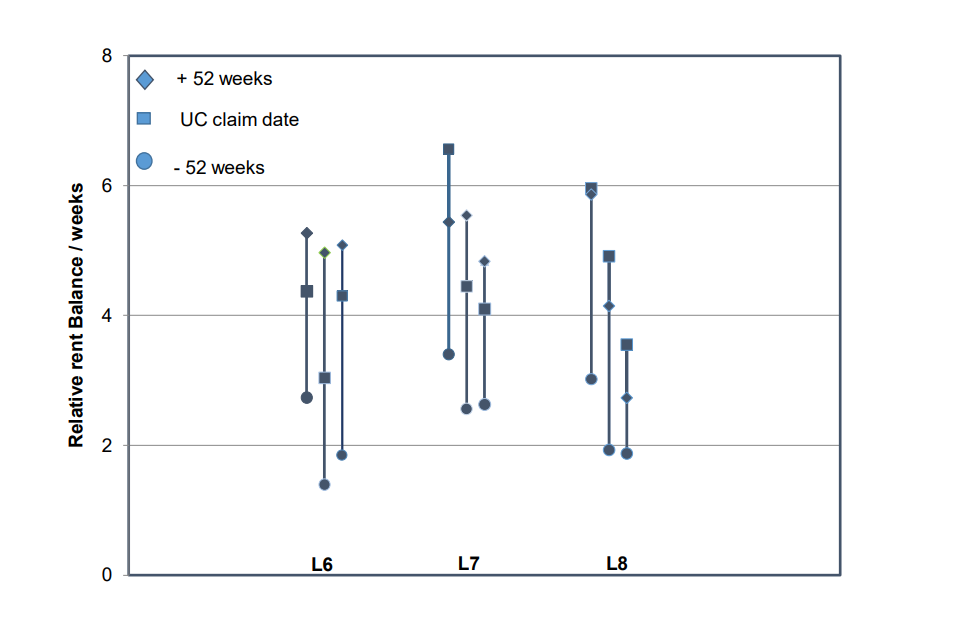
Figure B3: Three annual cohorts showing how the average rent balance changed for landlords L6 – L8
Annex C. References
Direct Payment Demonstration Project: Final Reports, December 2014:
Universal Credit Single Recipient survey:
Universal Credit: research with single claimants, including those with housing costs
Universal Credit Families survey:
Universal Credit Test and Learn Evaluation: Families
Annex D - Key definitions and glossary
| Term | Definition |
|---|---|
| ALMO | An Arm’s-Length Management Organisation provides housing service for a Local Authority. |
| ADRP | Apply for a Direct Rent Payment is a DWP service which supports landlords in applying direct payments to be made. |
| Analysis period | Most analysis in this paper tracks cohorts of tenants over time. From up to 12 months pre-UC to the most recent record which could be up to X years after the claim. |
| APA | Alternative Payment Arrangement |
| Arrears proportion | Total outstanding balance as a proportion of average weekly rent amount over the analysis period. |
| CA | Carer’s Allowance |
| DLA | Disability Living Allowance pays benefit for disabled people. |
| DWP | Department for Work and Pensions |
| ESA | Employment and Support Allowance available to claimants who have a disability or health condition which limits how much they can work. |
| HA | A Housing Association providing accommodation in the Social Rented Sector. |
| HMRC | HM Revenues and Customs |
| IS | Income Support – available for eligible working age people who are not jobseekers. They can be pregnant, a carer, lone parent with a child under 5 years old, or sick or disabled. |
| JSA | Jobseeker’s Allowance is an unemployed benefit claim whilst a person is looking for work. |
| LA | In this document used to distinguish whether the landlord was a Local Authority, Housing Association or ALMO (see above). |
| MPTL | A Managed Payment to Landlord is where a claimants has some of their UC paid direction to the landlord. |
| NBD | National Benefits Database |
| NINo | National Insurance Number |
| PIP | Personal Independence Payment |
| PRS | Private Rented Sector |
| Rent Arrears | For the purposes of this report, any outstanding rent balance (> 0) is defined as “arrears”. |
| Rent balance | Total outstanding balance on rent account. Includes some charges not covered by HB or UC, but these are not thought to be a large issue. |
| RTI | Real Time Information data provided by HMRC is used within the claim process to determine earnings in each Assessment Period. |
| SHBE | Single Housing Benefit Extract |
| SRS | Social Rented Sector |
| UC | Universal Credit |
| UCFS | Universal Credit Full Service is the digital service and as of December 2018 is available to all types of claimants across the country. Universal Credit Full Service claimants will have an online Universal Credit account to manage their claim. They will use their account to report changes, send messages to their work coach and find support. |
| UCLS | Universal Credit Live service was launched before UCFS and at one stage was available to all single people across Great Britain, who were not in a full service area and couples and families with children in certain areas. Universal Credit Live Service managed their claim by telephone. |
| UCOS | Universal Credit Official Statistics |
-
The GreenSquare Group completed a merger with Accord Housing Association to create GreenSquareAccord in 2021 and is now known as GreenSquareAccord. ↩
-
Northwards Housing ceased to be an ALMO and was re-absorbed into Manchester City Council’s housing operations service in June 2021. ↩
-
Rent arrears at the UC claim are reported by the landlords of claimants living in the Social Rented Sector as part of the rent verification process. ↩
-
Stat-Xplore, for England and Wales in February 2019, the linked dataset represents approximately: 1% of the 1,440,000 UC households with UC in payment; 2% of the 889,000 households claiming UC with housing support and 3% of the 485,000 with housing support in the SRS. ↩
-
Managed migration from Housing Benefit to Universal Credit Full Service. ↩
-
A “counterfactual group” in this case would be a group of individuals who were similar in other regards to the “treatment group” (SRS tenants who claimed UC) but did not make a claim to UC. This would enable robust analysis by separating the effect of UC from adverse life events likely to impact on arrears, such as loss of earnings from unemployment. ↩
-
Provisional Statistics from Stat-Xplore reported in August 2020 ↩
-
Stat Xplore UC caseload February 2019 ↩
-
The GreenSquare Group completed a merger with Accord Housing Association to create GreenSquareAccord in 2021 and is now known as GreenSquareAccord. ↩
-
Northwards Housing ceased to be an ALMO and was re-absorbed into Manchester City Council’s housing operations service in June 2021. ↩
-
There are 10,750 tenants in the sample consistently present from 17 weeks before and after the UC claim date. 2018/19 is lower than 2017/18 as many landlord extracts occurred in 2018/19 and so we do not have data for the full year. Totals do not sum due to rounding. ↩
-
‘Rent balance’ refers to the tenant’s rent account regardless of whether they are in credit or arrears; whereas ‘Rent arrears’ summarises the rent balance only for tenants who are in arrears and treats those in credit as having zero arrears. ↩
-
There are 8,870 tenants from cohorts 2, 3 and 4 in the sample with an analytical window of 17 weeks before and after the UC claim. ↩
-
There were 580 tenants at the UC claim with an analytical window of 52 weeks before the UC claim and up to 52 weeks afterwards. ↩
-
In 2016/17 there were 1690 tenants at the UC claim with an analytical window of 52 weeks before the UC claim and up to 52 weeks afterwards. ↩
-
In 2017/18 there were 2040 tenants at the UC claim with an analytical window of 52 weeks before the UC claim and up to 52 weeks afterwards. ↩
-
There are 2,450 tenants for 2016/17 cohort from 8 landlords at the UC claim. They continously rented throughout the analytical window of 17 weeks before and afterwards. ↩
-
The above chart and the following ones make use of a rolling 4-week average to smooth out any short term perturbations of the average rent balance. ↩
-
There are two other types of APAs which are used less often, these are (i) split payment and (ii) more frequent payments. These two APA types are not presented in this report. ↩
-
There are 9,260 tenants across 8 landlords at the UC claim date in the LA/ALMO sample with a analytical window of 26 weeks before and after the UC claim. ↩
-
There are 6,620 tenants across 8 landlords at the UC claim date in the LA/ALMO sample with a analytical window of 50 weeks before and after the UC claim. ↩
-
There are 6,820 tenants across 8 landlords at the UC claim date in the LA/ALMO sample with a analytical window of 26 weeks before and after the UC claim. ↩
-
There are 7,070 tenants across 8 landlords at the UC claim date with an analytical window of 48 weeks before and after the UC claim. ↩
-
RTI - a reporting for income taxed though PAYE system ↩