Farm Agri-Environment Activities in England, 2022/23 – statistics notice
Published 19 September 2024
Applies to England

© Crown copyright 2024
This publication is licensed under the terms of the Open Government Licence v3.0 except where otherwise stated. To view this licence, visit nationalarchives.gov.uk/doc/open-government-licence/version/3 or write to the Information Policy Team, The National Archives, Kew, London TW9 4DU, or email: psi@nationalarchives.gov.uk.
Where we have identified any third party copyright information you will need to obtain permission from the copyright holders concerned.
This publication is available at https://www.gov.uk/government/statistics/agri-environment-activities/farm-agri-environment-activities-in-england-202223-statistics-notice
This release presents estimates of the proportion of farm businesses in England that are carrying out agri-environment practices irrespective of whether they are part of a Defra agri-environment scheme. Also presented are a summary of the reasons why farm businesses are, or are not, undertaking these practices, along with estimates of the time and cost involved.
This data was collected as part of the Farm Business Survey (FBS), therefore, the estimates presented here are only representative of the farm businesses with a standard output of at least 25,000 euros. They should not be used as official scheme uptake figures for Defra’s agri-environmental schemes. Official statistics on SFI action uptake can be found at the following page: https://www.gov.uk/government/statistics/cs-es-and-sfi-option-uptake-data-2024. The results cover the average period 1 March 2022 to 28 February 2023, including the 2022 harvest, 2022 Basic Payment and the second year of the agricultural transition period.
The data was collected to help Defra gather evidence of the costs of agri-environment activities farm businesses carry out, along with those who are already doing activities outside formal schemes. This will feed into the continual development of new schemes through the agricultural transition period.
Points which apply throughout
- The Farm Business Survey is the source for all data presented in tables and charts.
- All figures relate to England, unless otherwise stated, and cover a March to February fiscal year, with the most recent year shown ending in February. Fiscal years are shown in YYYY/YY format, for example, the period of 1 March 2022 to 28 February 2023 is shown as 2022/23. To ensure consistency in harvest/crop year and commonality of subsidies within any one Farm Business Survey year, only farms which have accounting years ending between 31 December and 30 April are included in the survey. Aggregate results are presented in terms of an accounting year ending on the last day of February which is the approximate average of all farms in the Farm Business Survey.
- When ‘other’ farms are mentioned, this refers to the following farm types which have been combined into one group due to small sample sizes: mixed, horticulture, poultry and pig farms.
- The acronym ‘LFA’ refers to Less Favoured Area. These areas were established in 1975 to provide support to mountainous and hill farming areas. They are areas where the natural characteristics (geology, altitude, climate, short growing season, low soil fertility, or remoteness) make it difficult for farmers to compete.
- Calculations have been made using unrounded values and then rounded to the nearest whole number.
- The data presented here are only representative of farm businesses in England with a standard output of at least 25,000 euros (this is referred to as the ‘FBS population’ throughout) and give an indication of participation in agri-environment activities. These are not official figures of the uptake of Defra schemes. Official figures can be found at the following webpage: https://www.gov.uk/government/statistics/cs-es-and-sfi-option-uptake-data-2024.
- The percentages have been calculated from the weighted FBS sample and represent the FBS population.
- Where dataset tables are referred to in the text, this refers to the ‘Agri-environment activities in England 2022/23 - dataset’ file, which can be found on the publication landing page.
Key results
- In the 2022/23 survey year, all farm businesses within the FBS population were undertaking at least one agri-environment activity.
- In the 2022/23 survey year, 46% of farm businesses within the FBS population had some farmland registered in an agri-environment scheme.
- Regardless of whether or not the land was registered in a scheme, the most popular agri-environment categories were soil management (46% of farm businesses), nature-friendly farming (36%) and woodland creation or management (20%).
- The main reason for not undertaking agri-environment activities was because it was not relevant or would cause too much disruption to their existing farming system.
- Within the most popular agri-environment categories, the activities that farmers spent the most time working on over the year were hedge laying (41 hours on average), planting ‘other’ cover crops (15 hours) and setting up winter bird food (15 hours).
1 Agri-environment activities
Agri-environment schemes require farmers and land managers to implement environmentally beneficial management and demonstrate good environmental practices on their farms. The government’s initiative provides financial support and guidelines to landowners and farmers, with its goal being to promote sustainable land management practices, enhance natural habitats, and support rural communities by funding activities that benefit the environment and maintain rural landscapes.
Farmland that is registered in an agri-environment scheme generates payments from Defra in return for performing certain tasks. Specific rules must be followed, such as when to plant and harvest crops. In this publication, this farmland is referred to as ‘within scheme’. Farmland that is not in a scheme does not generate agri-environment payments from Defra. However, farmers may still choose to carry out agri-environment activities independently and can decide how to manage their land; this farmland is referred to as ‘out of scheme’. The FBS collects data on both out of scheme and within scheme agri-environment activities; the main categories collected in the FBS are:
- Soil Management
- Nature-friendly Farming
- Woodland Creation or Management
- Water Quality
- Habitat Creation
- Integrated Pest Management
- Agricultural Decarbonisation
- Peatland Restoration
1.1 Uptake of agri-environment activities
Table 1.1 Percentage of farms within the FBS population engaging in agri-environment activities in England, 2022/23
| Agri-environment category | Percentage of farm businesses | 95% Confidence Interval |
|---|---|---|
| At least one activity | 100% | 100% to 100% |
| Soil Management | 46% | 42% to 49% |
| Nature-friendly Farming | 36% | 33% to 40% |
| Woodland Creation or Management | 20% | 16% to 23% |
| Water Quality | 18% | 15% to 22% |
| Habitat Creation | 12% | 9% to 14% |
| Integrated Pest Management | 11% | 9% to 14% |
| Agricultural Decarbonisation | 2% | 1% to 3% |
| Peatland Restoration | 1% | 0% to 1% |
| Other | 29% | 25% to 32% |
Source: Dataset table 1
Table notes:
- 95% confidence intervals are presented to illustrate the range within which the true underlying population average is likely to reside, which provides an indication for the level of uncertainty associated with the sample estimate; see section 6.3 for more details.
- A map showing the extent of peatlands in England is available on ArcGIS online at the following webpage: link. This map has been uploaded by The Rivers Trust using data provided by Natural England. Natural England will be publishing an updated England Peat Map in March 2025. Read their blog post at the following webpage: link.
In the 2022/23 survey year, all farm businesses within the FBS population were engaged in at least one agri-environment activity.
The most popular agri-environment categories in 2022/23 were soil management (46% of farms), nature-friendly farming (36%) and woodland creation or management (20%). The least popular were agricultural decarbonisation (2% of farms) and peatland restoration (1%). Additionally, 29% of farm businesses engaged in at least one ‘other’ agri-environment activity which was not measured in the survey.
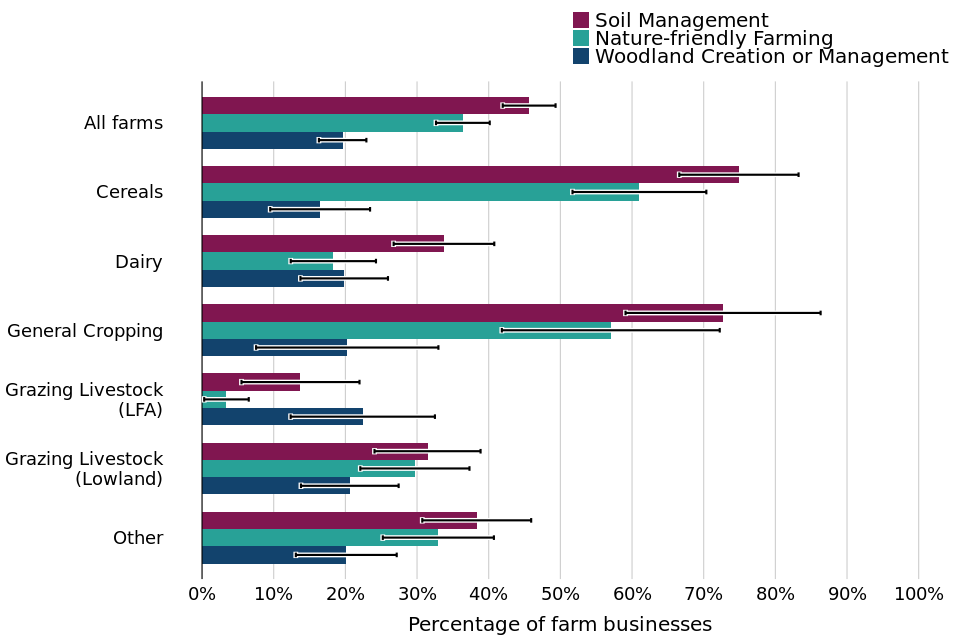
Figure 1.1 Percentage of farms within the FBS population engaging in the most popular agri-environment categories in England by farm type, 2022/23
Source: Dataset table 1
Figure notes:
- The legend is presented in the same order as the bars.
- 95% confidence intervals are presented to illustrate the range within which the true underlying population average is likely to reside, which provides an indication for the level of uncertainty associated with the sample estimate; see section 6.3 for more details.
In 2022/23, soil management activities were most popular in cereal farms (75% of farm businesses) and general cropping farms (72%). LFA grazing livestock farms had the lowest proportion at only 14%.
Similarly, the farms with the highest proportion of nature-friendly farming activities were also cereal farms (61%) and general cropping farms (57%), while LFA grazing livestock farms had the lowest at only 3%.
The proportion of farm businesses undertaking at least one woodland creation or management activity was similar across all farm types, with LFA grazing livestock farms having the highest proportion (22%) and cereal farms having the lowest (16%).
1.2 Farmland within an agri-environment scheme
The data presented here examines the subset of farms who are engaging in specific categories of environmental activities, along with the split between within scheme and out of scheme farmland.
In the 2022/23 survey year, all farm businesses had at least one unit of ‘out of scheme’ land, in other words, they were undertaking an agri-environment activity in at least one unit of their farmland outside of a Defra agri-environment scheme (dataset table 3).
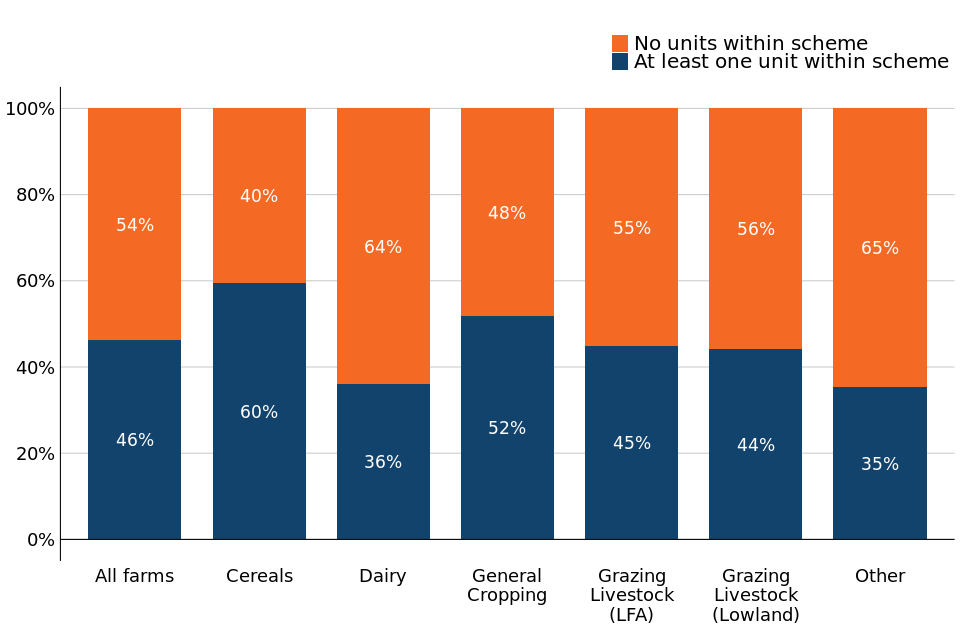
Figure 1.2 Of FBS farm businesses engaging in agri-environment activities, proportion within a Defra agri-environment scheme by farm type, 2022/23
Source: Dataset table 3
Figure notes:
- The legend is presented in the same order as the bars.
- 95% confidence intervals are presented to illustrate the range within which the true underlying population average is likely to reside, which provides an indication for the level of uncertainty associated with the sample estimate; see section 6.3 for more details.
In the 2022/23 survey year, 46% of FBS farm businesses had at least one unit of agri-environment farmland registered in a Defra agri-environment scheme. This was most popular in cereal farms, at 60% of farms, and least popular in ‘other’ farms (mixed, horticulture, poultry and pig farms), at 35%.
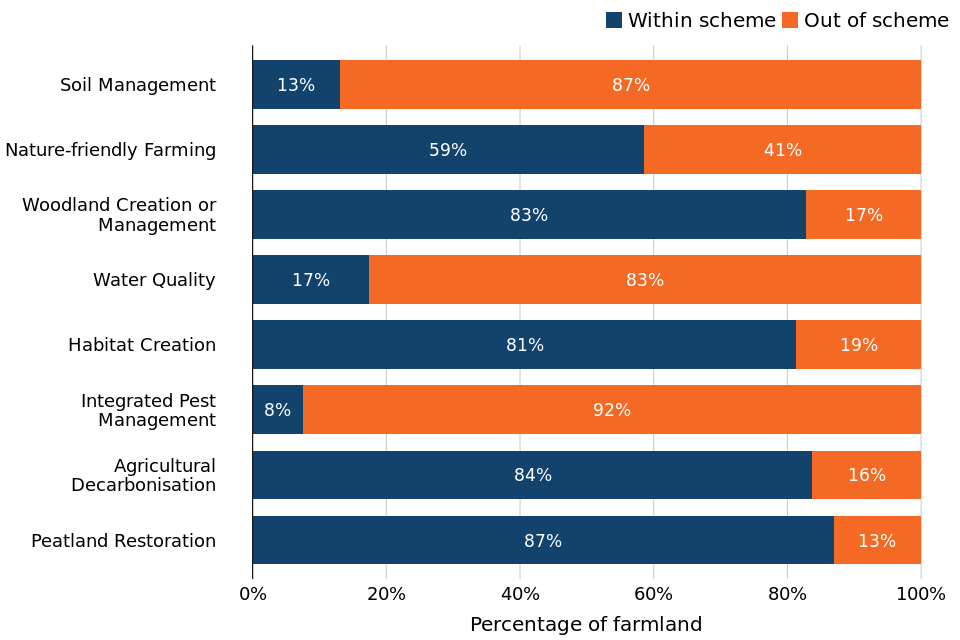
Figure 1.3 Farmland within the FBS population carrying out agri-environment activities by proportion participating in Defra agri-environment schemes and by agri-environment category in England, 2022/23
Source: Dataset table 4
Figure note: The legend is presented in the same order as the bars.
Scheme registration was most popular in woodland creation or management, habitat creation, agricultural decarbonisation and peatland restoration, all of which had over 80% of the farmland doing those activities registered within scheme.
The opposite was the case for soil management, water quality and integrated pest management. Of the farmland doing these activities, less than 20% was within scheme for each category.
Nature-friendly farming had the most balanced distribution, with 59% of farmland within scheme and 41% out of scheme.
1.3 Reasons for not undertaking agri-environment activities
Farmers were asked why they do not undertake agri-environment activities, which have been grouped into the following reasons:
- Relevance - Not relevant, or will disrupt their existing farming system
- Payments - The payments are not sufficient
- Effort - Too much administrative work, field work or mental effort
- Restrictions - Cannot within the terms of their tenancy agreement, or does not have the specific skills and knowledge
- Other - Environmental risks, or other unlisted reasons
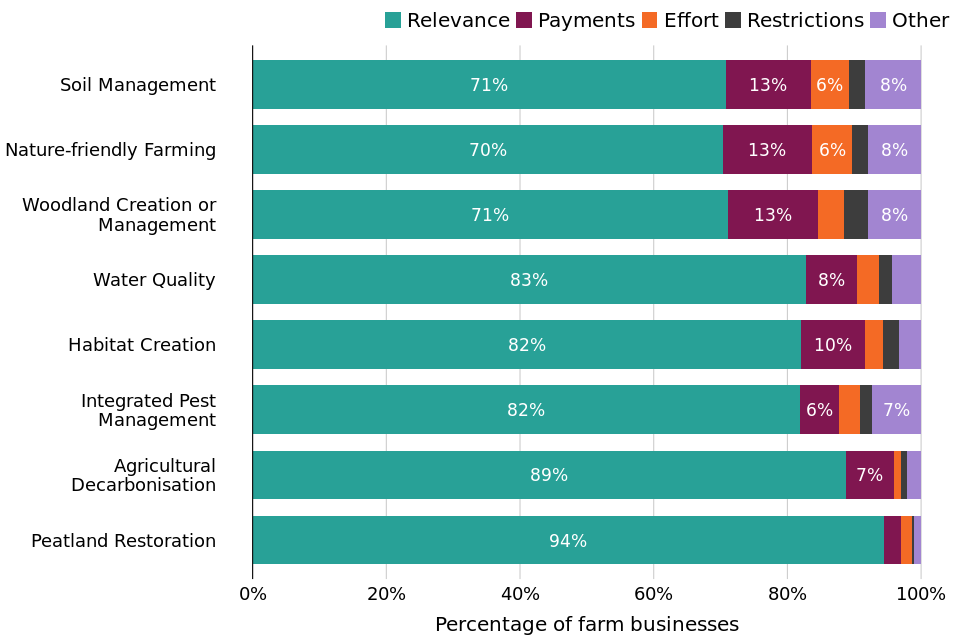
Figure 1.4 Reasons why farm businesses did not undertake agri-environment activities in England, 2022/23
Source: Dataset table 7
Figure notes:
- The legend is presented in the same order as the bars.
- Text is not displayed where proportions are below 5%.
- For a full list of reasons, see section 5.6.
Across all agri-environment activity categories, the primary reason for farms not undertaking agri-environment activities was because the activity was not relevant or would disrupt their existing farming systems. The response was grouped this way within the survey; therefore, further breakdown of this group is not possible. For all categories except for integrated pest management, insufficient payment was the second most common reason for not undertaking an agri-environment activity.
2 Soil management
A soil management plan is a strategy used by farmers and land managers to maintain and improve soil health. For more detail on soil management and its associated activities, see section 5.7.
In the 2022/23 survey year, 46% of farms engaged in at least one soil management activity, shown in table 1.1. This section looks at just these farms, so the percentages presented are a proportion of this subset of farms, rather than the whole FBS population.
Within the soil management category asked in the FBS, the following activities are included:
- Green cover for grass: fast-growing annual plants sown between main cash crops for grass
- Multi-species cover: a mixture of more than one fast-growing annual plant sown between main cash crops
- Other cover: other cover crops not included in either green cover for grass or multi-species cover
- Minimum-tillage or no-tillage: cultivating soil using minimal or no cultivation machinery
- Herbal leys: applying a blend of grasses, legumes (including clover) or herbs to soil
Table 2.1 Soil management activity uptake of farm businesses undertaking at least one soil management activity in England, 2022/23
| Soil Management activity | Farms Undertaking Activity | 95% Confidence Interval |
|---|---|---|
| Green cover for grass | 4% | 2% to 7% |
| Multi-species cover | 6% | 3% to 10% |
| Other cover | 33% | 28% to 39% |
| Minimum-tillage or no-tillage | 69% | 63% to 74% |
| Herbal leys | 35% | 30% to 40% |
Source: Dataset table 2.1
Table notes:
- The percentages in this table refer to the subset of farm business that undertake at least one soil management activity.
- Figures are rounded to the nearest 1%.
- 95% confidence intervals are presented to illustrate the range within which the true underlying population average is likely to reside, which provides an indication for the level of uncertainty associated with the sample estimate; see section 6.3 for more details.
In 2022/23, just 4% of farm businesses engaging in at least one soil management activity had green cover for grass, and 6% had multi-species cover, while 33% had other cover crops. Of the farms engaging in at least one soil management activity, the most popular activity was adopting minimum-tillage or no-tillage practices in their soil handling (69%), while applying herbal leys was the next most popular at 35%.
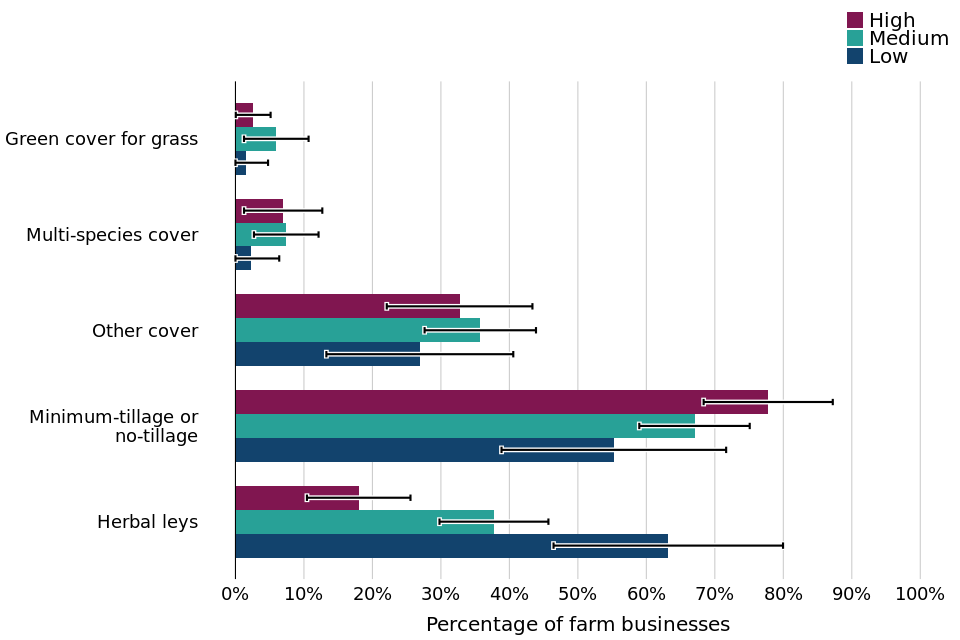
Figure 2.1 Soil management activity uptake of farm businesses undertaking at least one soil management activity by farm economic performance band in England, 2022/23
Source: Dataset table 2.2
Figure notes:
- The legend is presented in the same order as the bars.
- 95% confidence intervals are presented to illustrate the range within which the true underlying population average is likely to reside, which provides an indication for the level of uncertainty associated with the sample estimate; see section 6.3 for more details.
Of the farm businesses that engaged in at least one soil management activity, 78% of high performing farms adopted minimum-tillage or no-tillage practices, compared to 55% of low performing farms. Low performing farms had the largest proportion (63%) of farms applying herbal leys practices, in comparison to just 18% of high performing farms.
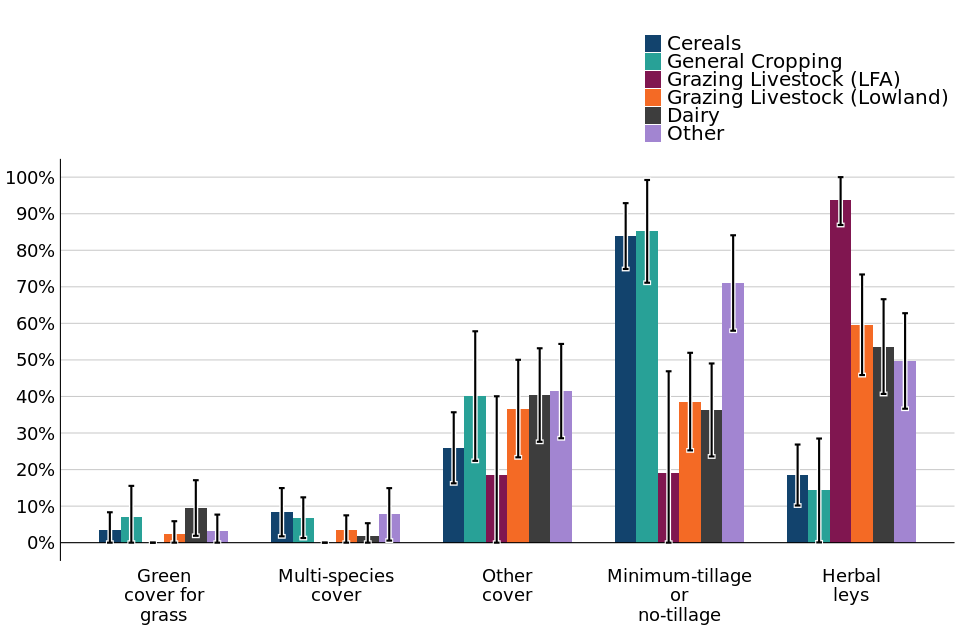
Figure 2.2 Soil management activity uptake of farm businesses undertaking at least one soil management activity by farm type in England, 2022/23
Source: Dataset table 2.1
Figure notes:
- The legend is presented in the same order as the bars.
- 95% confidence intervals are presented to illustrate the range within which the true underlying population average is likely to reside, which provides an indication for the level of uncertainty associated with the sample estimate; see section 6.3 for more details.
Of the farm businesses that undertook at least one soil management activity, the majority of cereal farms (84%) and general cropping farms (85%) had adopted minimum-tillage or no-tillage practices, while the uptake in dairy and grazing livestock farms was less than 40%. Almost all LFA grazing livestock farms who undertook at least one soil management activity had applied herbal leys practices (94%), while less than 20% of cereal and general cropping farms did so. Across all farm types, other cover crops were much more popular than green cover for grass and multi-species cover.
2.1 Farmland under soil management activities
The data presented here examines the subset of farms who engaged in soil management activities in 2022/23, along with the split between those doing them in scheme or out of scheme.
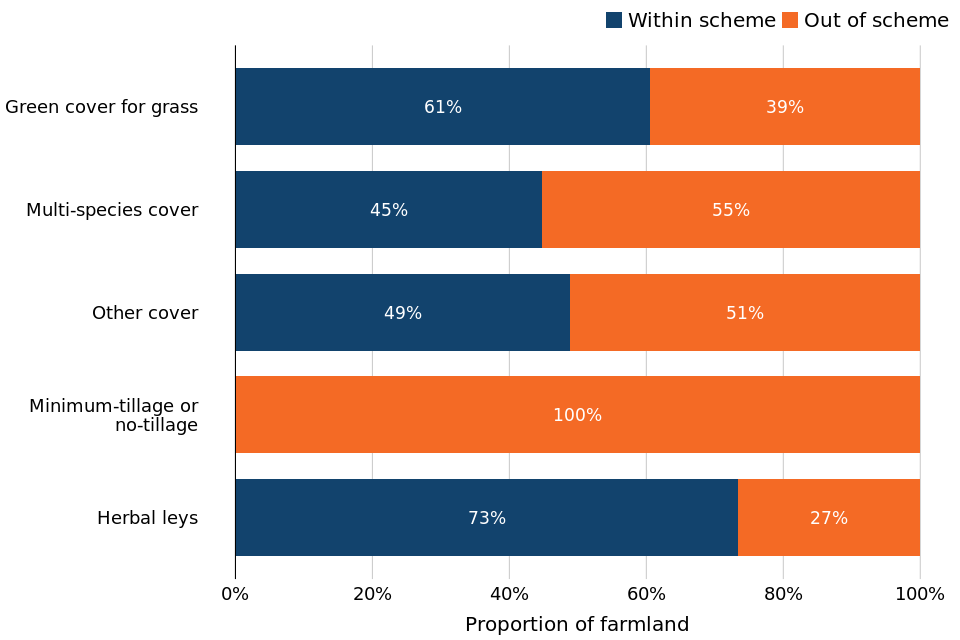
Figure 2.3 Farmland with soil management activities by scheme registration and activity type in England 2022/23
Source: Dataset table 5
Figure notes:
- The legend is presented in the same order as the bars.
- Minimum-tillage and no-tillage practices were not agri-environment scheme options available in this survey year, so there could be no farmland within scheme.
In the 2022/23 survey year, no farmland which was subject to minimum-tillage or no-tillage practices within the FBS population was registered in an agri-environment scheme, since these practices were not available within schemes in this survey period. For herbal leys, the majority of farmland (73% of farms) was in a scheme. There was generally a more even distribution of farmland within a scheme and out of scheme for cover cropped land.
2.2 Reasons for and against uptake of activities
The farm businesses that had undertaken at least one soil management activity were asked to provide the three main reasons for choosing to do so. Options included wanting to do something positive for the environment, having the appropriate skills to do so, or because it fits in with their existing business model. A full list of reasons can be found in section 5.6.
The farm businesses that undertook at least one soil management activity, but not all of them, were asked to provide the main reason why they did not undertake the remaining activities. The response options are described in section 1.3.
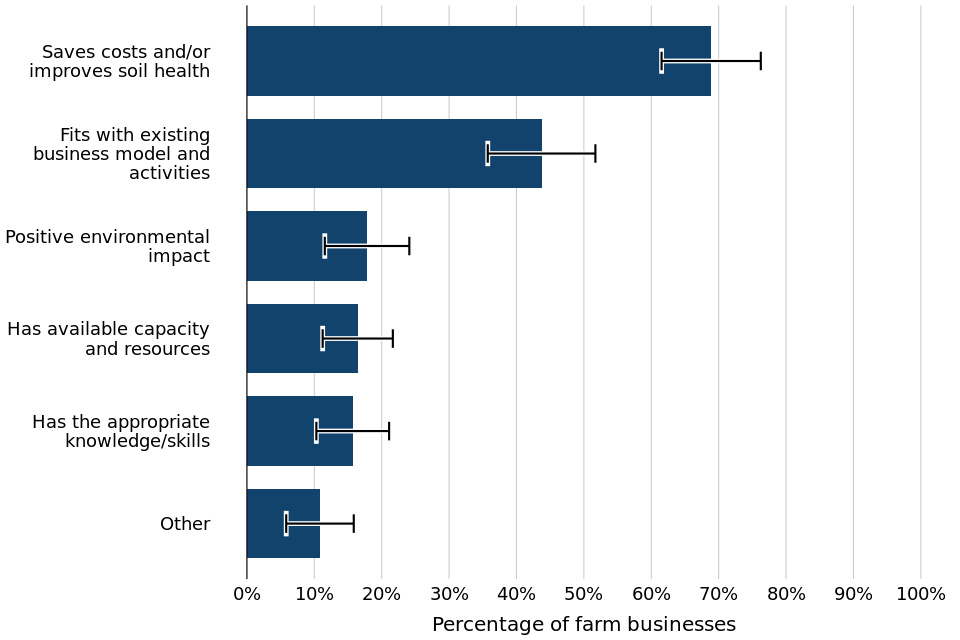
Figure 2.4 Reasons for uptake of minimum-tillage or no-tillage in England, 2022/23
Source: Dataset table 6
Figure notes:
- 95% confidence intervals are presented to illustrate the range within which the true underlying population average is likely to reside, which provides an indication for the level of uncertainty associated with the sample estimate; see section 6.3 for more details.
- Farmers were asked to choose the 3 main reasons they chose to undertake this practice.
- Choices with less than 10% are not shown in this chart.
- For a full list of reasons, see section 5.6.
The most popular reasons for farm businesses undertaking minimum-tillage or no-tillage practices were because it saves costs and/or improves soil health, and because it fit in with their existing business model.
Figure 2.5 Reasons why farm businesses did not engage in soil management activities in England, 2022/23
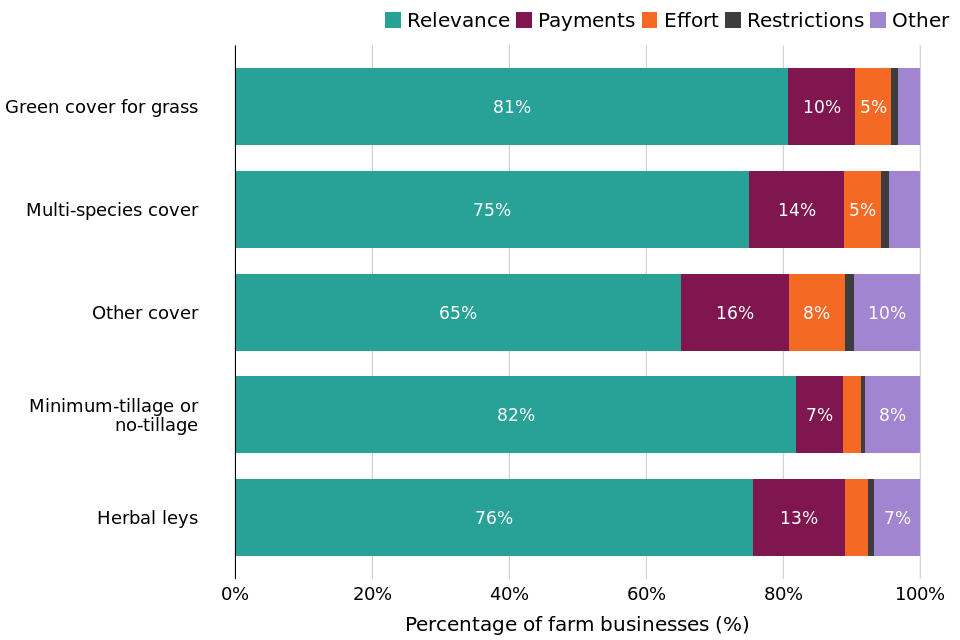
Source: Dataset table 8
Figure notes:
- The legend is presented in the same order as the bars.
- Text is not displayed where proportions are below 5%.
- For a full list of reasons, see section 5.6.
- This chart refers to the subset of farm businesses that had undertaken at least one soil management activity.
Across all soil management activities, the primary reason for farms not undertaking practices was because the practice was not relevant or would disrupt their existing farming systems. For all activities except for minimum-tillage or no-tillage, insufficient payments were the second most common reason for not undertaking a soil management activity, for example, 16% of farms attributed insufficient payments as the main reason for not planting other cover crops.
2.3 Costs and time
This section outlines the average costs and time associated with soil management activities. Costs are categorised into annual crop costs, long-term establishment and maintenance, and creation and management, including contractor fees and material expenses. Contractor costs refer to services involving machinery, while material costs cover all non-labour expenses. Time is recorded in hours, accounting for tractor hours, labour (paid, unpaid, and volunteer), and administration.
Figure 2.6 Distribution of total annual costs associated with soil management activities by farm economic performance band in England, 2022/23
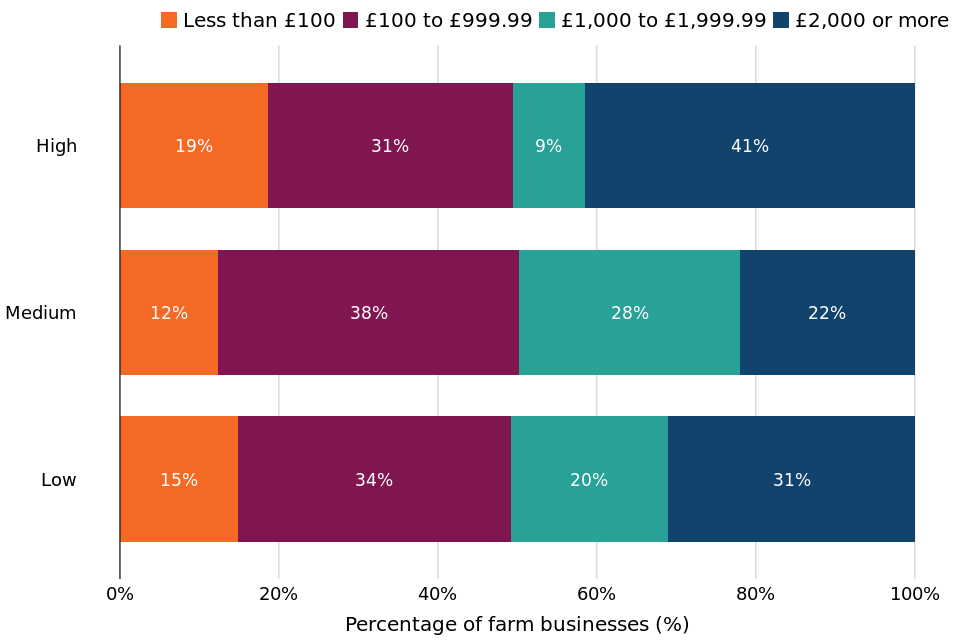
Source: Dataset table 9
Figure notes:
- The legend is presented in the same order as the bars.
- Minimum-tillage or no-tillage is not included in costs since it is a soil cultivating method which is incorporated into day-to-day farming, rather than being a distinct practice.
Across all farm economic performance bands, around half of farm businesses spent on average less than £1,000 in 2022/23 on soil management activities, with the other half spending more than £1,000. High performing farms had the highest proportion, 41%, spending over £2,000 or more, but also had the highest proportion spending under £100, 19%. Conversely, medium performing farms had the lowest proportions in both of these categories, with 22% spending at least £2,000 and 12% spending less than £100.
Table 2.2 Time spent on soil management activities in England, 2022/23
| Soil Management activity | Average time spent on activity | 95% Confidence Interval |
|---|---|---|
| Green cover for grass | 1 hour | 0 to 1 hour |
| Multi-species | 3 hours | 1 to 5 hours |
| Other cover | 15 hours | 10 to 19 hours |
| Herbal leys | 10 hours | 7 to 13 hours |
Source: Dataset table 10
Table notes:
- Figures are rounded to the nearest hour
- 95% confidence intervals are presented to illustrate the range within which the true underlying population average is likely to reside, which provides an indication for the level of uncertainty associated with the sample estimate; see section 6.3 for more details.
- Minimum-tillage or no-tillage is not listed as an option here since it is a soil cultivating method which is incorporated into day-to-day farming, rather than being a distinct practice.
In the 2022/23 survey year, the soil management activity that farm businesses spent the longest amount of time on was other cover crops, an average of 15 hours. The shortest amount of time, on average 1 hour, was spent on green cover for grass.
3 Nature-friendly farming
Nature-friendly farming is an agricultural approach that enhances biodiversity and environmental health while maintaining productivity. For more detail on nature-friendly farming and its associated activities, see section 5.7.
In the 2022/23 survey year, 36% of farm businesses had undertaken at least one activity in contribution to nature-friendly farming (shown in table 1.1). This section looks at just these farms, and so the percentages presented are a proportion of this subset of farms as opposed to the whole FBS population.
Nature-friendly farming has been split into the following activities within the FBS:
- Winter bird food: planting crops that produce small seeds during autumn and winter
- Flower rich margin: creation of habitats and foraging areas for invertebrates on arable land
- Wildflower mixes: creation of habitats and foraging areas for invertebrates on grassland
- Field corners: setting aside small areas within permanent grasslands to create year-round habitats for wildlife
- Beetle banks: establishing beetle banks on arable land and temporary grassland
Table 3.1 Nature-friendly farming activity uptake of farm businesses undertaking at least one nature-friendly farming activity in England, 2022/23
| Nature-friendly Farming activity | Farms Undertaking Activity | 95% Confidence Interval |
|---|---|---|
| Winter bird food | 68% | 62% to 75% |
| Flower rich margin | 43% | 36% to 50% |
| Wildflower mixes | 39% | 32% to 46% |
| Field corners | 32% | 25% to 39% |
| Beetle banks | 6% | 2% to 9% |
Source: Dataset table 2.1
Table notes:
- The percentages in this table refer to the subset of farm business that undertake at least one nature-friendly farming activity.
- Figures are rounded to the nearest 1%.
- 95% confidence intervals are presented to illustrate the range within which the true underlying population average is likely to reside, which provides an indication for the level of uncertainty associated with the sample estimate; see section 6.3 for more details.
In the 2022/23 survey year, 68% of farms who had undertaken at least one nature-friendly farming activity planted winter bird food, which was the most popular activity. Similar percentages planted flower rich margins and wildflower mixes, at 43% and 39% respectively. Fewer farms set up insect habitats, with 32% creating field corners and just 6% creating beetle banks.
Figure 3.1 Nature-friendly farming activity uptake of farm businesses undertaking at least one nature-friendly farming activity by farm economic performance band in England, 2022/23
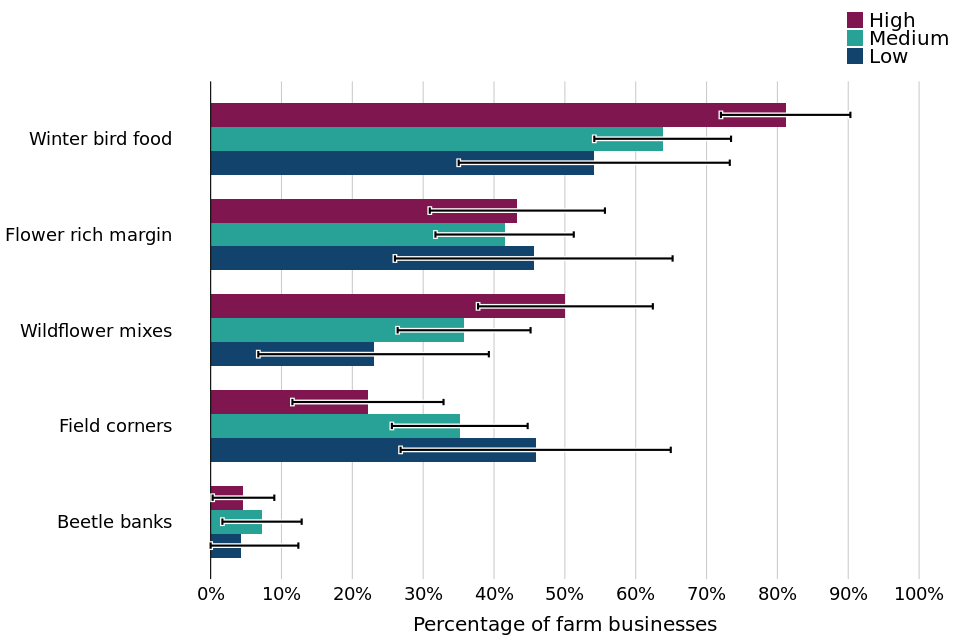
Source: Dataset table 2.2
Figure notes:
- The legend is presented in the same order as the bars.
- 95% confidence intervals are presented to illustrate the range within which the true underlying population average is likely to reside, which provides an indication for the level of uncertainty associated with the sample estimate; see section 6.3 for more details.
Of the farm businesses that engaged in at least one nature-friendly farming activity, 81% of high performing farms planted winter bird food, compared to 54% of low performing farms. All performance bands had low proportions of farms (between 4% and 7%) establishing beetle banks.
3.1 Farmland under nature-friendly farming activities
The data presented here examines the subset of farms who engaged in nature-friendly farming activities in 2022/23, along with the split between those doing them in scheme or out of scheme.
Figure 3.2 Farmland with nature-friendly farming activities by scheme registration and activity type in England 2022/23
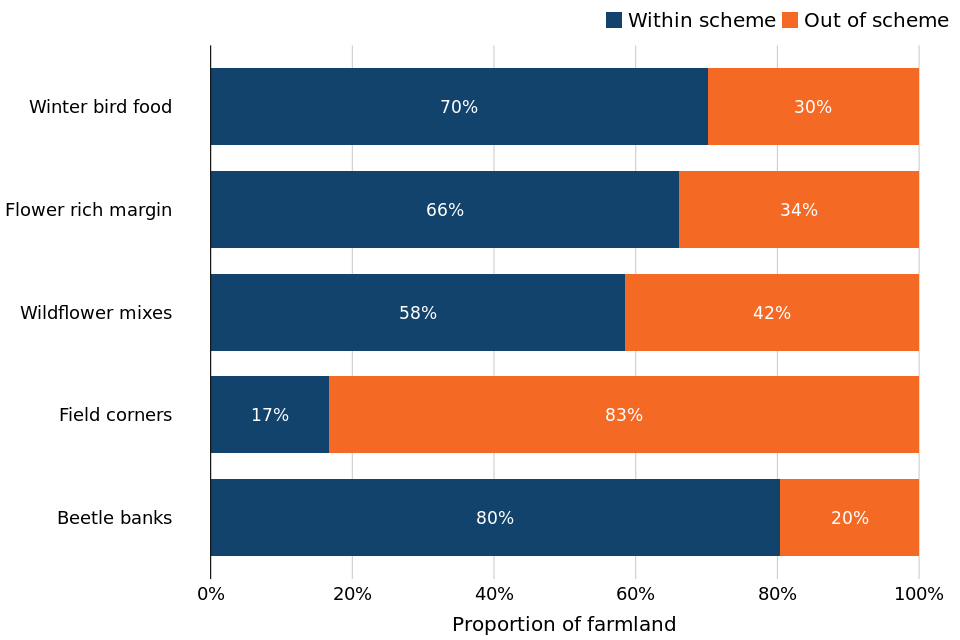
Source: Dataset table 5
Figure note: The legend is presented in the same order as the bars.
In the 2022/23 survey year, of the farmland subject to at least one nature-friendly farming activity, all activities except field corners saw a greater proportion within a scheme than outside a scheme. For the field corners activity, only 17% of farmland was covered by a scheme, with 83% not generating any agri-environment scheme payments.
3.2 Reasons for and against uptake of activities
The farm businesses that had undertaken at least one nature-friendly farming activity were asked to provide the three main reasons for choosing to do so. Options included wanting to do something positive for the environment, having the appropriate skills to do so, or because it fits in with their existing business model. A full list of reasons can be found in section 5.6.
The farm businesses that undertook at least one nature-friendly farming activity, but not all of them, were asked to provide the main reason why they did not undertake the remaining activities. The response options are described in section 1.3.
Figure 3.3 Reasons why farm businesses engaged in winter bird food practices in England, 2022/23
Source: Dataset table 6
Figure notes:
- 95% confidence intervals are presented to illustrate the range within which the true underlying population average is likely to reside, which provides an indication for the level of uncertainty associated with the sample estimate; see section 6.3 for more details.
- Farmers were asked to choose the 3 main reasons they chose to undertake this practice
- Choices with less than 10% are not shown in this chart
- For a full list of reasons, see section 5.6.
The most popular reason for FBS farms to plant winter bird food was wanting to do something positive for the environment (53% of farms), closely followed by sufficient payments from agri-environment schemes, 45% of farms.
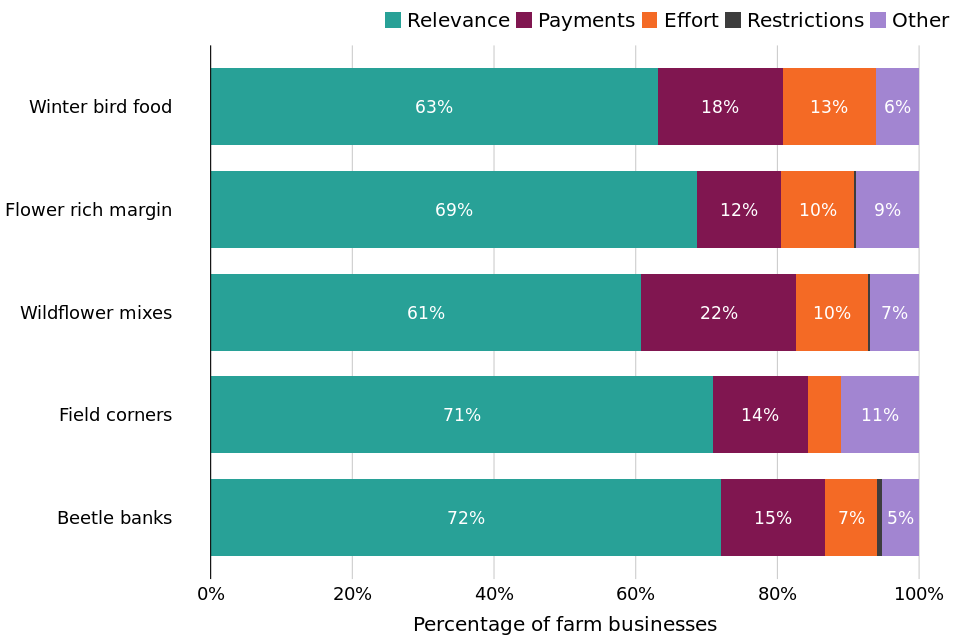
Figure 3.4 Reasons why farm businesses did not engage in nature-friendly farming activities in England, 2022/23
Source: Dataset table 8
Figure notes:
- The legend is presented in the same order as the bars.
- Text is not displayed where proportions are below 5%.
- For a full list of reasons, see section 5.6.
- This chart refers to the subset of farm businesses that had undertaken at least one nature-friendly farming activity.
Across all nature-friendly farming activities, the primary reason for farms not to undertake a practice was because it was not relevant or would disrupt their existing farming systems. The second most common reason was insufficient payments, for example, 22% of farms attributed this as the main reason why they were not applying wildflower mixes.
3.3 Costs and time
This section outlines the average costs and time associated with nature-friendly farming activities. Costs are categorised into annual crop costs, long-term establishment and maintenance, and creation and management, including contractor fees and material expenses. Contractor costs refer to services involving machinery, while material costs cover all non-labour expenses. Time is recorded in hours, accounting for tractor hours, labour (paid, unpaid, and volunteer), and administration.
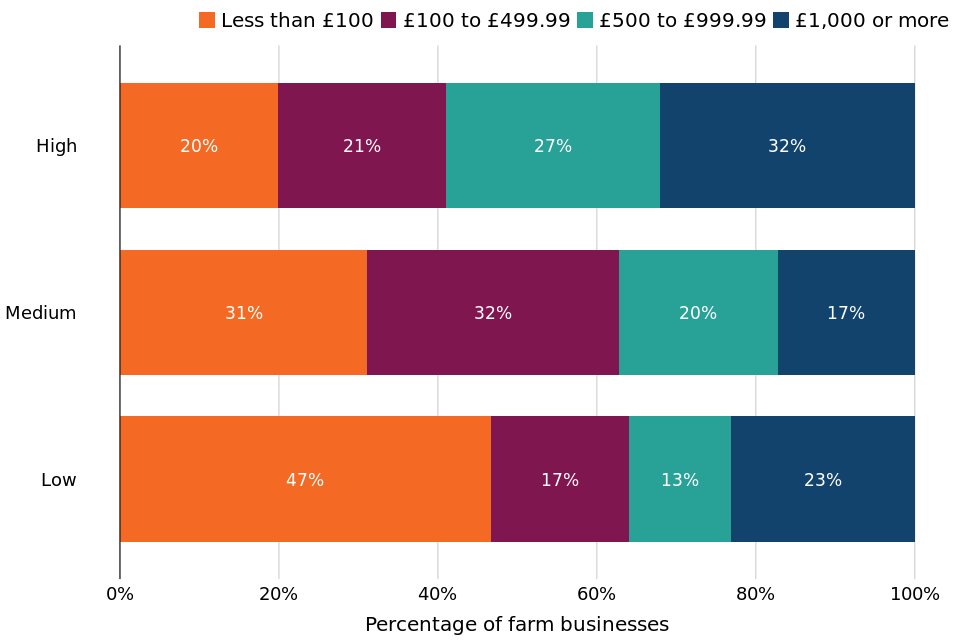
Figure 3.5 Distribution of total annual costs associated with nature-friendly farming activities by farm economic performance band in England, 2022/23
Source: Dataset table 9
Figure note: The legend is presented in the same order as the bars.
In the 2022/23 survey year, the amount farm businesses spent on nature-friendly farming activities had varied considerably amongst farm economic performance bands. Of the low performing farms, almost half (47%) had spent less than £100 on these activities, whereas 32% of high performing farms had spent £1,000 or more (figure 3.5).
Table 3.2 Time spent on nature-friendly farming activities in England, 2022/23
| Nature-friendly Farming activity | Average time spent on activity | 95% Confidence Interval |
|---|---|---|
| Winter bird food | 15 hours | 8 to 22 hours |
| Flower rich margin | 10 hours | 3 to 18 hours |
| Wildflower mixes | 6 hours | 2 to 10 hours |
| Field corners | 2 hours | 1 to 4 hours |
| Beetle banks | 0 hours | 0 to 0 hours |
Source: Dataset table 10
Table notes:
- Figures are rounded to the nearest hour.
- 95% confidence intervals are presented to illustrate the range within which the true underlying population average is likely to reside, which provides an indication for the level of uncertainty associated with the sample estimate; see section 6.3 for more details.
In the 2022/23 survey year, farm businesses carrying out nature-friendly farming spent the most time planting winter bird food, taking an average of 15 hours. Least time was spent on establishing beetle banks; less than 30 minutes on average in the year.
4 Woodland creation or management
Woodland creation and management activities involve establishing and maintaining woodlands to enhance biodiversity, support ecosystem services, and improve environmental quality. For more detail on woodland creation or management and its associated activities, please see section 5.7.
In the 2022/23 survey year, 20% of farms had undertaken at least one woodland creation or management activity, shown in table 1.1. This section looks at just these farms, and so the percentages presented are a proportion of this subset of farms as opposed to the whole FBS population.
Within the woodland creation or management category, these are the following activities included within the FBS:
- Tree planting: creation of woodland that supports wildlife by linking habitats together or providing a protective buffer between them
- Hedge laying: the rejuvenation and maintenance of hedgerows on farms
- Managing deadwood in woodlands: the creating and restoring habitats for wildlife by promoting deadwood in trees
Table 4.1 Woodland creation or management activity uptake of farm businesses undertaking at least woodland creation or management activity in England, 2022/23
| Woodland Creation or Management activity | Farms Undertaking Activity | 95% Confidence Interval |
|---|---|---|
| Tree planting | 28% | 19% to 37% |
| Hedge laying | 65% | 56% to 75% |
| Managing deadwood in woodlands | 24% | 16% to 33% |
Source: Dataset table 2.1
Table notes:
- The percentages in this table refer to the subset of farm business that undertake at least one woodland creation or management activity.
- Figures are rounded to the nearest 1%.
- 95% confidence intervals are presented to illustrate the range within which the true underlying population average is likely to reside, which provides an indication for the level of uncertainty associated with the sample estimate; see section 6.3 for more details.
In the 2022/23 survey year, of the farms who were undertaking at least one woodland creation or management activity, hedge laying was the most popular activity, at 65% of farms. Managing deadwood in woodlands was the least popular activity, at 24% of the farms, and 28% of the farms planted trees
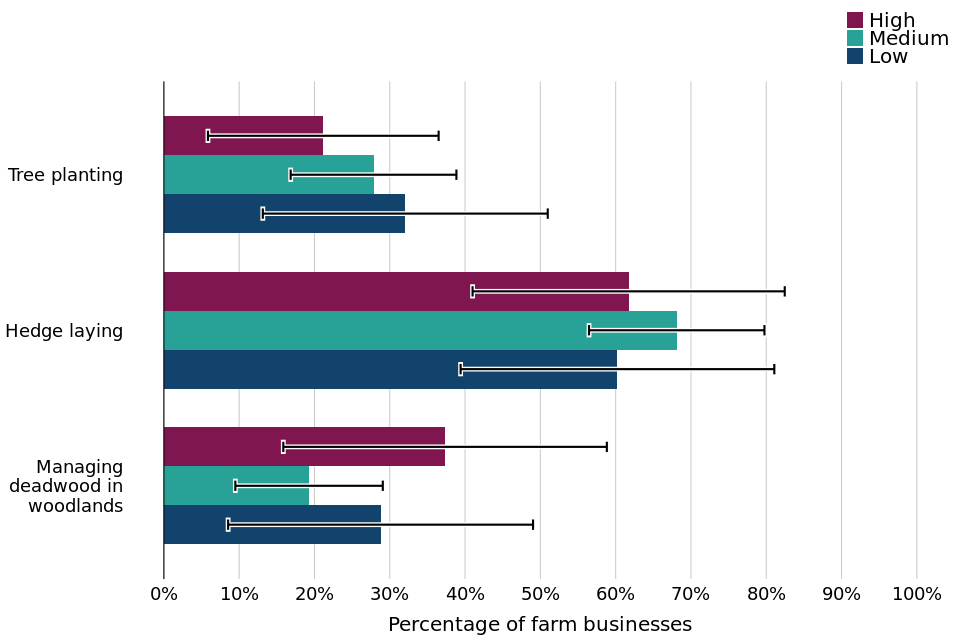
Figure 4.1 Woodland creation or management activity uptake of farm businesses undertaking at least one woodland creation or management activity by farm economic performance band in England, 2022/23
Source: Dataset table 2.2
Figure notes:
- The legend is presented in the same order as the bars.
- 95% confidence intervals are presented to illustrate the range within which the true underlying population average is likely to reside, which provides an indication for the level of uncertainty associated with the sample estimate; see section 6.3 for more details.
Of the farm businesses that engaged in at least one woodland creation or management activity, 62% of high performing farms adopted hedge laying practices, which was a similar amount to low performing farms (60%). High performing farms saw the lowest proportion of farms (21%) engaging in tree planting, compared to 32% of low performing farms.
4.1 Farmland under woodland creation or management activities
The data presented here examine the subset of farms who engaged in woodland creation or management activities in 2022/23, along with the split between those doing them in scheme or out of scheme.
Figure 4.2 Farmland with woodland creation or management activities by scheme registration and activity type in England 2022/23
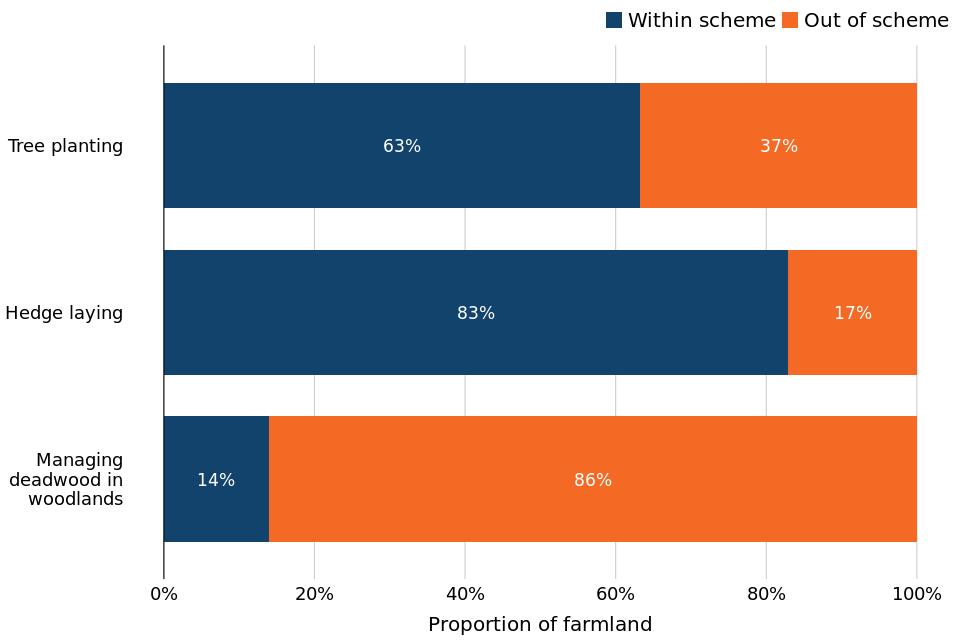
Source: Dataset table 5
Figure note: The legend is presented in the same order as the bars.
In the 2022/23 survey year, 63% of farmland planted with trees were registered in an agri-environment scheme. Similarly, hedge laying had the majority of farmland (83%) within scheme, with only 17% out of scheme. Farmland where deadwood was being managed in woodlands was mostly (86%) out of scheme.
4.2 Reasons for and against uptake of activities
The farm businesses that had undertaken at least one woodland creation or management activity were asked to provide the three main reasons for choosing to do so. Options included wanting to do something positive for the environment, having the appropriate skills to do so, or because it fits in with their existing business model. A full list of reasons can be found in section 5.6.
The farm businesses that undertook at least one woodland creation or management activity, but not all of them, were asked to provide the main reason why they did not undertake the remaining activities. The response options are described in section 1.3.
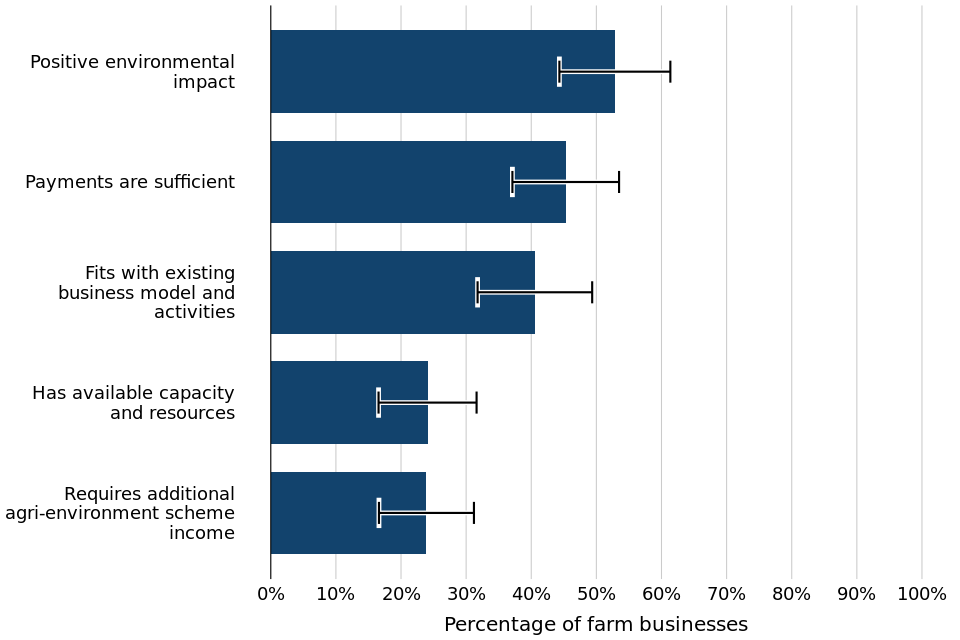
Figure 4.3 Reasons why farm businesses engaged in hedge laying practices in England, 2022/23
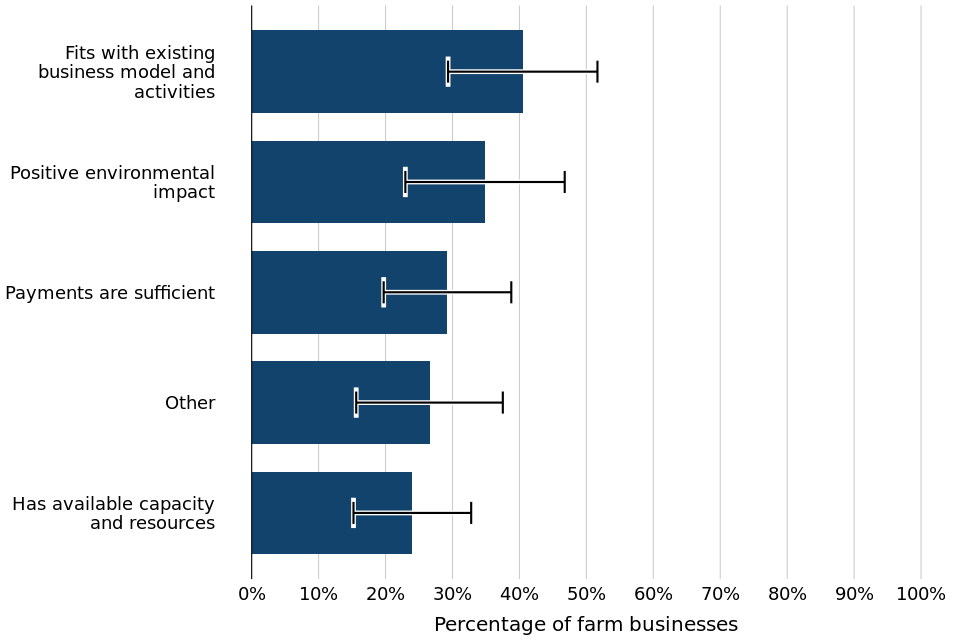
Source: Dataset table 6
Figure notes:
- Farmers were asked to choose the 3 main reasons they chose to undertake this practice
- Choices with less than 20% are not shown in this chart
The most popular reason, at 53% of farms, to lay hedges was because this activity fitted in with the existing business model and activities of the farms choosing to carry out this activity, closely followed by wanting to make a positive environmental impact, at 35% of farms.
Figure 4.4 Reasons why farm businesses did not engage in woodland creation or management activities in England, 2022/23
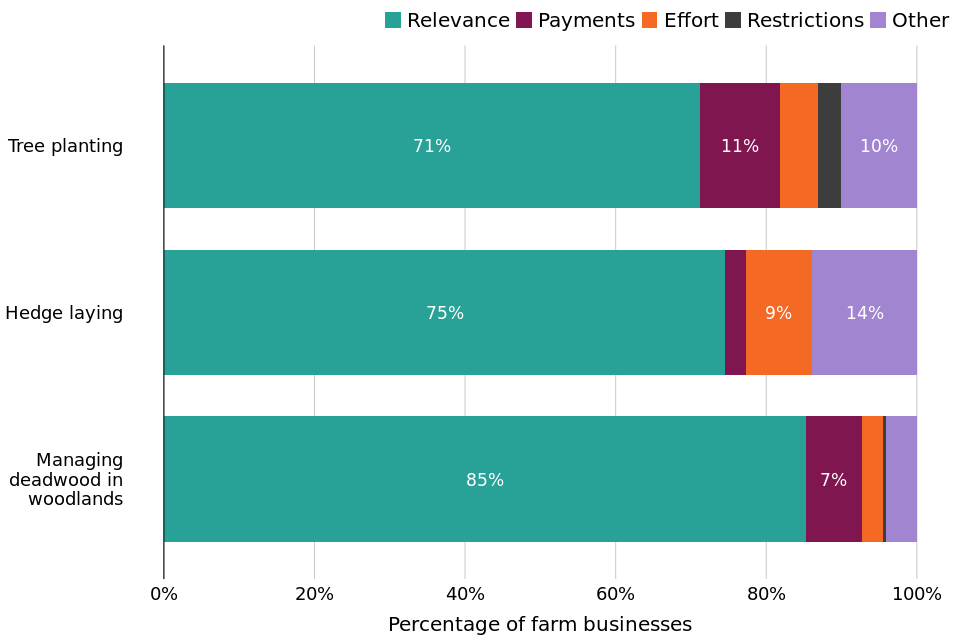
Source: Dataset table 8
Figure notes:
- The legend is presented in the same order as the bars.
- Text is not displayed where proportions are below 5%.
- For a full list of reasons, see section 5.6.
- This chart refers to the subset of farm businesses that had undertaken at least one woodland creation or management activity.
The main reason farms did not engage in woodland creation or management activities was that these practices were not relevant or would disrupt their existing farming systems. Insufficient payments were the second biggest barrier to tree planting and managing deadwood (11% and 7% of farms respectively). For hedge laying, the second most common barrier was other reasons, not covered by the survey options (14% of farms).
4.3 Costs and time
This section outlines the costs and time associated with woodland creation or management activities. Costs are categorised into annual crop costs, long-term establishment and maintenance, and creation and management, including contractor fees and material expenses. Contractor costs refer to services involving machinery, while material costs cover all non-labour expenses. Time is recorded in hours, accounting for tractor hours, labour (paid, unpaid, and volunteer), and administration.
Figure 4.5 Distribution of total annual costs associated with woodland creation or management activities by farm economic performance band in England, 2022/23
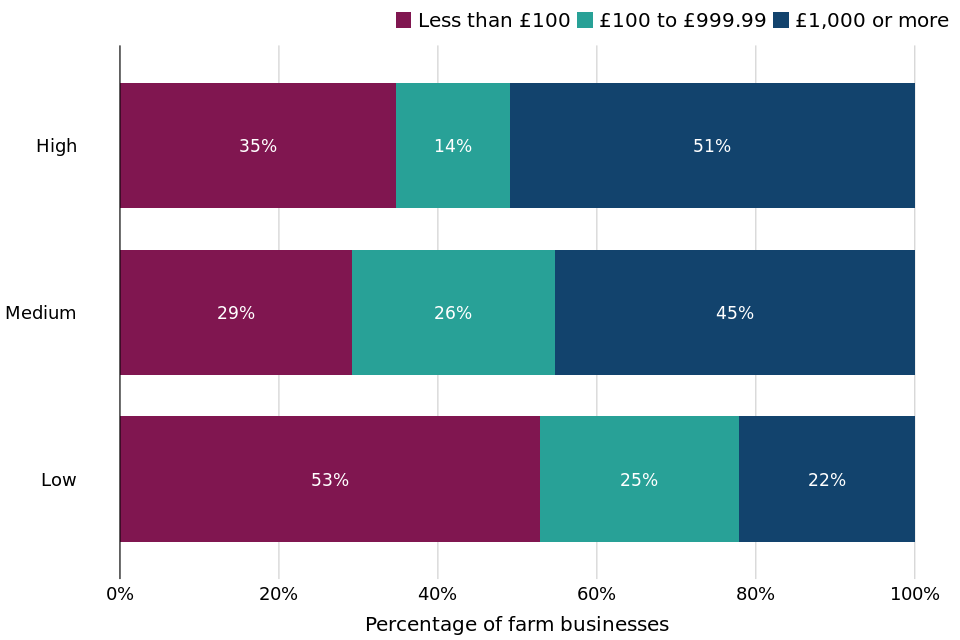
Source: Dataset table 9
Figure note: The legend is presented in the same order as the bars.
In the 2022/23 survey year, the amount farm businesses had spent on woodland creation or management activities varied amongst farm economic performance bands. Of the low performing farms, over half (53%) spent less than £100 on these activities, whereas in contrast 51% of high performing farms spent £1,000 or more.
Table 4.2 Time spent on woodland creation or management activities in England, 2022/23
| Woodland Creation or Management activity | Average time spent on activity | 95% Confidence Interval |
|---|---|---|
| Tree planting | 12 hours | 5 to 20 hours |
| Hedge laying | 41 hours | 29 to 52 hours |
| Managing deadwood in woodlands | 9 hours | 4 to 15 hours |
Source: Dataset table 10
Table note:
- Figures are rounded to the nearest hour.
- 95% confidence intervals are presented to illustrate the range within which the true underlying population average is likely to reside, which provides an indication for the level of uncertainty associated with the sample estimate; see section 6.3 for more details.
In the 2022/23 survey year, the woodland creation or management activity that took the longest amount of time was hedge laying, which took farm businesses an average of 41 hours. Managing deadwood in woodlands was the least time-intensive activity, taking 9 hours on average in the year.
5 What you need to know about this release
5.1 Contact details
Responsible statistician: Rakin Ahad
Email: fbs.queries@defra.gov.uk
For media queries between 9am and 6pm on weekdays:
Telephone: 0330 041 6560
Email: newsdesk@defra.gov.uk
5.2 National Statistics Status
Accredited official statistics are called National Statistics in the Statistics and Registration Service Act 2007. An explanation can be found on the Office for Statistics Regulation website. Our statistical practice is regulated by the Office for Statistics Regulation (OSR). OSR sets the standards of trustworthiness, quality and value in the Code of Practice for Statistics that all producers of official statistics should adhere to.
These accredited official statistics were independently reviewed by the Office for Statistics Regulation in January 2014. They comply with the standards of trustworthiness, quality and value in the Code of Practice for Statistics and should be labelled ‘accredited official statistics’.
You are welcome to contact us directly with any comments about how we meet these standards (see contact details above). Alternatively, you can contact OSR by emailing regulation@statistics.gov.uk or via the OSR website.
Since the latest review by the Office for Statistics Regulation, we have continued to comply with the Code of Practice for Statistics, and have made the following improvements:
-
Reviewed and improved data presentation to better meet accessibility guidelines
-
Automated production of the statistics using Reproducible Analytical Pipelines (RAP)
-
Reviewed and improved accompanying commentary.
5.3 User engagement
As part of our ongoing commitment to compliance with the Code of Practice for Official Statistics we wish to strengthen our engagement with users of these statistics and better understand the use made of them and the types of decisions that they inform.
We invite users to make contact to advise us of the use they do, or might, make of these statistics, and what their wishes are in terms of engagement. Feedback on this statistical release and enquiries about these statistics are also welcome.
5.4 Survey content, methodology and data uses
The Farm Business Survey is an annual survey providing information on the financial position, physical characteristics, and economic performance of farm businesses in England. The sample of farm businesses covers all regions of England and all types of farming.
Data for the Farm Business Survey are collected through face-to-face interviews with farmers, conducted by highly trained research officers.
The data are widely used by the industry for benchmarking and inform wider research into the economic performance of the agricultural industry, as well as for evaluating and monitoring current policies. The data will also help to monitor farm businesses throughout the Agricultural Transition period.
5.5 Availability of results
All Defra statistical notices can be viewed on the Statistics at Defra page.
More publications and results from the Farm Business Survey are available on the Farm Business Survey Collection page.
5.6 Qualitative response options
Reasons for choosing an activity
For farms that had undertaken any agri-environment activity, they were asked to give the top 3 reasons why they undertook it from the following list of options:
- I already have the knowledge/skills to do this
- I have capacity and resources available to do this
- This fits in with my current farm business model and activities
- I want to do something positive for the environment
- I recognise I need to change my current farm business model, and this would help me to do so
- I’m aware that other farmers and/or land managers are doing this action and it’s working for them
- I am looking for, or need, the additional income in an Agri-environment Scheme
- I can develop the skills to do this and I’m willing to learn
- The agri-environment scheme payment rates make it worth my while
- To save costs and/or improve soil health
- Other
Reasons for not undertaking an agri-environment activity
Farms that did not undertake any agri-environment activities were asked to provide the leading reason as to why they did not. Farms that did undertake at least one activity within an agri-environment category were asked why they did not for each activity within the category that they did not engage in.
In each of these cases, farmers were asked to select the main reason from the following list of options:
- I do not understand or have the specific skills and knowledge to do this action
- Too much administrative effort
- Too much field work effort
- Too much mental effort
- The payments are not sufficient
- The environmental risks from doing the action are too high
- I cannot within the terms of my tenancy agreement
- Not relevant, or will disrupt my farming system
- Other
5.7 Glossary of agri-environment activities
The below management actions are examples of environmentally-beneficial practices being employed within and outside of Defra schemes. These themes and actions are not an exhaustive list of what is available through Defra schemes, and are only a subset of possible theme actions.
Soil management
A soil management plan is a strategy used by farmers and land managers to maintain and improve soil health. It involves assessing soil conditions, identifying issues like compaction or erosion, and implementing practices to address them. The plan aims to enhance crop yields, protect the environment, and ensure sustainable land use. Actions can include crop rotation, cover cropping, and managing water runoff. Regular updates and monitoring are essential to adapt to changing conditions and continue improving soil quality.
Within the soil management category asked in the FBS, the following activities are included:
- Green cover for grass
- Multi-species cover
- Other cover
- Minimum-tillage or no-tillage
- Herbal leys: Inclusion of clover, herbs or legumes
Cover crops are fast-growing annual plants sown between main cash crops to improve soil health and fertility. They enhance soil structure, increase organic matter, recycle nutrients, and reduce soil erosion by protecting the soil surface from wind and water runoff. Cover crops support sustainable farming, improving long-term agricultural productivity and environmental stewardship.
Minimum-tillage and no-tillage (sometimes abbreviated to min-till and no-till) are agricultural practices aimed at reducing soil disturbance. Minimum-tillage involves using mechanical methods other than ploughing, such as shallow cultivations (up to 15 centimetres), avoiding soil turnover, limiting cultivation passes, and using lighter machinery like tines or light discs. No-tillage eliminates the use of cultivation machinery altogether, employing direct drilling to plant crops, thereby minimising soil disturbance even further.
Herbal leys are a blend of grasses, legumes, and herbs that enhance soil fertility, increase mineral availability in forage, improve drought tolerance, and promote biodiversity. They can be used as cover crops in arable rotations or as forage for livestock.
Nature-friendly farming
Nature-friendly farming is an agricultural approach that enhances biodiversity and environmental health while maintaining productivity. It includes practices such as providing food for birds in winter, planting various flowers and promoting wildlife habitats. Benefits include better soil fertility, reduced erosion and increased biodiversity through organic matter and natural pest control.
This has been split into the following activities within the FBS:
- Winter bird food
- Flower rich margin
- Wildflower mixes
- Field corners
- Beetle banks
Providing winter bird food is a practice applied to arable land, temporary grassland, and bush orchards. It involves planting crops that produce small seeds, which serve as essential food for farmland birds during autumn and winter. The flowering plants within these crops support insects like bumblebees, solitary bees, butterflies, and hoverflies, contributing to overall biodiversity.
Planting flower mixtures is a nature-friendly farming practice implemented on arable land, temporary grass, and bush orchards. These flower-rich grass margins or plots create vital habitats and foraging areas for invertebrates, including wild pollinators like bumblebees, solitary bees, butterflies, and hoverflies, as well as for farmland birds such as the yellowhammer.
Setting up insect habitats involve setting aside small areas within permanent grasslands to create year-round habitats for wildlife, and establishing beetle banks on arable land and temporary grassland. These practices provide crucial nesting and foraging sites for pollinators, small mammals, farmland birds, and beneficial insects that help manage crop pests.
Woodland creation or management
Woodland creation and management involve establishing and maintaining woodlands to enhance biodiversity, support ecosystem services, and improve environmental quality. This process includes the strategic planting of native tree species to form new woodland areas, the traditional technique of hedge laying to manage and encourage dense growth in hedgerows for wildlife habitats, and the retention and management of deadwood within woodlands to provide crucial habitats for insects, fungi, and microorganisms while recycling nutrients back into the ecosystem.
Within the woodland creation or management category, these are the following activities included within the FBS:
- Tree planting
- Hedge laying
- Managing deadwood in woodlands
Tree planting is intended to help create woodland that supports wildlife by linking habitats together or providing a protective buffer between them; reduces the risk of floods, improves water quality and prevents soil erosion; is resilient and can adapt to climate change and enhances the landscape.
Hedge laying is a woodland management activity involving the rejuvenation and maintenance of hedgerows on farms. It includes actions such as laying hedgerows, gapping-up, and planting new hedges. These practices are applied to boundary lines of native shrubs, ensuring they are over 20 metres long, under 5 metres wide, and managed by the landowner on both sides. These activities support the creation and continuity of hedgerows, enhancing farm biodiversity and are eligible for Countryside Stewardship Capital Grants under the Sustainable Farming Incentive (SFI) pilot.
Managing deadwood in woodlands involves creating and restoring habitats for wildlife by promoting deadwood in trees. This activity includes the deliberate aging or damaging of younger trees to mimic natural processes, benefiting species reliant on deadwood. It’s applicable under Countryside Stewardship Higher Tier, especially where there’s a generational gap between veteran trees. Restoring upland wood pasture and parkland also supports the conservation of veteran trees and the continuity of tree populations, providing habitats for invertebrates and other wildlife while maintaining traditional grazing practices and historic landscape features.
Water quality
Water quality agri-environment activities are measures designed to enhance and protect the quality of water by reducing pollution and improving habitat connectivity. This includes establishing buffer strips, ranging from 4 metres to 24 metres, along the edges of cultivated fields and watercourses to filter out pollutants like sediments, nutrients, and pesticides before they reach water bodies. Buffer strips also provide wildlife habitat and link existing features. Riparian management strips further help by excluding livestock from watercourses, preventing erosion, and mitigating pollutant runoff. Overall, these practices contribute to improved water quality, healthier ecosystems, and better habitat connectivity.
Habitat creation
Habitat creation is the process of establishing new or enhancing existing natural environments to support specific wildlife and plant species. This involves activities such as converting arable or improved land into species-rich grasslands, wet grasslands, or inter-tidal and saline habitats. Habitat creation aims to improve biodiversity by providing suitable conditions for various priority species, such as breeding waders, wildfowl, and specialised coastal plants, while also preserving or restoring critical landscape features and maintaining ecological balance.
Integrated pest management
Integrated pest management is a sustainable approach to pest control that minimizes reliance on chemical insecticides by employing various techniques. This includes recording non-use of insecticides to promote natural predators, companion cropping which involves growing additional crops to support the main crop’s growth and reduce pest damage, such as using buckwheat with oilseed rape to control cabbage stem flea beetles. Trap cropping involves planting crops that attract pests away from the main crop, reducing the need for insecticides. Sequential cropping and parallel cropping are practices used to disrupt pest life cycles and reduce pest populations by changing or alternating host plants, though they are less common in the UK due to growing season constraints and field sizes.
Agricultural decarbonisation
Agricultural decarbonisation involves strategies aimed at reducing greenhouse gas emissions and minimizing pollution from agricultural practices. This includes improved slurry storage solutions such as roofing for high-risk areas like manure and slurry stores to prevent contamination from rainfall. It also includes installing self-supporting or floating covers for slurry and anaerobic digestate stores to prevent rainwater ingress and reduce ammonia emissions. These measures contribute to lower greenhouse gas emissions, enhanced air and water quality, and more effective management of agricultural effluents.
Peatland restoration
Peatland restoration is the process of rehabilitating degraded peatlands to restore their ecological functions and support native biodiversity. This includes managing and creating fen habitats to enhance wildlife value, rewetting peat soils to prevent degradation and reduce carbon emissions, and maintaining raised water levels to improve soil health and flood management. Restoration activities may involve reducing stocking density, promoting healthy vegetation, and managing lowland raised bogs. Successful peatland restoration helps sustain characteristic peatland vegetation, such as sphagnum moss, improves natural flood management, and supports diverse plant and animal species.
6 Technical note
6.1 Survey coverage and weighting
The Farm Business Survey only includes farm businesses with a Standard Output of at least 25 thousand Euros, based on activity recorded in the previous June Survey of Agriculture and Horticulture. In 2022/23, the sample of 1,359 farms represented approximately 52,500 farm businesses in England.
Initial weights are applied to the Farm Business Survey records based on the inverse sampling fraction for each design stratum (farm type and farm size). Dataset Table 16 within the Farm Accounts in England Dataset shows the distribution of the sample compared with the distribution of businesses from the 2021 June Census of Agriculture and Horticulture. These initial weights are then adjusted, using calibration weighting, so that they can produce unbiased estimates of a number of different target variables. More detailed information about the Farm Business Survey can be found on the technical notes and guidance page. This includes information on the data collected, information on calibration weighting and definitions used within the Farm Business Survey.
Questions on farm agri-environment activities were optional for the 2022/23 survey; the data used for this analysis is from the farms which answered these optional questions. In 2022/23 this subsample consisted of 989 farms (73% of the full sample). This subsample has been reweighted using a method that preserves marginal totals for populations according to farm type and farm size groups. As such, values shown in this publication may not exactly match results calculated using the main FBS weights.
6.2 Definitions
Farm type
Where reference is made to the type of farm in this document, this refers to the ‘robust type’, which is a standardised farm classification system. For this publication, mixed, horticulture, poultry and pig farms have been merged into a single farm type category called ‘other’ farms.
Farm economic performance
Economic performance for each farm is measured as the ratio between economic output (mainly sales revenue) and inputs (costs). The inputs for this calculation include an adjustment for unpaid manual labour. The higher the ratio, the higher the economic efficiency and performance. The farms are then ranked and allocated to performance bands based on economic performance percentiles:
Table 6.1: Allocation of economic performance bands
| Performance band | Definition |
|---|---|
| High | The top 25% of economic performers |
| Medium | The middle 50% of economic performers |
| Low | The bottom 25% of economic performers |
Severely Disadvantaged Areas and Less Favoured Areas
The Severely Disadvantaged Areas (SDA) are more environmentally challenging areas. They are largely upland in character, and together with Disadvantaged Areas (DA) form the Less Favoured Areas (LFA) classification established in 1975 to provide support to mountainous and hill farming areas. LFA refers to areas where the natural characteristics (geology, altitude, climate, short growing season, low soil fertility, or remoteness) make it difficult for farmers to compete.
6.3 Accuracy and reliability of the results
It is not feasible to survey the entire population of farms, so the published figures from the Farm Business Survey are subject to sampling error. This is a fundamental premise of conducting statistical surveys, which by design aims to capture a representative sample of the underlying population through various sampling techniques.
The representation of data in this publication attempts to account for this sampling error by providing 95% confidence intervals as a measure of uncertainty for the estimated mean. This is provided as an interval in the tables and through error bars in the bar plots.
Narrower confidence intervals generally reflect larger sample sizes and greater homogeneity within the group and are thus ‘more precise’ of an indicator for where the true population mean may reside. Conversely, wider confidence intervals are generally characterised by smaller sample sizes and greater sample standard deviations, which are thus ‘less precise’. These estimates should be treated with caution.
A confidence interval is therefore a plausible range of values wherein the true underlying population mean lies within, based on the sample data it draws from. A 95% confidence interval hence refers to the interval in which there is a 95% probability that our true population mean resides.
For example, the results in table 1.1 show that the percentage of Farm Business Survey farms who engaged in the agricultural decarbonisation agri-environment category in 2022/23 was 2%, with a confidence interval of 1% to 3%, which is equivalent to 2% ± 1%. This suggests that we may be 95% confident that this range contains the true population percentage for Farm Business Survey farms who engaged in the agricultural decarbonisation agri-environment category.
For the Farm Business Survey, the confidence intervals shown are appropriate for comparing groups within the same year only; they should not be used for comparing with previous years, since they do not allow for the fact that many of the same farms will have contributed to the Farm Business Survey in multiple years. Confidence intervals only give an indication of the sampling error; they do not reflect any other sources of survey errors, such as non-response bias.
Percentage changes may not necessarily agree with the difference of their components due to rounding.